Asia-Pacific Automotive Parts and Components Market Research Report: Forecast (2026-2032)
By Components (Driveline & Powertrain, Engine Parts (Pistons, Gaskets, Belts, Timing Chains), Electronics, Bodies & Chassis, Braking System, Tires, Lighting Systems, Batteries, Oth ... ers (Seating, Transmission Components, etc.)), By Material (Aluminum, Steel, Plastic & Polymers, Composites, Others), By Sales Channel (Original Equipment Manufacturers (OEMs), Aftermarket), By Vehicle Type (Two-wheelers (Original Equipment Manufacturers (OEMs), Aftermarket), Three-wheelers (Original Equipment Manufacturers (OEMs), Aftermarket), Off-the-Road (Original Equipment Manufacturers (OEMs), Aftermarket), Passenger Cars (Original Equipment Manufacturers (OEMs), Aftermarket), Commercial Vehicles (Light Commercial Vehicles (LCVs) (Original Equipment Manufacturers (OEMs), Aftermarket), Medium & Heavy Commercial Vehicles (MHCVs) (Original Equipment Manufacturers (OEMs), Aftermarket))), and others Read more
- Automotive
- Jun 2026
- Pages 250
- Report Format: PDF, Excel, PPT
Asia-Pacific Automotive Parts and Components Market
Projected 6.1% CAGR from 2026 to 2032
Study Period
2026-2032
Market Size (2026)
USD 69.6 Billion
Market Size (2032)
USD 99.01 Billion
Base Year
2025
Projected CAGR
6.1%
Leading Segments
By Components: Driveline & Powertrain
Asia-Pacific Automotive Parts and Components Market Key Takeaways
- Asia-Pacific Automotive Parts and Components market size was valued at USD 65.63 billion in 2025 and is projected to grow from USD 69.6 billion in 2026 to USD 99.01 billion by 2032, exhibiting a CAGR of 6.1% during 2026–2032.
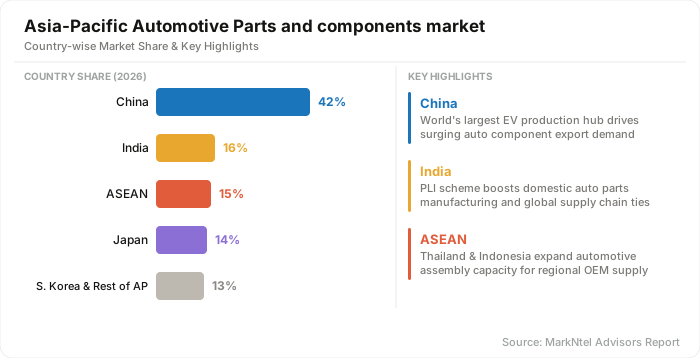
- China holds the largest regional share of about 42%, driven by its dominance as the world’s leading automotive manufacturing and consumption hub.
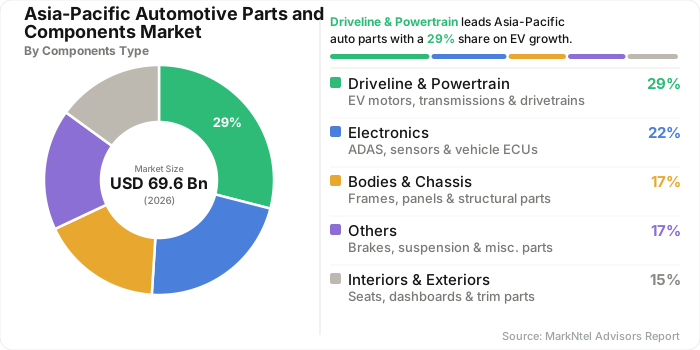
- By product type, driveline & powertrain accounts for a significant share of about 29%, supported by strong demand for transmission systems and advanced mobility components.
- By end-user, OEMs dominate with about 68% share, reflecting strong integration between automakers and tier-1 suppliers across Asia-Pacific production networks.
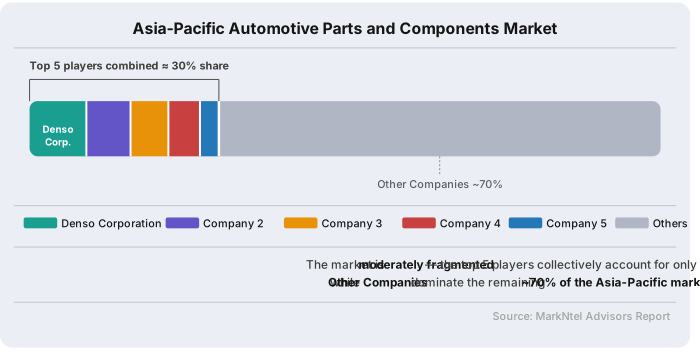
- The industry is moderately fragmented; however, the top five companies collectively account for nearly 30% market share, including leading global automotive component manufacturers operating across OEM and aftermarket channels.
Asia-Pacific Automotive Parts and Components Market Size and Outlook
The Asia-Pacific automotive parts and components market is projected to register a CAGR of approximately 6.1% during 2026–2032, driven by the region’s high vehicle production and increasing component value per vehicle. China alone produce 34.531 million vehicles in 2025, maintaining its position as the world’s largest automotive manufacturing hub. Strong vehicle demand, expanding production capacity, and rising adoption of advanced technologies such as electric vehicles, electronics, and safety systems continue to support growth in the Asia-Pacific automotive parts and components market
The growing adoption of advanced driver assistance systems (ADAS), digital cockpits, infotainment platforms, sensors, and vehicle connectivity solutions is significantly increasing the electronics content per vehicle. In addition, stricter safety regulations and rising consumer demand for premium features are driving the adoption of advanced braking systems, lightweight materials, electronic modules, and intelligent vehicle technologies across both passenger and commercial vehicles.
For example, Toyota Motor Corporation has expanded the deployment of its Toyota Safety Sense suite across a broader range of vehicle models in Asia-Pacific, integrating features such as pre-collision systems, lane departure alerts, adaptive cruise control, and driver-assistance technologies. This trend is increasing demand for sensors, cameras, radar modules, electronic control units (ECUs), and other high-value automotive components, supporting market growth across the region.
Looking ahead, the market outlook remains positive. Automakers are continuing to invest in localized production, advanced manufacturing capabilities, and more resilient supply chains. Furthermore, increasing investments in automotive electronics, software-defined vehicles, electric mobility, and next-generation transportation technologies are expected to raise the value of components per vehicle, creating substantial long-term growth opportunities for automotive parts and component companies throughout the Asia-Pacific region. Reflecting these favorable trends, the Asia-Pacific automotive parts and components market is projected to grow from USD 69.6 billion in 2026 to USD 99.01 billion by 2032.
Asia-Pacific Automotive Parts and Components Market Key Indicators
- According to the International Energy Agency (IEA), Southeast Asia recorded one of the fastest-growing EV markets globally in 2025, with electric car sales more than doubling year-on-year to exceed 500,000 units. Growing EV penetration is increasing demand for batteries, semiconductors, power electronics, sensors, and thermal management components across APAC supply chains.
- According to the World Steel Association, China produced 1.005 billion tonnes of crude steel in 2024, while India produced 149.6 million tonnes, making Asia-Pacific the dominant global steel-producing region. As automakers increasingly utilize advanced high-strength steel (AHSS) and lightweight structural materials to improve vehicle safety and efficiency, demand for specialized automotive-grade steel continues to rise. This trend supports growth in body, chassis, and structural component manufacturing while shaping procurement and material strategies across the Asia-Pacific automotive parts and components industry.
- According to the ASEAN Automotive Federation, vehicle sales across ASEAN markets exceeded 3.3 million units in 2024, supported by recovering consumer demand and increasing vehicle ownership. Higher vehicle parc expansion directly supports aftermarket demand for replacement parts, maintenance components, tires, braking systems, and electrical products.
- According to the International Organization of Motor Vehicle Manufacturers (OICA), Asia-Pacific continues to account for well over half of global vehicle production, making the region the primary demand center for automotive components, raw materials, tooling equipment, and advanced manufacturing technologies.
- According to Thailand’s EV 3.5 program (2024–2027), eligible electric vehicles receive subsidies of up to USD 2,900 per vehicle, along with reduced import duties and lower excise taxes. These incentives are accelerating EV adoption and encouraging localized manufacturing, increasing demand for batteries, power electronics, wiring harnesses, and other EV-related automotive components across Asia-Pacific.
Asia-pacific automotive parts and component market Scope:
| Category | Segments |
|---|---|
| By Components | Driveline & Powertrain, Engine Parts (Pistons, Gaskets, Belts, Timing Chains), Electronics, Bodies & Chassis, Braking System, Tires, Lighting Systems, Batteries, Others (Seating, Transmission Components, etc. |
| By Sales Channel | Aluminum, Steel, Plastic & Polymers, Composites, Others |
| By Sales Channel | Original Equipment Manufacturers (OEMs), Aftermarket |
| By Vehicle Type | Two-wheelers (Original Equipment Manufacturers (OEMs), Aftermarket), Three-wheelers (Original Equipment Manufacturers (OEMs), Aftermarket), Off-the-Road (Original Equipment Manufacturers (OEMs), Aftermarket), Passenger Cars (Original Equipment Manufacturers (OEMs), Aftermarket), Commercial Vehicles (Light Commercial Vehicles (LCVs) (Original Equipment Manufacturers (OEMs), Aftermarket), Medium & Heavy Commercial Vehicles (MHCVs) (Original Equipment Manufacturers (OEMs), Aftermarket |
Asia-pacific automotive parts and component market Growth Drivers
Expanding Automotive Production in APAC
Asia-Pacific remains the world's largest automotive manufacturing hub, supported by the strong production capabilities of China, India, Japan, and South Korea. The region benefits from competitive manufacturing costs, a skilled labour force, extensive supplier networks, and robust domestic vehicle demand. According to SIAM, India's passenger vehicle sales reached 4.3 million units in FY2024–25, reflecting sustained production activity and rising vehicle consumption. Higher vehicle assembly volumes directly increase demand for driveline systems, braking components, electronics, chassis structures, interiors, and other automotive parts supplied to OEMs and production facilities across the region.
Government policies are further accelerating automotive manufacturing and component localization across APAC. Initiatives such as India's Production Linked Incentive (PLI) Scheme for the automobile and auto-component sector, Japan's Green Growth Strategy, and expanding ASEAN industrial cooperation are encouraging investments in vehicle production, advanced manufacturing technologies, and domestic supplier development. These measures support local component sourcing, strengthen regional supply chains, and attract foreign direct investment into automotive manufacturing ecosystems. As automakers continue expanding production capacity and localization efforts, demand for automotive parts and components is expected to remain strong throughout the forecast period.
Recent Trend
Rising Adoption of Electric Vehicles Accelerating the Market Growth
Electric vehicle adoption is rapidly reshaping the Asia-Pacific automotive parts and components market. According to the International Energy Agency (IEA), global electric vehicle sales exceeded 17 million units in 2024, with EVs accounting for more than 20% of total global car sales. China sold more than 13 million electric cars in 2025, accounting for approximately 60% of global EV sales, while electric vehicles represented almost 55% of all new car sales in the country, reflecting growing consumer acceptance, improving charging infrastructure, supportive government policies, and continued advancements in battery technology. This shift is increasing the demand for EV-specific components across the regional automotive supply chain.
As vehicle electrification expands, the component mix is increasingly shifting toward high-value electronics and advanced mobility systems. Demand is rising for battery enclosures, power electronics, electric drivetrains, wiring harnesses, thermal management systems, and advanced braking technologies that support both vehicle performance and safety. The trend is no longer limited to China, as India recorded 1.97 million EV registrations in FY2024–25, highlighting the broader regional transition toward electrified mobility. This evolution is creating significant growth opportunities for suppliers specializing in next-generation automotive technologies across Asia-Pacific.
Opportunities and Challenges
Semiconductor and Supply Chain Constraints Driving Localization and Technology Upgrades
The Asia-Pacific automotive parts and components market continues to face challenges from semiconductor shortages and supply-chain disruptions. Although supply conditions have improved, demand for advanced electronics, ADAS features, connectivity systems, and EV technologies continues to place pressure on semiconductor availability. In addition, fluctuations in steel, aluminum, and rare-earth material prices, combined with logistics disruptions, can increase production costs and extend delivery timelines for automotive component manufacturers operating across the region.
These constraints are simultaneously creating opportunities for suppliers that invest in supply-chain resilience and technology partnerships. For example, Denso Corporation has expanded its collaboration with semiconductor manufacturers to secure long-term chip supply for next-generation vehicle systems, while Hyundai Motor Group continues strengthening localization strategies to reduce supply-chain risks associated with critical components. Across the region, automakers and suppliers are increasingly investing in regional sourcing networks, inventory optimization, and manufacturing automation. Companies that establish reliable semiconductor partnerships and localized production capabilities are better positioned to secure OEM contracts and capitalize on the growing demand for advanced automotive components.
Segmentation Insights
Driveline & Powertrain Leads on Strong Vehicle Production
Driveline & Powertrain is estimated to account for 29.0% of the Asia-Pacific automotive parts and components market, making it the largest component segment. The segment's leadership is supported by the region's extensive production of internal combustion engine (ICE), hybrid, and commercial vehicles, all of which require complex propulsion systems. Despite accelerating electrification, conventional and hybrid vehicles continue to represent a significant share of the vehicle fleet, sustaining strong demand for powertrain-related components across major automotive markets.
The segment includes engines, transmissions, axles, differentials, clutch systems, driveshafts, and emerging e-axle technologies used in electric vehicles. Its strong position is further supported by the growing popularity of hybrid vehicles across markets such as Japan, South Korea, and Southeast Asia, where consumers seek improved fuel efficiency without fully transitioning to battery-electric vehicles. As a result, demand for both conventional and electrified propulsion components remains robust, reinforcing the segment's market leadership. Based on components, the industry is segmented into:
- Driveline & Powertrain
- Engine Parts
- Electronics
- Bodies & Chassis
- Others
OEMs Lead Due to Expanding Vehicle Manufacturing
OEMs are estimated to account for 68.0% of the Asia-Pacific automotive parts and components market, making them the largest application segment. Their dominance is supported by the region's extensive vehicle manufacturing ecosystem, with China, India, Japan, South Korea, and Thailand serving as major assembly and export hubs. According to OICA, Asia-Pacific contributes well over half of global vehicle production, creating substantial demand for components supplied directly to automakers during vehicle assembly and platform development.
The strength of OEM demand is also reflected in the performance of major component suppliers. For example, Denso Corporation, one of the world's largest automotive suppliers, reported revenue exceeding USD 48 billion in FY2024/25, with the majority generated through OEM contracts with automakers. Similarly, suppliers such as Hyundai Mobis, Aisin, and Bosch derive a significant portion of their business from direct vehicle production programs. This highlights how large-scale manufacturing activity continues to drive component procurement across the region, reinforcing OEMs as the dominant application segment. Based on end-user market is divided into:
- OEMs
- Aftermarket
Asia-Pacific Automotive Parts and Components Market Regional Outlook
China accounted for an estimated 42.0% share of the Asia-Pacific automotive parts and components market, supported by its position as the world's largest automotive manufacturing and consumption center. In 2024, China accounted for the largest share of global vehicle output and maintained the world's highest annual vehicle sales volume, reinforcing its importance within the global automotive value chain. This scale generates substantial demand for powertrain systems, electronics, chassis components, braking systems, and EV-related parts, while supporting a highly integrated network of automotive suppliers and manufacturers.
China's leadership is further reinforced by its strong connectivity with major automotive markets such as Japan, South Korea, India, and ASEAN countries, forming one of the world's most efficient automotive manufacturing networks. Rising consumer demand for both conventional and new-energy vehicles, supported by leading domestic automakers such as BYD and Geely, continues to drive component consumption. Combined with expanding automotive exports and ongoing investments in advanced vehicle technologies, China remains the primary growth engine for the Asia-Pacific automotive parts and components industry.
Asia-Pacific Automotive Parts and Components Industry Competitive Analysis
Asia-Pacific automotive parts and components market is moderately fragmented, with Tier-1 suppliers and regional manufacturers competing across OEM and aftermarket channels. Leading companies, including Denso Corporation, Robert Bosch GmbH, Hyundai Mobis Co., Ltd., Aisin Corporation, and ZF Friedrichshafen AG, collectively account for 30% of the regional market. Competition is driven by OEM approvals, product quality, certification standards, pricing efficiency, and localized supply capabilities, while innovation remains critical in EV and electronics-related components.
Leading Companies in Asia-Pacific Automotive Parts and Components Market
- Denso
- Aisin
- Hyundai Mobis
- Bosch
- ZF Friedrichshafen
- Samvardhana Motherson
- Sumitomo Electric
- JTEKT
- Mando
- Tata AutoComp Systems
Asia-Pacific Automotive Parts and Components Industry News and Recent Developments
January 2026: Renault Expands India Manufacturing with New Duster SUV Assembly
Renault announced local production of its new Duster SUV at its Chennai manufacturing facility, strengthening its manufacturing footprint in India. The project supports the company's localization strategy and expands domestic production capacity to serve both local and regional automotive markets.
Impact Analysis: The expansion is expected to increase sourcing opportunities for local component suppliers across body structures, chassis systems, electronics, interiors, and powertrain assemblies. It also reinforces India's attractiveness as a regional manufacturing hub, supporting supplier localization, industrial investment, and long-term growth in the automotive parts and components sector.
February 2025: Mazda Announces USD 148 Million EV Manufacturing Investment in Thailand
Mazda Motor Corporation announced an investment of approximately USD 148 million (THB 5 billion) to support production of electric compact SUVs in Thailand. The investment aims to strengthen Mazda's electrification strategy in Southeast Asia while enhancing Thailand's position as a regional hub for electric vehicle manufacturing and exports.
Impact Analysis: The investment is expected to accelerate demand for locally sourced EV components, including battery systems, power electronics, electric drivetrains, wiring harnesses, and thermal management technologies. The development also supports supplier localization, strengthens regional EV supply chains, and reinforces Southeast Asia's growing importance in the Asia-Pacific automotive parts and components market.
Frequently Asked Questions
- Market Segmentation
- Introduction
- Product Definition
- Research Process
- Assumptions
- Executive Summary
- Asia-Pacific Automotive Parts and Components Import & Export
- Asia-Pacific Automotive Parts and Components Market Trends & Developments
- Asia-Pacific Automotive Parts and Components Market Supply Chain Analysis
- Asia-Pacific Automotive Parts and Components Market Dynamics
- Growth Drivers
- Challenges
- Asia-Pacific Automotive Parts and Components Market Regulations & Policies
- Asia-Pacific Automotive Parts and Components Market Hotspot & Opportunities
- Asia-Pacific Automotive Parts and Components Market Outlook, 2022-2032F
- Market Size & Analysis
- By Revenues (USD Million)
- By Quantity Sold (Million Units)
- Market Share & Analysis
- By Components- (Million Tons)
- Driveline & Powertrain
- Engine Parts (Pistons, Gaskets, Belts, Timing Chains)
- Electronics
- Bodies & Chassis
- Braking System
- Tires
- Lighting Systems
- Batteries
- Others (Seating, Transmission Components, etc.)
- By Material- (Million Tons)
- Aluminum
- Steel
- Plastic & Polymers
- Composites
- Others
- By Sales Channel- (Million Tons)
- Original Equipment Manufacturers (OEMs)
- Aftermarket
- By Vehicle Type- (Million Tons)
- Two-wheelers
- Original Equipment Manufacturers (OEMs)
- Aftermarket
- Three-wheelers
- Original Equipment Manufacturers (OEMs)
- Aftermarket
- Off-the-Road
- Original Equipment Manufacturers (OEMs)
- Aftermarket
- Passenger Cars
- Original Equipment Manufacturers (OEMs)
- Aftermarket
- Commercial Vehicles
- Light Commercial Vehicles (LCVs)
- Original Equipment Manufacturers (OEMs)
- Aftermarket
- Medium & Heavy Commercial Vehicles (MHCVs)
- Original Equipment Manufacturers (OEMs)
- Aftermarket
- Light Commercial Vehicles (LCVs)
- Two-wheelers
- By Country
- China
- Japan
- India
- South Korea
- ANZ Region
- Indonesia
- Thailand
- Malaysia
- Vietnam
- Philippines
- Rest of Asia-Pacific
- By Competition
- Market Share of Top Companies
- Competition Characteristics
- By Components- (Million Tons)
- Market Size & Analysis
- China Automotive Parts and Components Market Outlook, 2022-2032F
- Market Size & Analysis
- By Revenues (USD Million)
- Market Share & Analysis
- By Components- (Million Tons)
- By Propulsion- (Million Tons)
- By Material- (Million Tons)
- By Sales Channel- (Million Tons)
- By Vehicle Type- (Million Tons)
- Market Size & Analysis
- Japan Automotive Parts and Components Market Outlook, 2022-2032F
- Market Size & Analysis
- By Revenues (USD Million)
- Market Share & Analysis
- By Components- (Million Tons)
- By Propulsion- (Million Tons)
- By Material- (Million Tons)
- By Sales Channel- (Million Tons)
- By Vehicle Type- (Million Tons)
- Market Size & Analysis
- India Automotive Parts and Components Market Outlook, 2022-2032F
- Market Size & Analysis
- By Revenues (USD Million)
- Market Share & Analysis
- By Components- (Million Tons)
- By Propulsion- (Million Tons)
- By Material- (Million Tons)
- By Sales Channel- (Million Tons)
- By Vehicle Type- (Million Tons)
- Market Size & Analysis
- South Korea Automotive Parts and Components Market Outlook, 2022-2032F
- Market Size & Analysis
- By Revenues (USD Million)
- Market Share & Analysis
- By Components- (Million Tons)
- By Propulsion- (Million Tons)
- By Material- (Million Tons)
- By Sales Channel- (Million Tons)
- By Vehicle Type- (Million Tons)
- Market Size & Analysis
- ANZ Region Automotive Parts and Components Market Outlook, 2022-2032F
- Market Size & Analysis
- By Revenues (USD Million)
- Market Share & Analysis
- By Components- (Million Tons)
- By Propulsion- (Million Tons)
- By Material- (Million Tons)
- By Sales Channel- (Million Tons)
- By Vehicle Type- (Million Tons)
- Market Size & Analysis
- Indonesia Automotive Parts and Components Market Outlook, 2022-2032F
- Market Size & Analysis
- By Revenues (USD Million)
- Market Share & Analysis
- By Components- (Million Tons)
- By Propulsion- (Million Tons)
- By Material- (Million Tons)
- By Sales Channel- (Million Tons)
- By Vehicle Type- (Million Tons)
- Market Size & Analysis
- Malaysia Automotive Parts and Components Market Outlook, 2022-2032F
- Market Size & Analysis
- By Revenues (USD Million)
- Market Share & Analysis
- By Components- (Million Tons)
- By Propulsion- (Million Tons)
- By Material- (Million Tons)
- By Sales Channel- (Million Tons)
- By Vehicle Type- (Million Tons)
- Market Size & Analysis
- Thailand Automotive Parts and Components Market Outlook, 2022-2032F
- Market Size & Analysis
- By Revenues (USD Million)
- Market Share & Analysis
- By Components- (Million Tons)
- By Propulsion- (Million Tons)
- By Material- (Million Tons)
- By Sales Channel- (Million Tons)
- By Vehicle Type- (Million Tons)
- Market Size & Analysis
- Vietnam Automotive Parts and Components Market Outlook, 2022-2032F
- Market Size & Analysis
- By Revenues (USD Million)
- Market Share & Analysis
- By Components- (Million Tons)
- By Propulsion- (Million Tons)
- By Material- (Million Tons)
- By Sales Channel- (Million Tons)
- By Vehicle Type- (Million Tons)
- Market Size & Analysis
- Philippines Automotive Parts and Components Market Outlook, 2022-2032F
- Market Size & Analysis
- By Revenues (USD Million)
- Market Share & Analysis
- By Components- (Million Tons)
- By Propulsion- (Million Tons)
- By Material- (Million Tons)
- By Sales Channel- (Million Tons)
- By Vehicle Type- (Million Tons)
- Market Size & Analysis
- Asia-Pacific Automotive Parts and Components Market Key Strategic Imperatives for Growth & Success
- Competition Outlook
- Company Profiles
- Denso Corporation
- Business Description
- Product Portfolio
- Strategic Alliances or Partnerships
- Recent Developments
- Financial Details
- Others
- Robert Bosch GmbH
- Business Description
- Product Portfolio
- Strategic Alliances or Partnerships
- Recent Developments
- Financial Details
- Others
- HELLA GmbH & Co. KGaA
- Business Description
- Product Portfolio
- Strategic Alliances or Partnerships
- Recent Developments
- Financial Details
- Others
- ZF Friedrichshafen AG
- Business Description
- Product Portfolio
- Strategic Alliances or Partnerships
- Recent Developments
- Financial Details
- Others
- Nidec Corporation
- Business Description
- Product Portfolio
- Strategic Alliances or Partnerships
- Recent Developments
- Financial Details
- Others
- Aisin Corporation
- Business Description
- Product Portfolio
- Strategic Alliances or Partnerships
- Recent Developments
- Financial Details
- Others
- Marelli Holdings Co., Ltd.
- Business Description
- Product Portfolio
- Strategic Alliances or Partnerships
- Recent Developments
- Financial Details
- Others
- Continental AG
- Business Description
- Product Portfolio
- Strategic Alliances or Partnerships
- Recent Developments
- Financial Details
- Others
- Mitsubishi Electric Corporation
- Business Description
- Product Portfolio
- Strategic Alliances or Partnerships
- Recent Developments
- Financial Details
- Others
- Magna International Inc.
- Business Description
- Product Portfolio
- Strategic Alliances or Partnerships
- Recent Developments
- Financial Details
- Others
- Sumitomo
- Business Description
- Product Portfolio
- Strategic Alliances or Partnerships
- Recent Developments
- Financial Details
- Others
- Bridgestone
- Business Description
- Product Portfolio
- Strategic Alliances or Partnerships
- Recent Developments
- Financial Details
- Others
- Hyundai Mobis Co., Ltd.
- Business Description
- Product Portfolio
- Strategic Alliances or Partnerships
- Recent Developments
- Financial Details
- Others
- Hitachi Astemo
- Business Description
- Product Portfolio
- Strategic Alliances or Partnerships
- Recent Developments
- Financial Details
- Others
- Valeo SA
- Business Description
- Product Portfolio
- Strategic Alliances or Partnerships
- Recent Developments
- Financial Details
- Others
- Cummins Inc.
- Business Description
- Product Portfolio
- Strategic Alliances or Partnerships
- Recent Developments
- Financial Details
- Others
- Motherson Sumi
- Business Description
- Product Portfolio
- Strategic Alliances or Partnerships
- Recent Developments
- Financial Details
- Others
- Toyota Boshoku Corporation
- Business Description
- Product Portfolio
- Strategic Alliances or Partnerships
- Recent Developments
- Financial Details
- Others
- Others
- Denso Corporation
- Company Profiles
- Disclaimer
MarkNtel Advisors follows a robust and iterative research methodology designed to ensure maximum accuracy and minimize deviation in market estimates and forecasts. Our approach combines both bottom-up and top-down techniques to effectively segment and quantify various aspects of the market. A consistent feature across all our research reports is data triangulation, which examines the market from three distinct perspectives to validate findings. Key components of our research process include:
1. Scope & Research Design At the outset, MarkNtel Advisors define the research objectives and formulate pertinent questions. This phase involves determining the type of research—qualitative or quantitative—and designing a methodology that outlines data collection methods, target demographics, and analytical tools. They also establish timelines and budgets to ensure the research aligns with client goals.
2. Sample Selection and Data Collection In this stage, the firm identifies the target audience and determines the appropriate sample size to ensure representativeness. They employ various sampling methods, such as random or stratified sampling, based on the research objectives. Data collection is carried out using tools like surveys, interviews, and observations, ensuring the gathered data is reliable and relevant.
3. Data Analysis and Validation Once data is collected, MarkNtel Advisors undertake a rigorous analysis process. This includes cleaning the data to remove inconsistencies, employing statistical software for quantitative analysis, and thematic analysis for qualitative data. Validation steps are taken to ensure the accuracy and reliability of the findings, minimizing biases and errors.

4. Data Forecast and FinalizationThe final phase involves forecasting future market trends based on the analyzed data. MarkNtel Advisors utilize predictive modeling and time series analysis to anticipate market behaviors. The insights are then compiled into comprehensive reports, featuring visual aids like charts and graphs, and include strategic recommendations to inform client decision-making
We offer flexible licensing options to cater to varying organizational needs. Choose the pricing pack that best suits your requirements:
Buy Now Inquire Before Buying
 Request Customization
 Talk to our Consultant