
Global FCEV Refueling Infrastructure Market Research Report: Forecast (2026-2030)
FCEV Refueling Infrastructure Market - By Vehicle Served (Passenger Cars, Sedan, Hatchback, SUV, Commercial Vehicles, Light Commercial Vehicles, Medium & Heavy Commercial Vehicles, ... Industrial Vehicles, Forklifts, Mining Trucks, Others), By Station Type (Fixed Hydrogen Refueling Stations, Mobile/Portable Hydrogen Refueling Stations), By Fueling Pressure (350 Bar, 700 Bar, Others (Liquid Hydrogen, Cryo-Compressed, Emerging Technologies), By Station Size (Small Stations (Up to 200 kg/day), Medium Stations (201–1,000 kg/day), Large Stations (Above 1,000 kg/day), and others Read more
- Automotive
- Sep 2025
- Pages 195
- Report Format: PDF, Excel, PPT
Global FCEV Refueling Infrastructure Market
Projected 69.76% CAGR from 2026 to 2030
Study Period
2026-2030
Market Size (2025)
USD 1.34 Billion
Market Size (2030)
USD 18.92 Billion
Largest Region
Asia-Pacific
Projected CAGR
69.76%
Leading Segments
By Vehicle Served: Passenger cars
Market Insights & Analysis: Global FCEV Refueling Infrastructure Market (2026-30):
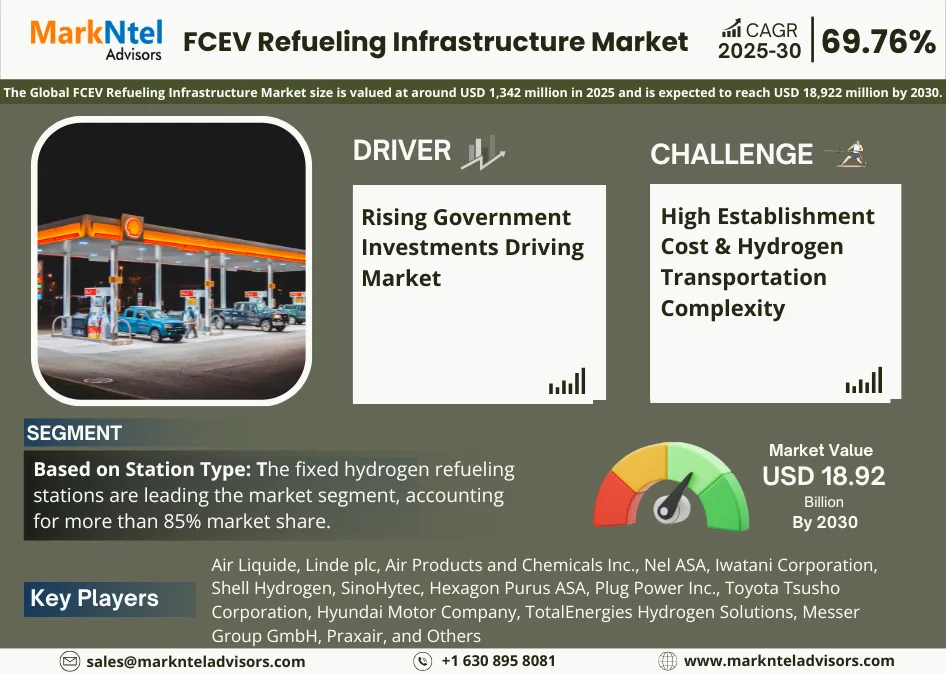
The Global FCEV Refueling Infrastructure Market size is valued at around USD 1,342 million in 2025 and is expected to reach USD 18,922 million by 2030. Along with this, the market is estimated to grow at a CAGR of around 69.76% during the forecast period, i.e., 2026-30. The Global FCEV Refueling Infrastructure Market is significantly growing due to several growth factors, including the rising shift towards sustainability and carbon neutrality goals due to high pollution generated by transportation sectors, the increasing support by the governments through initiatives, the widespread adoption of green hydrogen, and the acceptance of portable hydrogen refuelers, etc. One of the most prominent growth factors is the active collaborations between the manufacturers and the countries’ governments are encouraging the deployment of more hydrogen refueling infrastructure globally. For reference, the collaboration of Toyota (Japan) with ENEOS and the partnership between Hyundai (South Korea) and the energy companies like SK & POSCO to jointly expand hydrogen refueling infrastructure are accelerating the market growth.
Additionally, the world has witnessed a rapid inclination towards green hydrogen as a fuel, which is highly sustainable and eco-friendly, and is a potential fuel to replace conventional hydrogen for electric vehicle propulsion. For instance, Germany invested about USD8 billion to develop a green hydrogen manufacturing facility with a 5 GW electrolyzer capacity by the end of 2030, while Spain invested about USD850 million in approximately seven green hydrogen projects. Similarly, countries like China, Japan, Australia, the USA, and many more are significantly allocating funds for increasing the infrastructure for green hydrogen production. Moreover, the adoption of portable and mobile hydrogen refueling infrastructure is uplifting the market size & volume, as this transformation is beneficial to provide hydrogen fuel to the FCEVs in remote and insufficient refueling station areas. However, the complexity in hydrogen transportation and high capital investments to establish FCEC infrastructure are hindering the market.
Global FCEV Refueling Infrastructure Market Scope:
| Category | Segments |
|---|---|
| By Vehicle Served | Passenger Cars, Sedan, Hatchback, SUV, Commercial Vehicles, Light Commercial Vehicles, Medium & Heavy Commercial Vehicles, Industrial Vehicles, Forklifts, Mining Trucks, Others |
| By Station Type | Fixed Hydrogen Refueling Stations, Mobile/Portable Hydrogen Refueling Stations |
| By Fueling Pressure | 350 Bar, 700 Bar, Others (Liquid Hydrogen, Cryo-Compressed, Emerging Technologies |
| By Station Size | Small Stations (Up to 200 kg/day), Medium Stations (201–1,000 kg/day), Large Stations (Above 1,000 kg/day), and others |
Global FCEV Refueling Infrastructure Market Driver:
Rising Government Investments Driving Market – The market growth is largely driven by the growing investments in the development of hydrogen refueling infrastructure through the active support of various governments of different countries. For instance, in 2025, the US government launched DOT grants for the EV charging and hydrogen refueling infrastructure with an initial investment of about USD630 million to run about 50 EV and hydrogen refueling development projects for FCEVs. Consequently, as of 2025, the US has about 54 hydrogen refueling stations, with a majority in California.
Additionally, in 2025, under the National Green Hydrogen Mission pilot projects (India), the construction of about 9 hydrogen stations is lined up. Similarly, the European Clean Hydrogen Partnership (2025) received about USD215 million for hydrogen technologies and related infrastructure. Therefore, Europe has more than 185 hydrogen refueling stations. Moreover, the Australian government has allocated about USD2 billion to support the hydrogen refueling infrastructure in the country, thus driving the market growth.
Global FCEV Refueling Infrastructure Market Opportunity:
Rapid Shift Towards Green Hydrogen – The increasing production and widespread adoption of green hydrogen all around the world are providing ample growth opportunities in this market. For instance, China produces about 12,000 metric tons of green hydrogen, contributing to the market growth. Additionally, in 2024, the Reliance Industries, Dhirubhai Ambani Green Energy Giga Complex (India) received approximately USD10 billion to integrate the 100% renewable energy manufacturing facility for the production of fuel cell systems, electrolysers, with the large-scale production of green hydrogen.
Moreover, the RWA, Netherlands (2024) secured about USD650 million to build a green hydrogen manufacturing facility near the Magnum Power Station in Eemshaven. Similarly, the European Union received about USD1 billion to fund 15 green hydrogen projects to produce more than 2 million tons of renewable hydrogen annually. These kinds of developments are contributing to the growth & expansion of the Global FCEV Refueling Market.
Global FCEV Refueling Infrastructure Market Challenge:
High Establishment Cost & Hydrogen Transportation Complexity – One of the major challenges to this market is the high capital and maintenance cost of tanks to establish these stations over the conventional fuel stations due to the usage of electrolyzers, storage tanks, dispensing equipment, etc. The establishment of FCEVs' hydrogen refueling stations is almost 5-10 times more as compared to traditional petrol or diesel stations. For instance, the capital investment to develop a single hydrogen station ranges between USD2-USD5 million. Thus, the high development costs are hindering the market growth.
The complexity of hydrogen transfer is another major challenge in this market, which is limiting the adoption of FCEVs globally. This is due to the requirement of high-pressure storage, cryogenic transport, and specialized equipment for the safe off-site delivery of hydrogen, thereby increasing the overall costs and safety risks, thus restraining the market growth.
Global FCEV Refueling Infrastructure Market Trend:
Portable Hydrogen Refuelers Gaining Traction – The FCEV Refueling Infrastructure Market dynamics are changing through the adoption of portable and mobile hydrogen fuelers globally to provide hydrogen fuel to the FCEVs, especially to the remote areas and regions without permanent hydrogen refueling stations. Additionally, there is no requirement to build a permanent refueling infrastructure, saving construction costs. For instance, the Nikola company (2024) built mobile hydrogen trailers to refuel trucks in remote areas. Also, the HL-450D-P portable liquid hydrogen refueler by Plug Power Inc., and Malaysia's first Mobile Hydrogen Refueling Station in Putrajaya by Hydrexia Sdn Bhd are supporting the market growth.
Moreover, Toyota uses mobile fuelers to help the Mirai series, especially in California. Similarly, H3 Dynamics, Hexagon Purus, and many more are delivering portable hydrogen units for fleets, like trucks, buses, etc. These types of upgrades are accelerating the market growth.
Global FCEV Refueling Infrastructure Market (2026-30): Segmentation Analysis
The Global FCEV Refueling Infrastructure Market study of MarkNtel Advisors evaluates & highlights the major trends and influencing factors in each segment. It includes predictions for the period 2025–2030 at the global level. Based on the analysis, the market has been further classified as:
Based on Station Type:
- Fixed Hydrogen Refueling Stations
- Mobile/Portable Hydrogen Refueling Stations
Between the two, the fixed hydrogen refueling stations are leading the market segment, accounting for more than 85% market share. For instance, out of the total 1,160 hydrogen stations, more than 1,000 are fixed stations for hydrogen refueling. The dominance is due to the strategic locations of these stations on highways and fleet depots. Their high storage capacity and minimum refueling time are contributing to their dominance over the mobile fuelers, which have limited refueling capacities. Additionally, the fixed stations can be strategically constructed near the sites of on-site electrolyzers or the green energy supply, which helps in reducing the transportation costs, thereby making them a more preferred choice in this market.
Based on Vehicle Served:
-
Passenger Cars
- Sedan
- Hatchback
- SUV
- Commercial Vehicles
- Light Commercial Vehicles
- Medium & Heavy Commercial Vehicles
- Industrial Vehicles
- Forklifts
- Mining Trucks
- Others
Out of these, the passenger cars like Sedans & SUVs hold the largest market share of about 72%. These are leading due to high consumer preference for personally owned vehicles equipped with advanced technologies, including fuel cells, to reduce carbon emissions. Additionally, the supporting initiatives, like subsidies, tax exemptions, and rebates of various governments, are contributing to the dominance of the passenger car segment in this market. Consequently, the global automakers like Hyundai Motor produce over 12,000 units of passenger FCEVs, such as Hyundai NEXO, ix35 Fuel Cell, annually. Also, the production capacity of Toyota to produce Mirai is about 10,000 per year, increasing the demand for adequate refueling infrastructure.
Furthermore, as of 2024, Germany has about 1,800 passenger fuel cell electric cars, while France has about 1,000 passenger FCE cars. Similarly, Japan has more than 60% passenger FCE cars, out of over 5,000 total FCEV units. Similarly, South Korea accounts for more than 42% of the passenger FCE cars, showing the dominance of this segment in the FCEV Refueling Infrastructure Industry.
Global FCEV Refueling Infrastructure Market (2026-30): Regional Projections
Geographically, the Global FCEV Refueling Infrastructure Market expands across:
- North America
- South America
- Europe
- The Middle East & Africa
- Asia-Pacific
Asia-Pacific holds the largest market share of about 63%. The dominance is due to the high hydrogen production in countries like China, South Korea, and Japan, which is the basic fuel used for FCEVs. For instance, China is one of the world’s largest producers of hydrogen, producing about 20 million tons of hydrogen every year, contributing to the market growth. Additionally, the region has the highest number of refueling stations for FCEVs, showing the dominance of this region in the Global FCEV Refueling Infrastructure Market. As of 2024, China has about 380 hydrogen stations, while Japan possesses over 160 hydrogen refueling stations, and South Korea has approximately 200 hydrogen refueling stations for FCEVs.
Moreover, the governments of different Asia-Pacific countries like Japan, China, South Korea, Indonesia, Australia, India, etc., are significantly supporting the hydrogen refueling infrastructure. For instance, in 2024, Indonesia’s Pertamina NRE and Toyota collaborated to establish both fixed and mobile hydrogen refueling infrastructure. Similarly, by the end of 2030, China and South Korea aim to establish 1,000 and 460 new hydrogen refueling stations, respectively. These factors are contributing to the dominance of the Asia-Pacific in this global market.
Global FCEV Refueling Infrastructure Industry Recent Development:
- 2025: Air Liquide and TotalEnergies will invest over USD1 billion to build large hydrogen production plants (electrolysers) in the Netherlands (200 MW in Rotterdam, 250 MW in Zeeland). These plants are more about hydrogen supply and heavy mobility potential (which feeds refueling infrastructure) than specific station builds.
- 2025: Linde plc was selected to design, build, and operate a hydrogen refueling station (Bayport Hydrogen Refueling Station) in Bayport, Texas. This is part of a collaboration with Port Houston and a grant (~USD25 million) awarded to support that. The station is presumably for heavy‐duty trucks and the freight corridor.
Gain a Competitive Edge with Our Global FCEV Refueling Infrastructure Market Report
- Global FCEV Refueling Infrastructure Market Report by MarkNtel Advisors provides a detailed & thorough analysis of market size & share, growth rate, competitive landscape, and key players. This comprehensive analysis helps businesses gain a holistic understanding of the market dynamics & make informed decisions.
- This report also highlights current market trends & future projections, allowing businesses to identify emerging opportunities & potential challenges. By understanding market forecasts, companies can align their strategies & stay ahead of the competition.
- Global FCEV Refueling Infrastructure Market Report aids in assessing & mitigating risks associated with entering or operating in the market. By understanding market dynamics, regulatory frameworks, and potential challenges, businesses can develop strategies to minimize risks & optimize their operations.
*Reports Delivery Format - Market research studies from MarkNtel Advisors are offered in PDF, Excel and PowerPoint formats. Within 24 hours of the payment being successfully received, the report will be sent to your email address.
Frequently Asked Questions
- Market Segmentation
- Introduction
- Product Definition
- Research Process
- Assumptions
- Executive Summary
- Global FCEV Refueling Infrastructure Market Regulations and Policies
- Global FCEV Refueling Infrastructure Market Trends & Developments
- Global FCEV Refueling Infrastructure Market Dynamics
- Growth Drivers
- Challenges
- Global FCEV Refueling Infrastructure Market Hotspot & Opportunities
- Global FCEV Refueling Infrastructure Market Outlook, 2020-2030F
- Market Size & Analysis
- By Revenue (USD Million)
- Market Share & Analysis
- By Vehicle Served
- Passenger Cars- Market Size & Forecast 2020-2030, USD Million
- Sedan- Market Size & Forecast 2020-2030, USD Million
- Hatchback- Market Size & Forecast 2020-2030, USD Million
- SUV- Market Size & Forecast 2020-2030, USD Million
- Commercial Vehicles- Market Size & Forecast 2020-2030, USD Million
- Light Commercial Vehicles- Market Size & Forecast 2020-2030, USD Million
- Medium & Heavy Commercial Vehicles- Market Size & Forecast 2020-2030, USD Million
- Industrial Vehicles- Market Size & Forecast 2020-2030, USD Million
- Forklifts- Market Size & Forecast 2020-2030, USD Million
- Mining Trucks- Market Size & Forecast 2020-2030, USD Million
- Others- Market Size & Forecast 2020-2030, USD Million
- Passenger Cars- Market Size & Forecast 2020-2030, USD Million
- By Station Type
- Fixed Hydrogen Refueling Stations – Market Size & Forecast 2020–2030, USD Million
- Mobile/Portable Hydrogen Refueling Stations – Market Size & Forecast 2020–2030, USD Million
- By Fueling Pressure
- 350 Bar – Market Size & Forecast 2020–2030, USD Million
- 700 Bar – Market Size & Forecast 2020–2030, USD Million
- Others (Liquid Hydrogen, Cryo-Compressed, Emerging Technologies) – Market Size & Forecast 2020–2030, USD Million
- By Station Size
- Small Stations (Up to 200 kg/day) – Market Size & Forecast 2020–2030, USD Million
- Medium Stations (201–1,000 kg/day) – Market Size & Forecast 2020–2030, USD Million
- Large Stations (Above 1,000 kg/day) – Market Size & Forecast 2020–2030, USD Million
- By Region
- North America
- South America
- Europe
- The Middle East & Africa
- Asia-Pacific
- By Competitors
- Competition Characteristics
- Market Share & Analysis
- By Vehicle Served
- Market Size & Analysis
- North America FCEV Refueling Infrastructure Market Outlook, 2020-2030F
- Market Size & Analysis
- By Revenue (USD Million)
- Market Share & Analysis
- By Vehicle Served- Market Size & Forecast 2020-2030, USD Million
- By Fueling Pressure- Market Size & Forecast 2020-2030, USD Million
- By Station Type- Market Size & Forecast 2020-2030, USD Million
- By Station Size- Market Size & Forecast 2020-2030, USD Million
- By Country
- The US
- Canada
- Mexico
- The US FCEV Refueling Infrastructure Market Outlook, 2020-2030F
- Market Size & Analysis
- By Revenue (USD Million)
- Market Share & Analysis
- By Vehicle Served- Market Size & Forecast 2020-2030, USD Million
- By Station Type- Market Size & Forecast 2020-2030, USD Million
- By Fueling Pressure- Market Size & Forecast 2020-2030, USD Million
- By Station Size- Market Size & Forecast 2020-2030, USD Million
- Market Size & Analysis
- Canada FCEV Refueling Infrastructure Market Outlook, 2020-2030F
- Market Size & Analysis
- By Revenue (USD Million)
- Market Share & Analysis
- By Vehicle Served- Market Size & Forecast 2020-2030, USD Million
- By Station Type- Market Size & Forecast 2020-2030, USD Million
- By Fueling Pressure- Market Size & Forecast 2020-2030, USD Million
- By Station Size- Market Size & Forecast 2020-2030, USD Million
- Market Size & Analysis
- Mexico FCEV Refueling Infrastructure Market Outlook, 2020-2030F
- Market Size & Analysis
- By Revenue (USD Million)
- Market Share & Analysis
- By Vehicle Served- Market Size & Forecast 2020-2030, USD Million
- By Station Type- Market Size & Forecast 2020-2030, USD Million
- By Fueling Pressure- Market Size & Forecast 2020-2030, USD Million
- By Station Size- Market Size & Forecast 2020-2030, USD Million
- Market Size & Analysis
- Market Size & Analysis
- South America FCEV Refueling Infrastructure Market Outlook, 2020-2030F
- Market Size & Analysis
- By Revenue (USD Million)
- Market Share & Analysis
- By Vehicle Served- Market Size & Forecast 2020-2030, USD Million
- By Fueling Pressure- Market Size & Forecast 2020-2030, USD Million
- By Station Type- Market Size & Forecast 2020-2030, USD Million
- By Station Size- Market Size & Forecast 2020-2030, USD Million
- By Country
- Brazil
- Rest of South America
- Brazil FCEV Refueling Infrastructure Market Outlook, 2020-2030F
- Market Size & Analysis
- By Revenue (USD Million)
- Market Share & Analysis
- By Vehicle Served- Market Size & Forecast 2020-2030, USD Million
- By Station Type- Market Size & Forecast 2020-2030, USD Million
- By Fueling Pressure- Market Size & Forecast 2020-2030, USD Million
- By Station Size- Market Size & Forecast 2020-2030, USD Million
- Market Size & Analysis
- Market Size & Analysis
- Europe FCEV Refueling Infrastructure Market Outlook, 2020-2030F
- Market Size & Analysis
- By Revenue (USD Million)
- Market Share & Analysis
- By Vehicle Served- Market Size & Forecast 2020-2030, USD Million
- By Fueling Pressure- Market Size & Forecast 2020-2030, USD Million
- By Station Type- Market Size & Forecast 2020-2030, USD Million
- By Station Size- Market Size & Forecast 2020-2030, USD Million
- By Country
- Germany
- The UK
- France
- Italy
- Spain
- Rest of Europe
- Germany FCEV Refueling Infrastructure Market Outlook, 2020-2030F
- Market Size & Analysis
- By Revenue (USD Million)
- Market Share & Analysis
- By Vehicle Served- Market Size & Forecast 2020-2030, USD Million
- By Station Type- Market Size & Forecast 2020-2030, USD Million
- By Fueling Pressure- Market Size & Forecast 2020-2030, USD Million
- By Station Size- Market Size & Forecast 2020-2030, USD Million
- Market Size & Analysis
- The UK FCEV Refueling Infrastructure Market Outlook, 2020-2030F
- Market Size & Analysis
- By Revenue (USD Million)
- Market Share & Analysis
- By Vehicle Served- Market Size & Forecast 2020-2030, USD Million
- By Station Type- Market Size & Forecast 2020-2030, USD Million
- By Fueling Pressure- Market Size & Forecast 2020-2030, USD Million
- By Station Size- Market Size & Forecast 2020-2030, USD Million
- Market Size & Analysis
- France FCEV Refueling Infrastructure Market Outlook, 2020-2030F
- Market Size & Analysis
- By Revenue (USD Million)
- Market Share & Analysis
- By Vehicle Served- Market Size & Forecast 2020-2030, USD Million
- By Station Type- Market Size & Forecast 2020-2030, USD Million
- By Fueling Pressure- Market Size & Forecast 2020-2030, USD Million
- By Station Size- Market Size & Forecast 2020-2030, USD Million
- Market Size & Analysis
- Italy FCEV Refueling Infrastructure Market Outlook, 2020-2030F
- Market Size & Analysis
- By Revenue (USD Million)
- Market Share & Analysis
- By Vehicle Served- Market Size & Forecast 2020-2030, USD Million
- By Station Type- Market Size & Forecast 2020-2030, USD Million
- By Fueling Pressure- Market Size & Forecast 2020-2030, USD Million
- By Station Size- Market Size & Forecast 2020-2030, USD Million
- Market Size & Analysis
- Spain FCEV Refueling Infrastructure Market Outlook, 2020-2030F
- Market Size & Analysis
- By Revenue (USD Million)
- Market Share & Analysis
- By Vehicle Served- Market Size & Forecast 2020-2030, USD Million
- By Station Type- Market Size & Forecast 2020-2030, USD Million
- By Fueling Pressure- Market Size & Forecast 2020-2030, USD Million
- By Station Size- Market Size & Forecast 2020-2030, USD Million
- Market Size & Analysis
- Market Size & Analysis
- Middle East & Africa FCEV Refueling Infrastructure Market Outlook, 2020-2030F
- Market Size & Analysis
- By Revenue (USD Million)
- Market Share & Analysis
- By Vehicle Served- Market Size & Forecast 2020-2030, USD Million
- By Fueling Pressure- Market Size & Forecast 2020-2030, USD Million
- By Station Type- Market Size & Forecast 2020-2030, USD Million
- By Station Size- Market Size & Forecast 2020-2030, USD Million
- By Country
- UAE
- Saudi Arabia
- South Africa
- Rest of Middle East & Africa
- UAE FCEV Refueling Infrastructure Market Outlook, 2020-2030F
- Market Size & Analysis
- By Revenue (USD Million)
- Market Share & Analysis
- By Vehicle Served- Market Size & Forecast 2020-2030, USD Million
- By Station Type- Market Size & Forecast 2020-2030, USD Million
- By Fueling Pressure- Market Size & Forecast 2020-2030, USD Million
- By Station Size- Market Size & Forecast 2020-2030, USD Million
- Market Size & Analysis
- Saudi Arabia FCEV Refueling Infrastructure Market Outlook, 2020-2030F
- Market Size & Analysis
- By Revenue (USD Million)
- Market Share & Analysis
- By Vehicle Served- Market Size & Forecast 2020-2030, USD Million
- By Station Type- Market Size & Forecast 2020-2030, USD Million
- By Fueling Pressure- Market Size & Forecast 2020-2030, USD Million
- By Station Size- Market Size & Forecast 2020-2030, USD Million
- Market Size & Analysis
- South Africa FCEV Refueling Infrastructure Market Outlook, 2020-2030F
- Market Size & Analysis
- By Revenue (USD Million)
- Market Share & Analysis
- By Vehicle Served- Market Size & Forecast 2020-2030, USD Million
- By Station Type- Market Size & Forecast 2020-2030, USD Million
- By Fueling Pressure- Market Size & Forecast 2020-2030, USD Million
- By Station Size- Market Size & Forecast 2020-2030, USD Million
- Market Size & Analysis
- Market Size & Analysis
- Asia-Pacific FCEV Refueling Infrastructure Market Outlook, 2020-2030F
- Market Size & Analysis
- By Revenue (USD Million)
- Market Share & Analysis
- By Vehicle Served- Market Size & Forecast 2020-2030, USD Million
- By Fueling Pressure- Market Size & Forecast 2020-2030, USD Million
- By Station Type- Market Size & Forecast 2020-2030, USD Million
- By Station Size- Market Size & Forecast 2020-2030, USD Million
- By Country
- China
- India
- Japan
- South Korea
- Australia
- Rest of Asia Pacific
- China FCEV Refueling Infrastructure Market Outlook, 2020-2030F
- Market Size & Analysis
- By Revenue (USD Million)
- Market Share & Analysis
- By Vehicle Served- Market Size & Forecast 2020-2030, USD Million
- By Station Type- Market Size & Forecast 2020-2030, USD Million
- By Fueling Pressure- Market Size & Forecast 2020-2030, USD Million
- By Station Size- Market Size & Forecast 2020-2030, USD Million
- Market Size & Analysis
- India FCEV Refueling Infrastructure Market Outlook, 2020-2030F
- Market Size & Analysis
- By Revenue (USD Million)
- Market Share & Analysis
- By Vehicle Served- Market Size & Forecast 2020-2030, USD Million
- By Station Type- Market Size & Forecast 2020-2030, USD Million
- By Fueling Pressure- Market Size & Forecast 2020-2030, USD Million
- By Station Size- Market Size & Forecast 2020-2030, USD Million
- Market Size & Analysis
- Japan FCEV Refueling Infrastructure Market Outlook, 2020-2030F
- Market Size & Analysis
- By Revenue (USD Million)
- Market Share & Analysis
- By Vehicle Served- Market Size & Forecast 2020-2030, USD Million
- By Station Type- Market Size & Forecast 2020-2030, USD Million
- By Fueling Pressure- Market Size & Forecast 2020-2030, USD Million
- By Station Size- Market Size & Forecast 2020-2030, USD Million
- Market Size & Analysis
- South Korea FCEV Refueling Infrastructure Market Outlook, 2020-2030F
- Market Size & Analysis
- By Revenue (USD Million)
- Market Share & Analysis
- By Vehicle Served- Market Size & Forecast 2020-2030, USD Million
- By Station Type- Market Size & Forecast 2020-2030, USD Million
- By Fueling Pressure- Market Size & Forecast 2020-2030, USD Million
- By Station Size- Market Size & Forecast 2020-2030, USD Million
- Market Size & Analysis
- Australia FCEV Refueling Infrastructure Market Outlook, 2020-2030F
- Market Size & Analysis
- By Revenue (USD Million)
- Market Share & Analysis
- By Vehicle Served- Market Size & Forecast 2020-2030, USD Million
- By Station Type- Market Size & Forecast 2020-2030, USD Million
- By Fueling Pressure- Market Size & Forecast 2020-2030, USD Million
- By Station Size- Market Size & Forecast 2020-2030, USD Million
- Market Size & Analysis
- Market Size & Analysis
- Global FCEV Refueling Infrastructure Market Key Strategic Imperatives for Success & Growth
- Competition Outlook
- Company Profiles
- Air Liquide
- Business Description
- Product Portfolio
- Strategic Alliances or Partnerships
- Recent Developments
- Financial Details
- Others
- Linde plc
- Business Description
- Product Portfolio
- Strategic Alliances or Partnerships
- Recent Developments
- Financial Details
- Others
- Air Products and Chemicals, Inc.
- Business Description
- Product Portfolio
- Strategic Alliances or Partnerships
- Recent Developments
- Financial Details
- Others
- Nel ASA
- Business Description
- Product Portfolio
- Strategic Alliances or Partnerships
- Recent Developments
- Financial Details
- Others
- Iwatani Corporation
- Business Description
- Product Portfolio
- Strategic Alliances or Partnerships
- Recent Developments
- Financial Details
- Others
- Shell Hydrogen
- Business Description
- Product Portfolio
- Strategic Alliances or Partnerships
- Recent Developments
- Financial Details
- Others
- SinoHytec
- Business Description
- Product Portfolio
- Strategic Alliances or Partnerships
- Recent Developments
- Financial Details
- Others
- Hexagon Purus ASA
- Business Description
- Product Portfolio
- Strategic Alliances or Partnerships
- Recent Developments
- Financial Details
- Others
- Plug Power Inc.
- Business Description
- Product Portfolio
- Strategic Alliances or Partnerships
- Recent Developments
- Financial Details
- Others
- Toyota Tsusho Corporation
- Business Description
- Product Portfolio
- Strategic Alliances or Partnerships
- Recent Developments
- Financial Details
- Others
- Hyundai Motor Company
- Business Description
- Product Portfolio
- Strategic Alliances or Partnerships
- Recent Developments
- Financial Details
- Others
- TotalEnergies Hydrogen Solutions
- Business Description
- Product Portfolio
- Strategic Alliances or Partnerships
- Recent Developments
- Financial Details
- Others
- Messer Group GmbH
- Business Description
- Product Portfolio
- Strategic Alliances or Partnerships
- Recent Developments
- Financial Details
- Others
- Praxair
- Business Description
- Product Portfolio
- Strategic Alliances or Partnerships
- Recent Developments
- Financial Details
- Others
- Others
- Air Liquide
- Company Profiles
- Disclaimer
MarkNtel Advisors follows a robust and iterative research methodology designed to ensure maximum accuracy and minimize deviation in market estimates and forecasts. Our approach combines both bottom-up and top-down techniques to effectively segment and quantify various aspects of the market. A consistent feature across all our research reports is data triangulation, which examines the market from three distinct perspectives to validate findings. Key components of our research process include:
1. Scope & Research Design At the outset, MarkNtel Advisors define the research objectives and formulate pertinent questions. This phase involves determining the type of research—qualitative or quantitative—and designing a methodology that outlines data collection methods, target demographics, and analytical tools. They also establish timelines and budgets to ensure the research aligns with client goals.
2. Sample Selection and Data Collection In this stage, the firm identifies the target audience and determines the appropriate sample size to ensure representativeness. They employ various sampling methods, such as random or stratified sampling, based on the research objectives. Data collection is carried out using tools like surveys, interviews, and observations, ensuring the gathered data is reliable and relevant.
3. Data Analysis and Validation Once data is collected, MarkNtel Advisors undertake a rigorous analysis process. This includes cleaning the data to remove inconsistencies, employing statistical software for quantitative analysis, and thematic analysis for qualitative data. Validation steps are taken to ensure the accuracy and reliability of the findings, minimizing biases and errors.

4. Data Forecast and FinalizationThe final phase involves forecasting future market trends based on the analyzed data. MarkNtel Advisors utilize predictive modeling and time series analysis to anticipate market behaviors. The insights are then compiled into comprehensive reports, featuring visual aids like charts and graphs, and include strategic recommendations to inform client decision-making
We offer flexible licensing options to cater to varying organizational needs. Choose the pricing pack that best suits your requirements:
Buy Now

