

By Propulsion Type (Battery Electric Truck (BET), Plug-in Hybrid Electric Truck (PHET), Fuel Cell Electric Truck (FCET)), By Truck Type (Light-Duty Truck, Medium-Duty Truck, Heavy-......Duty Truck, Tractor-Trailer), By Application (Logistics & Parcel Delivery, Municipal Services, Construction & Mining, Retail & FMCG Delivery, Utility & Other Industrial), By Driving Range (Less Than 150 Miles, 150–300 Miles, 301–500 Miles, Above 500 Miles), By Battery Capacity (Less Than 50 kWh, 50-250 KWH, Above 250 KWH), By Motor Architecture (Single-Motor, Dual-Motor, Tri-/Quad-Motor), and others Read more
- Automotive
- Aug 2026
- 145
- PDF, Excel, PPT
US Electric Truck Market Key Takeaways
- The US electric truck market size was valued at USD 10.22 billion in 2025 and is projected to grow from USD 14.99 billion in 2026 to USD 29.28 billion by 2032.
- The industry is projected to grow at a steady CAGR of 11.81% during 2026-2032.
- By propulsion type, Battery Electric Trucks (BETs) hold a significant share of about 96% in 2026.
- By battery capacity, above 250 kWh accounted for a significant share of about 58% in 2026.
- The industry is moderately consolidated. However, the top five players collectively account for nearly 70% share.
US Electric Truck Market Size and Outlook
The electric truck market size in the United States was valued at USD 10.22 billion in 2025 and is projected to grow from USD 14.99 billion in 2026 to USD 29.28 billion by 2032. Along with this, the market is estimated to grow at a CAGR of around 11.81% during the forecast period, i.e., 2026-32.
The demand for electric trucks in the United States is increasing as fleet operators seek to lower operating costs, reduce exposure to fuel-price volatility, and advance fleet decarbonization goals. According to the U.S. Department of Energy (DOE), nearly 200 public and private fleets have committed to deploying medium- and heavy-duty zero-emission trucks, representing more than a tenfold increase from 2017. This growing fleet commitment, combined with investments in charging infrastructure and state-level zero-emission vehicle initiatives, is supporting the transition toward electric trucking.
However, the repeal of federal greenhouse-gas regulations in 2026 has introduced some uncertainty around the pace of adoption. Despite this policy shift, opportunities remain across Class 8 truck electrification, megawatt charging, regional haul, drayage, and depot-based energy solutions. Over the longer term, improvements in vehicle economics, driving range, charging infrastructure, and model availability are expected to strengthen the commercial viability of electric trucks and support continued market expansion.
US Electric Truck Market Key Indicators
- Electric truck sales in the U.S. increased 25% in 2025 to approximately 17,000 units, according to the International Energy Agency (IEA). The increase demonstrates continued demand despite changes in federal policy. More than 95% of these sales were medium-duty trucks, partly because the IEA includes Rivian electric delivery vans above 3.5 tonnes within this category. This creates substantial near-term growth potential.
- Charging infrastructure is expanding to address one of the industry's largest adoption barriers. In January 2025, the U.S. Department of Energy committed USD 68 million through its SuperTruck Charge initiative for heavy-duty charging projects near ports, distribution hubs, and major freight corridors. In May 2026, CALSTART's infrastructure map covered approximately 162 medium- and heavy-duty charging and hydrogen facilities across 17 states, representing around 1,500 charging plugs.
- Increasing deployment of Class 8 electric trucks is expanding the market beyond smaller commercial vehicles. Volvo reported in May 2026 that more than 750 VNR Electric Class 8 trucks were operating across the U.S. and Canada, collectively recording over 30 million zero-tailpipe-emission miles. This demonstrates growing commercial experience with battery-electric heavy-duty vehicles and supports expansion into regional distribution, drayage, and vocational applications.
- State-level adoption remains an important growth indicator, particularly where charging infrastructure and supportive policies are concentrated. As of June 2025, 18 U.S. states had at least 1,000 zero-emission truck deployments. California had approximately 10,659, followed by Texas with 5,201 and Florida with 5,099. CALSTART also identified California, Washington, and Wisconsin as leading states when deployments are normalized against truck populations.
U.S. Electric Truck Trade Signals: USD 42 Billion in Imports and USD 17 Billion in Exports in 2025
The U.S. commercial truck trade provides a strong indicator of the country’s expanding vehicle supply ecosystem supporting the transition toward electric trucks. In 2025, the United States imported 1.4 million commercial trucks valued at USD 42 billion, compared with exports of 352,000 units worth USD 17 billion. This resulted in a USD 25 billion trade-value gap and a 1.05 million-unit difference, highlighting the country's substantial dependence on imported commercial vehicles and components.
Mexico remained the dominant source, supplying 1.2 million units valued at USD 34 billion in 2025, representing approximately 86% of total import volume and 81% of import value. Canada ranked second, supplying 178,000 units worth USD 5.7 billion. This strong North American trade corridor is particularly relevant to electric-truck deployment as manufacturers increasingly integrate vehicle assembly, battery supply, component production, and distribution across the U.S.–Mexico–Canada region.
On the export side, Canada was the leading destination, receiving 257,000 units valued at USD 12 billion, equivalent to around 73% of U.S. commercial-truck export volume and 71% of export value. Mexico followed with 45,000 units worth USD 1.4 billion.
These trade flows indicate a highly integrated regional commercial-vehicle ecosystem that can facilitate electric truck manufacturing, fleet deployment, and component sourcing. Consequently, the depth of U.S.–Mexico–Canada trade relationships, combined with existing manufacturing and distribution infrastructure, is expected to lower market-entry barriers, strengthen vehicle availability, and support faster adoption of electric trucks among commercial fleets.
US Electric Truck Market Scope
| Category | Segments |
|---|---|
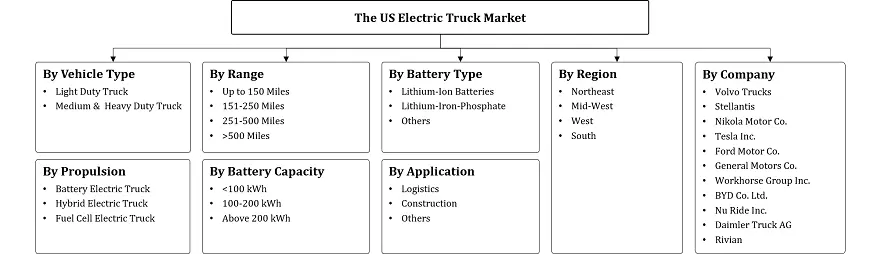
| By Propulsion Type | Battery Electric Truck (BET), Plug-in Hybrid Electric Truck (PHET), Fuel Cell Electric Truck (FCET |
| By Truck Type | Light-Duty Truck, Medium-Duty Truck, Heavy-Duty Truck, Tractor-Trailer |
| By Application | Logistics & Parcel Delivery, Municipal Services, Construction & Mining, Retail & FMCG Delivery, Utility & Other Industrial |
| By Driving Range | Less Than 150 Miles, 150–300 Miles, 301–500 Miles, Above 500 Miles |
| By Battery Capacity | Less Than 50 kWh, 50-250 KWH, Above 250 KWH |
| By Motor Architecture | Single-Motor, Dual-Motor, Tri-/Quad-Motor |
US Electric Truck Market Growth Drivers
Stringent Heavy-Duty Emission Regulations and State Zero-Emission Policies Drive U.S. Electric Truck Adoption
Stringent heavy-duty vehicle emission requirements and state-level zero-emission policies are supporting the adoption of .
State-level regulations provide an additional demand stimulus. California's Advanced Clean Trucks (ACT) regulation requires manufacturers to progressively increase zero-emission truck sales. By 2035, zero-emission sales must reach 55% of Class 2b–3 trucks, 75% of Class 4–8 straight trucks, and 40% of truck tractors. California's Advanced Clean Fleets regulation also requires eligible fleets to increase the use of zero-emission vehicles, further supporting electric truck deployment.
Importantly, the regulatory environment changed in 2026. On February 12, 2026, the EPA finalized rescission of the federal 2009 Greenhouse Gas Endangerment Finding, removing the legal basis for federal vehicle GHG standards. Therefore, the previously finalized 2024 Phase 3 GHG standards should not be treated as a current federal GHG requirement. However, federal heavy-duty criteria-pollutant standards and state-level zero-emission policies continue to create regulatory incentives for truck electrification.
- Market Segmentation
- Introduction
- Product Definition
- Research Process
- Assumptions
- Executive Summary
- US Electric Truck Market Policies, Regulations, and Product Standards
- US Electric Truck Import/Export Data Analysis, 2022-2032
- US Electric Truck Supply Chain Analysis, 2022-2032
- US Electric Truck Market Production Trend(Units) 2022-2032
- US Electric Truck Market Production Trend(Units) By Type
- Light-Duty Truck
- Medium-Duty Truck
- Heavy-Duty Truck
- Tractor-Trailer
- Company Wise Production Plants and Statistics
- Installed Production Capacity
- Actual Production
- Planned Production Target
- US Electric Truck Market Production Trend(Units) By Type
- US Electric Truck Market Pricing Analysis 2022-2032
- US Electric Truck Market Pricing Trend (USD/Units) 2022-2032
- US Electric Truck Market Pricing Trend (USD/Units) By Regions 2022-2032
- Northeast
- Midwest
- South
- West
- US Electric Truck Market Pricing Trend (USD/Units) By Type 2022-2032
- Light-Duty Truck
- Medium-Duty Truck
- Heavy-Duty Truck
- Tractor-Trailer
- US Electric Truck Market Trends & Developments
- US Electric Truck Market Dynamics
- Growth Factors
- Challenges
- US Electric Truck Market Hotspot & Opportunities
- US Electric Truck Market Outlook, 2022-2032
- Market Size & Outlook
- By Revenues (USD Million)
- By Quantity Sold (Thousand Units)
- Market Segmentation & Outlook
- By Propulsion Type- Market Size & Forecast 2022-2032, USD Million & Thousand Units
- Battery Electric Truck (BET)
- Plug-in Hybrid Electric Truck (PHET)
- Fuel Cell Electric Truck (FCET)
- By Truck Type- Market Size & Forecast 2022-2032, USD Million & Thousand Units
- Light-Duty Truck
- Medium-Duty Truck
- Heavy-Duty Truck
- Tractor-Trailer
- By Application- Market Size & Forecast 2022-2032, USD Million & Thousand Units
- Logistics & Parcel Delivery
- Municipal Services
- Construction & Mining
- Retail & FMCG Delivery
- Utility & Other Industrial
- By Driving Range- Market Size & Forecast 2022-2032, USD Million & Thousand Units
- Less Than 150 Miles
- 150–300 Miles
- 301–500 Miles
- Above 500 Miles
- By Battery Capacity- Market Size & Forecast 2022-2032, USD Million & Thousand Units
- Less Than 50 kWh
- 50-250 KWH
- Above 250 KWH
- By Motor Architecture- Market Size & Forecast 2022-2032, USD Million & Thousand Units
- Single-Motor
- Dual-Motor
- Tri-/Quad-Motor
- By Region- Market Size & Forecast 2022-2032, USD Million & Thousand Units
- Northeast
- Midwest
- South
- West
- By Company
- Competition Characteristics
- Market Share & Analysis
- By Propulsion Type- Market Size & Forecast 2022-2032, USD Million & Thousand Units
- Market Size & Outlook
- US Electric Light-Duty Truck Market Outlook, 2022-2032
- Market Size & Outlook
- By Revenues (USD Million)
- By Quantity Sold (Thousand Units)
- Market Segmentation & Outlook
- By Truck Type- Market Size & Forecast 2022-2032, USD Million & Thousand Units
- By Application- Market Size & Forecast 2022-2032, USD Million & Thousand Units
- By Driving Range- Market Size & Forecast 2022-2032, USD Million & Thousand Units
- By Battery Capacity- Market Size & Forecast 2022-2032, USD Million & Thousand Units
- By Motor Architecture- Market Size & Forecast 2022-2032, USD Million & Thousand Units
- By Region- Market Size & Forecast 2022-2032, USD Million & Thousand Units
- Market Size & Outlook
- US Electric Medium-Duty Truck Market Outlook, 2022-2032
- Market Size & Outlook
- By Revenues (USD Million)
- By Quantity Sold (Thousand Units)
- Market Segmentation & Outlook
- By Truck Type- Market Size & Forecast 2022-2032, USD Million & Thousand Units
- By Application- Market Size & Forecast 2022-2032, USD Million & Thousand Units
- By Driving Range- Market Size & Forecast 2022-2032, USD Million & Thousand Units
- By Battery Capacity- Market Size & Forecast 2022-2032, USD Million & Thousand Units
- By Motor Architecture- Market Size & Forecast 2022-2032, USD Million & Thousand Units
- By Region- Market Size & Forecast 2022-2032, USD Million & Thousand Units
- Market Size & Outlook
- US Electric Heavy-Duty Truck Market Outlook, 2022-2032
- Market Size & Outlook
- By Revenues (USD Million)
- By Quantity Sold (Thousand Units)
- Market Segmentation & Outlook
- By Truck Type- Market Size & Forecast 2022-2032, USD Million & Thousand Units
- By Application- Market Size & Forecast 2022-2032, USD Million & Thousand Units
- By Driving Range- Market Size & Forecast 2022-2032, USD Million & Thousand Units
- By Battery Capacity- Market Size & Forecast 2022-2032, USD Million & Thousand Units
- By Motor Architecture- Market Size & Forecast 2022-2032, USD Million & Thousand Units
- By Region- Market Size & Forecast 2022-2032, USD Million & Thousand Units
- Market Size & Outlook
- US Electric Tractor-Trailer Market Outlook, 2022-2032
- Market Size & Outlook
- By Revenues (USD Million)
- By Quantity Sold (Thousand Units)
- Market Segmentation & Outlook
- By Truck Type- Market Size & Forecast 2022-2032, USD Million & Thousand Units
- By Application- Market Size & Forecast 2022-2032, USD Million & Thousand Units
- By Driving Range- Market Size & Forecast 2022-2032, USD Million & Thousand Units
- By Battery Capacity- Market Size & Forecast 2022-2032, USD Million & Thousand Units
- By Motor Architecture- Market Size & Forecast 2022-2032, USD Million & Thousand Units
- By Region- Market Size & Forecast 2022-2032, USD Million & Thousand Units
- Market Size & Outlook
- US Electric Truck Market Key Strategic Imperatives for Success & Growth
- Competitive Outlook
- Company Profiles
- Daimler Truck North America LLC
- Business Description
- Product Portfolio
- Collaborations & Alliances
- Recent Developments
- Financial Details
- Others
- Orange EV
- Business Description
- Product Portfolio
- Collaborations & Alliances
- Recent Developments
- Financial Details
- Others
- Volvo Trucks North America
- Business Description
- Product Portfolio
- Collaborations & Alliances
- Recent Developments
- Financial Details
- Others
- Nikola Corporation
- Business Description
- Product Portfolio
- Collaborations & Alliances
- Recent Developments
- Financial Details
- Others
- PACCAR Inc
- Business Description
- Product Portfolio
- Collaborations & Alliances
- Recent Developments
- Financial Details
- Others
- Isuzu Motors America, LLC
- Business Description
- Product Portfolio
- Collaborations & Alliances
- Recent Developments
- Financial Details
- Others
- Workhorse Group Inc.
- Business Description
- Product Portfolio
- Collaborations & Alliances
- Recent Developments
- Financial Details
- Others
- BYD Motors Inc.
- Business Description
- Product Portfolio
- Collaborations & Alliances
- Recent Developments
- Financial Details
- Others
- Tesla, Inc.
- Business Description
- Product Portfolio
- Collaborations & Alliances
- Recent Developments
- Financial Details
- Others
- Ford Motor Company
- Business Description
- Product Portfolio
- Collaborations & Alliances
- Recent Developments
- Financial Details
- Others
- Daimler Truck North America LLC
- Company Profiles
- Disclaimer
MarkNtel Advisors follows a robust and iterative research methodology designed to ensure maximum accuracy and minimize deviation in market estimates and forecasts. Our approach combines both bottom-up and top-down techniques to effectively segment and quantify various aspects of the market. A consistent feature across all our research reports is data triangulation, which examines the market from three distinct perspectives to validate findings. Key components of our research process include:
1. Scope & Research Design At the outset, MarkNtel Advisors define the research objectives and formulate pertinent questions. This phase involves determining the type of research—qualitative or quantitative—and designing a methodology that outlines data collection methods, target demographics, and analytical tools. They also establish timelines and budgets to ensure the research aligns with client goals.
2. Sample Selection and Data Collection In this stage, the firm identifies the target audience and determines the appropriate sample size to ensure representativeness. They employ various sampling methods, such as random or stratified sampling, based on the research objectives. Data collection is carried out using tools like surveys, interviews, and observations, ensuring the gathered data is reliable and relevant.
3. Data Analysis and Validation Once data is collected, MarkNtel Advisors undertake a rigorous analysis process. This includes cleaning the data to remove inconsistencies, employing statistical software for quantitative analysis, and thematic analysis for qualitative data. Validation steps are taken to ensure the accuracy and reliability of the findings, minimizing biases and errors.

4. Data Forecast and FinalizationThe final phase involves forecasting future market trends based on the analyzed data. MarkNtel Advisors utilize predictive modeling and time series analysis to anticipate market behaviors. The insights are then compiled into comprehensive reports, featuring visual aids like charts and graphs, and include strategic recommendations to inform client decision-making
FILL THE FORM TO GET THE FREE SAMPLE PAGES
We offer flexible licensing options to cater to varying organizational needs. Choose the pricing pack that best suits your requirements:
Buy Now Inquire Before Buying
 Talk to our Consultant
 Request Customization