

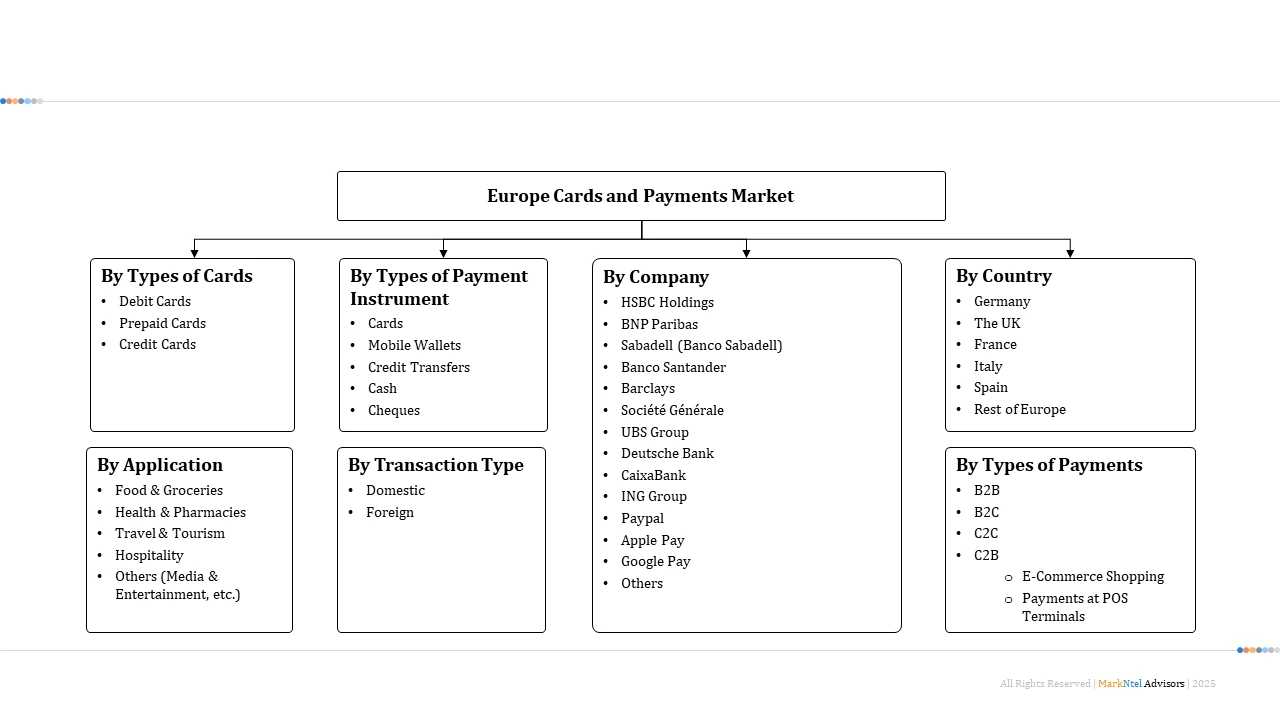
By Type of Cards (Debit Cards, Fleet/Fuel Cards, ATM Cards, Prepaid Cards, Credit Cards), By Type of Payment Instrument (Cards, Mobile Wallets, Credit Transfers, Cash, Debit Cards,...... Checks), By Type of Payments (B2B, B2C, C2C, C2B (E-Commerce Payments, Payments at POS Terminals)), By Transaction Type (Domestic, Foreign), By Application (Food & Groceries, Health & Pharmacies, Travel & Tourism, Hospitality, Others (Media & Entertainment, etc.)), By Institution Type (Financial, Non-Financial), and others Read more
- FinTech
- Jul 2026
- 245
- PDF, Excel, PPT
Europe Cards and Payments Market Key Takeaways
- The Europe cards and payments market was valued at USD 5.98 trillion in 2025 and is projected to reach USD 6.11 trillion in 2026, further expanding to USD 7.92 trillion by 2032.
- The industry is projected to witness steady growth at a CAGR of 4.42% during 2026–2032.
- Debit cards dominate the market with an estimated 52.4% share in 2026.
- By payment instrument, the cards segment leads with around a 43.8% share.
- The United Kingdom leads the industry with an estimated 22.0% share in 2026.
- The market is moderately consolidated, with the top 5 players accounting for approximately 41.2% share in 2026.
Europe Cards and Payments Market Size and Outlook
The Europe cards and payments market was valued at USD 5.98 trillion in 2025 and is projected to reach USD 6.11 trillion in 2026, further expanding to USD 7.92 trillion by 2032, registering a CAGR of 4.42% during the forecast period.
Growth is supported by increasing digital commerce, expanding cross-border transactions, and continued modernization of Europe's payment infrastructure. Regulatory initiatives, including the Instant Payments Regulation and PSD3, continue to accelerate digital payment infrastructure while fostering secure, interoperable, and efficient payment ecosystems.
According to the European Central Bank (ECB, 2025), consumers across the European area maintain an average of 2.5 payment cards per inhabitant, reflecting one of the world's most mature card ownership ecosystems. High card penetration, coupled with broad merchant acceptance and increasing integration of payment credentials into mobile wallets, continues to strengthen card payment solutions and supports sustained transaction growth across retail, transport, hospitality, and digital commerce.
The market is further reinforced by long-term investments in financial and digital infrastructure. The European Investment Bank (EIB) approved more than USD 95 billion in financing during 2024, supporting digital innovation, SME competitiveness, cybersecurity, and financial infrastructure projects across Europe. Simultaneously, the Committee on Payments and Market Infrastructures (CPMI) continues advancing interoperable fast payment systems, strengthening electronic payment systems and enabling more efficient domestic and cross-border payment flows.
Europe's payments ecosystem also benefits from continuous regulatory collaboration aimed at improving security and financial resilience. During 2024, the Financial Stability Board (FSB) progressed its cross-border payments roadmap to reduce settlement friction and improve interoperability, while the Financial Action Task Force further advanced global standards for secure digital identity and payment verification. These initiatives continue to stimulate payment technology innovation, supporting the region's transition toward a more resilient and digitally connected payments landscape.
Europe Cards and Payments Market Key Indicators
- According to the European Central Bank (ECB) approximately 879.3 million payment cards are in circulation across the euro area as of the first half of 2025. This extensive card penetration reflects the maturity of Europe's retail payments ecosystem and continues to support strong demand for card issuance, merchant acquiring, contactless acceptance infrastructure, and value-added payment services across consumer and commercial segments.
- Latest payment statistics published by the European Central Bank (ECB) show that around 29.6 billion contactless card payment transactions were executed during the first half of 2025. The continued expansion of contactless payments encourages further investment in NFC-enabled POS infrastructure and accelerates the transition toward seamless digital payment experiences across Europe.
- Recent payment system data from the European Central Bank (ECB) indicates that euro area retail payment systems process approximately 55.7 billion transactions with a combined value of nearly USD 30.8 trillion during the first half of 2025. The enormous scale of retail payment clearing reinforces the need for resilient payment infrastructure, real-time settlement capabilities, and cross-border interoperability across the European payments landscape.
- ECB payment statistics indicate that card payments account for 57% of all non-cash payment transactions in the euro area during the first half of 2025, maintaining their position as the dominant payment instrument ahead of credit transfers, direct debits, and electronic money. The sustained leadership of card-based transactions continues to drive investment in payment gateways, card issuance, tokenization technologies, merchant acquiring services, and omnichannel payment acceptance across Europe
Europe Cards and Payments Market Scope
| Category | Segments |
|---|---|
| By Type of Cards | Debit Cards, Fleet/Fuel Cards, ATM Cards, Prepaid Cards, Credit Cards |
| By Type of Payment Instrument | Cards, Mobile Wallets, Credit Transfers, Cash, Debit Cards, Checks |
| By Type of Payments | B2B, B2C, C2C, C2B (E-Commerce Payments, Payments at POS Terminals |
| By Transaction Type | Domestic, Foreign |
| By Application | Food & Groceries, Health & Pharmacies, Travel & Tourism, Hospitality, Others (Media & Entertainment, etc. |
| By Institution Type | Financial, Non-Financial |
Europe Cards and Payments Market Growth Drivers
Regulatory Reforms Accelerate the Evolution of Digital Payment Infrastructure
The European Union's regulatory agenda continues to reshape the Europe cards and payments industry by strengthening the foundation for open banking solutions and real-time payment infrastructure. In 2024, the European Parliament and the Council formally adopted the Instant Payments Regulation (EU) 2024/886, requiring euro area payment service providers to offer instant credit transfers at charges no higher than standard transfers while enhancing payment verification through the mandatory Verification of Payee (VoP) framework. These measures foster greater competition, improve payment efficiency, and accelerate innovation across Europe's digital payments ecosystem.
Simultaneously, the European Commission advances negotiations on the PSD3 and Payment Services Regulation (PSR) legislative package to reinforce consumer protection, expand open finance capabilities, and strengthen fraud prevention across electronic payments. Complementing these reforms, the European Banking Authority develops technical standards to support consistent implementation across member states, creating a more interoperable regulatory environment. The evolving framework encourages financial institutions, fintech firms, and merchants to invest in real-time payment infrastructure and next-generation payment services, supporting sustained expansion of the European payments industry.
- Market Segmentation
- Introduction
- Product Definition
- Research Process
- Assumptions
- Executive Summary
- Europe Cards & Payments Market Customer Survey
- By Type of Transaction
- By Banking Experience
- By Frequency of Transactions from Card
- By Purpose of Transaction
- Key Benefits of Using Card to the Customer
- Europe Financial Cards & Payments Market Outlook
- Key Issuers of Cards
- Penetration of Cards
- Digital Development
- ATM Expansion
- POS Terminals
- Alternate Payments Solutions
- Europe Cards and Payments Market Regulations, Policies & Industry Standards
- Europe Cards and Payments Market Trends & Developments
- Europe Cards and Payments Market Dynamics
- Growth Drivers
- Challenges
- Europe Cards and Payments Market Hotspots & Opportunities
- Europe Cards and Payments Market Outlook, 2022-2032F
- Market Size & Outlook
- By Transactions Value (USD Million)
- By Total Number of Cards (Thousand Units)
- Number of Transactions (Units)
- Market Segmentation & Outlook
- By Type of Cards
- Debit Cards
- Fleet/Fuel Cards
- ATM Cards
- Prepaid Cards
- Credit Cards
- By Type of Payment Instrument
- Cards
- Mobile Wallets
- Credit Transfers
- Cash
- Debit Cards
- Checks
- By Type of Payments
- B2B
- B2C
- C2C
- C2B
- E-Commerce Payments
- Payments at POS Terminals
- By Transaction Type
- Domestic
- Foreign
- By Application
- Food & Groceries
- Health & Pharmacies
- Travel & Tourism
- Hospitality
- Others (Media & Entertainment, etc.)
- By Institution Type
- Financial
- Non-Financial
- By Region
- Germany
- The UK
- France
- Italy
- Spain
- The Netherlands
- Rest of Europe
- By Company
- Competition Characteristics
- Market Share & Analysis
- By Type of Cards
- Market Size & Outlook
- Germany Cards and Payments Market Outlook, 2022-2032F
- Market Size & Outlook
- By Transactions Value (USD Million)
- By Total Number of Cards (Thousand Units)
- Number of Transactions (Units)
- Market Segmentation & Outlook
- By Card Type- Market Size & Forecast 2022-2032, USD
- By Card Network- Market Size & Forecast 2022-2032, USD
- By End User- Market Size & Forecast 2022-2032, USD
- By Transaction Type- Market Size & Forecast 2022-2032, USD
- Market Size & Outlook
- The UK Cards and Payments Market Outlook, 2022-2032F
- Market Size & Outlook
- By Transactions Value (USD Million)
- By Total Number of Cards (Thousand Units)
- Number of Transactions (Units)
- Market Segmentation & Outlook
- By Card Type- Market Size & Forecast 2022-2032, USD
- By Card Network- Market Size & Forecast 2022-2032, USD
- By End User- Market Size & Forecast 2022-2032, USD
- By Transaction Type- Market Size & Forecast 2022-2032, USD
- Market Size & Outlook
- France Cards and Payments Market Outlook, 2022-2032F
- Market Size & Outlook
- By Transactions Value (USD Million)
- By Total Number of Cards (Thousand Units)
- Number of Transactions (Units)
- Market Segmentation & Outlook
- By Card Type- Market Size & Forecast 2022-2032, USD
- By Card Network- Market Size & Forecast 2022-2032, USD
- By End User- Market Size & Forecast 2022-2032, USD
- By Transaction Type- Market Size & Forecast 2022-2032, USD
- Market Size & Outlook
- Italy Cards and Payments Market Outlook, 2022-2032F
- Market Size & Outlook
- By Transactions Value (USD Million)
- By Total Number of Cards (Thousand Units)
- Number of Transactions (Units)
- Market Segmentation & Outlook
- By Card Type- Market Size & Forecast 2022-2032, USD
- By Card Network- Market Size & Forecast 2022-2032, USD
- By End User- Market Size & Forecast 2022-2032, USD
- By Transaction Type- Market Size & Forecast 2022-2032, USD
- Market Size & Outlook
- Spain Cards and Payments Market Outlook, 2022-2032F
- Market Size & Outlook
- By Transactions Value (USD Million)
- By Total Number of Cards (Thousand Units)
- Number of Transactions (Units)
- Market Segmentation & Outlook
- By Card Type- Market Size & Forecast 2022-2032, USD
- By Card Network- Market Size & Forecast 2022-2032, USD
- By End User- Market Size & Forecast 2022-2032, USD
- By Transaction Type- Market Size & Forecast 2022-2032, USD
- Market Size & Outlook
- The Netherlands Cards and Payments Market Outlook, 2022-2032F
- Market Size & Outlook
- By Transactions Value (USD Million)
- By Total Number of Cards (Thousand Units)
- Number of Transactions (Units)
- Market Segmentation & Outlook
- By Card Type- Market Size & Forecast 2022-2032, USD
- By Card Network- Market Size & Forecast 2022-2032, USD
- By End User- Market Size & Forecast 2022-2032, USD
- By Transaction Type- Market Size & Forecast 2022-2032, USD
- Market Size & Outlook
- Europe Cards and Payments Market Key Strategic Imperatives for Success & Growth
- Competitive Outlook
- Company Profiles
- Visa Inc.
- Business Description
- Product Portfolio
- Strategic Alliances or Partnerships
- Recent Developments
- Financial Details
- Others
- Mastercard Incorporated
- Business Description
- Product Portfolio
- Strategic Alliances or Partnerships
- Recent Developments
- Financial Details
- Others
- Worldline SA
- Business Description
- Product Portfolio
- Strategic Alliances or Partnerships
- Recent Developments
- Financial Details
- Others
- Nexi S.p.A.
- Business Description
- Product Portfolio
- Strategic Alliances or Partnerships
- Recent Developments
- Financial Details
- Others
- Adyen N.V.
- Business Description
- Product Portfolio
- Strategic Alliances or Partnerships
- Recent Developments
- Financial Details
- Others
- PayPal Holdings, Inc.
- Business Description
- Product Portfolio
- Strategic Alliances or Partnerships
- Recent Developments
- Financial Details
- Others
- American Express Company
- Business Description
- Product Portfolio
- Strategic Alliances or Partnerships
- Recent Developments
- Financial Details
- Others
- HSBC Holdings plc
- Business Description
- Product Portfolio
- Strategic Alliances or Partnerships
- Recent Developments
- Financial Details
- Others
- Banco Santander, S.A.
- Business Description
- Product Portfolio
- Strategic Alliances or Partnerships
- Recent Developments
- Financial Details
- Others
- BNP Paribas S.A.
- Business Description
- Product Portfolio
- Strategic Alliances or Partnerships
- Recent Developments
- Financial Details
- Others
- Barclays PLC
- Business Description
- Product Portfolio
- Strategic Alliances or Partnerships
- Recent Developments
- Financial Details
- Others
- Deutsche Bank AG
- Business Description
- Product Portfolio
- Strategic Alliances or Partnerships
- Recent Developments
- Financial Details
- Others
- ING Groep N.V.
- Business Description
- Product Portfolio
- Strategic Alliances or Partnerships
- Recent Developments
- Financial Details
- Others
- CaixaBank, S.A.
- Business Description
- Product Portfolio
- Strategic Alliances or Partnerships
- Recent Developments
- Financial Details
- Others
- Société Générale S.A.
- Business Description
- Product Portfolio
- Strategic Alliances or Partnerships
- Recent Developments
- Financial Details
- Others
- Others
- Visa Inc.
- Company Profiles
- Disclaimer
MarkNtel Advisors follows a robust and iterative research methodology designed to ensure maximum accuracy and minimize deviation in market estimates and forecasts. Our approach combines both bottom-up and top-down techniques to effectively segment and quantify various aspects of the market. A consistent feature across all our research reports is data triangulation, which examines the market from three distinct perspectives to validate findings. Key components of our research process include:
1. Scope & Research Design At the outset, MarkNtel Advisors define the research objectives and formulate pertinent questions. This phase involves determining the type of research—qualitative or quantitative—and designing a methodology that outlines data collection methods, target demographics, and analytical tools. They also establish timelines and budgets to ensure the research aligns with client goals.
2. Sample Selection and Data Collection In this stage, the firm identifies the target audience and determines the appropriate sample size to ensure representativeness. They employ various sampling methods, such as random or stratified sampling, based on the research objectives. Data collection is carried out using tools like surveys, interviews, and observations, ensuring the gathered data is reliable and relevant.
3. Data Analysis and Validation Once data is collected, MarkNtel Advisors undertake a rigorous analysis process. This includes cleaning the data to remove inconsistencies, employing statistical software for quantitative analysis, and thematic analysis for qualitative data. Validation steps are taken to ensure the accuracy and reliability of the findings, minimizing biases and errors.

4. Data Forecast and FinalizationThe final phase involves forecasting future market trends based on the analyzed data. MarkNtel Advisors utilize predictive modeling and time series analysis to anticipate market behaviors. The insights are then compiled into comprehensive reports, featuring visual aids like charts and graphs, and include strategic recommendations to inform client decision-making
FILL THE FORM TO GET THE FREE SAMPLE PAGES
We offer flexible licensing options to cater to varying organizational needs. Choose the pricing pack that best suits your requirements:
Buy Now Inquire Before Buying
 Talk to our Consultant
 Request Customization