
US Ready Meals Market Research Report: Size, Share, Trends & Forecast (2026-2032)
By Product Type (Dried Ready Meals, Shelf Stable Ready Meals, Chilled Ready Meals, Frozen Ready Meals, Others), By Distribution Channel (Supermarkets/Hypermarkets, Convenience Stor ... es, Online Retail, Specialty Stores, Foodservice/HoReCa), By End-User (Household, Commercial), and others Read more
- Food & Beverages
- Feb 2026
- Pages 165
- Report Format: PDF, Excel, PPT
US Ready Meals Market
Projected 11.84% CAGR from 2026 to 2032
Study Period
2026-2032
Market Size (2026)
USD 30.65 Billion
Market Size (2032)
USD 40.21 Billion
Base Year
2025
Projected CAGR
11.84%
Leading Segments
By Product type:
US Ready Meals Market Report Key Takeaways:
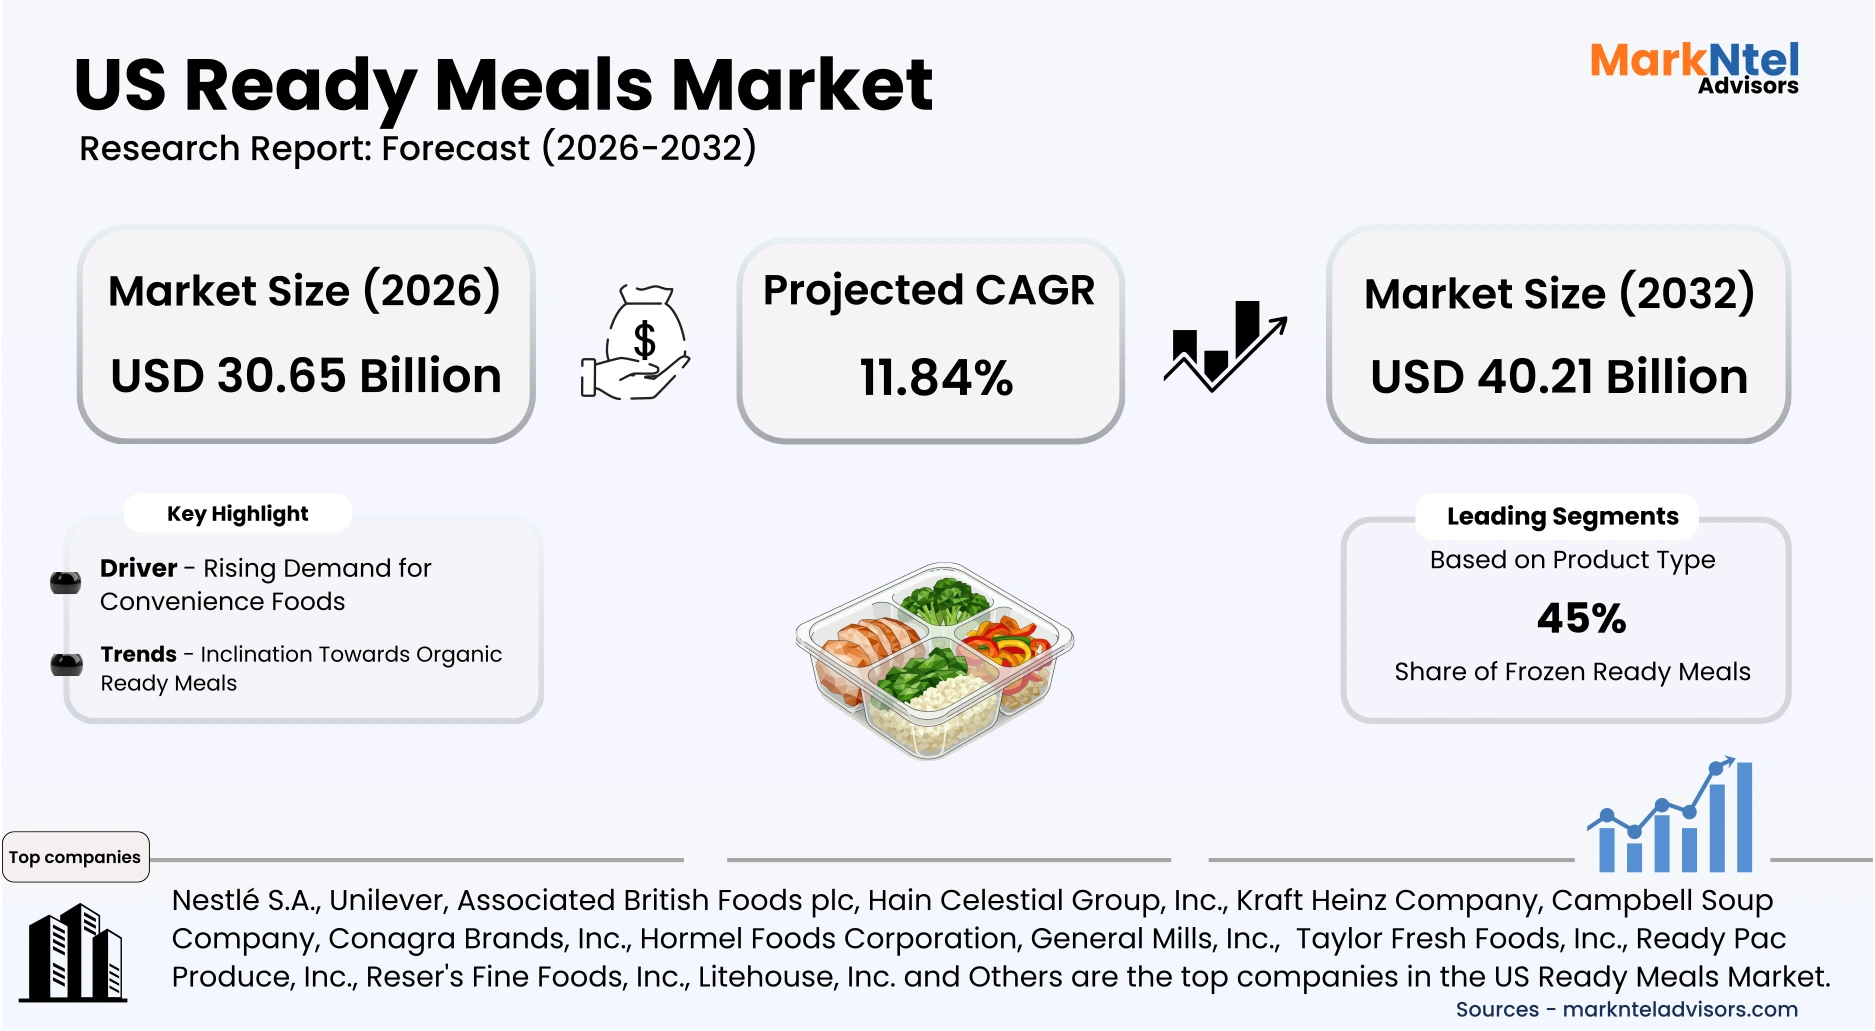
- The US Ready Meals Market size was valued at USD 29.45 billion in 2025 and is projected to grow from USD 30.65 billion in 2026 to USD 40.21 billion by 2032, exhibiting a CAGR of 11.84% during the forecast period.
- South US is the leading region with a significant share of around 37% in 2026.
- By Product type, the Frozen ready meals segment represented a significant share of about 45% in the US Ready Meals Market in 2026.
- By Distribution channel, the supermarkets presented a significant share of about 41% in the US Ready Meals Market in 2026.
- Leading Ready Meals Companies in the US Market are Nestlé S.A., Unilever, Associated British Foods plc, Hain Celestial Group, Inc., Kraft Heinz Company, Campbell Soup Company, Conagra Brands, Inc., Hormel Foods Corporation, General Mills, Inc., The J.M. Smucker Company, Amy's Kitchen, Inc., Barilla Holding S.p.A., Ajinomoto Foods North America, Inc., Taylor Fresh Foods, Inc., Ready Pac Produce, Inc., Reser's Fine Foods, Inc., Litehouse, Inc. and Others.
Market Insights & Analysis: US Ready Meals Market (2026-32):
The US Ready Meals market size was valued at around USD 29.45 billion in 2025 and is projected to grow from USD 30.65 billion in 2026 to USD 40.21 billion by 2032, exhibiting a CAGR of 11.84% during the forecast period, i.e., 2026-32.
The US ready meals market has expanded steadily, supported by resilient consumer spending and structural labor shifts. The U.S. Bureau of Economic Analysis reported that real personal consumption expenditures on food services and accommodations increased in 2025, reflecting sustained demand for convenient meal solutions. Simultaneously, the U.S. Bureau of Labour Statistics recorded elevated labor force participation among dual-income households in 2025, reinforcing time-constrained consumption patterns. These macroeconomic and demographic conditions have strengthened baseline demand for chilled, frozen, and shelf-stable meal formats nationwide.
End-user expansion across institutional and commercial channels has further reinforced market scale. The U.S. Department of Agriculture confirmed continued funding in 2025 for the National School Lunch and related nutrition programs, sustaining procurement of pre-prepared meal components.
Healthcare and senior living facilities reported higher admissions according to 2025 data from the Centres for Medicare & Medicaid Services, increasing reliance on standardised, portion-controlled meals. This institutional demand complements residential consumption, broadening volume stability beyond retail households.
Regulatory modernization and food safety oversight have also supported structured industry growth. In 2026, the U.S. Food and Drug Administration advanced the implementation of traceability requirements under the Food Safety Modernization Act, thereby accelerating digital supply-chain integration. Enhanced compliance frameworks have enc ouraged automation and cold-chain investments, improving production efficiency and distribution reliability.
Such infrastructure improvements reduce spoilage risks and expand national reach for temperature-sensitive ready meal categories.
Industry-led investments continue to reinforce forward-looking prospects.
In 2025, Nestlé USA announced capacity upgrades in prepared foods facilities to strengthen domestic manufacturing resilience . Similarly, Conagra Brands expanded product lines emphasizing portion control and ingredient transparency, responding to evolving dietary preferences. Combined with stable household expenditure trends and institutional procurement programs, these initiatives position the US ready meals market for sustained medium-term expansion.
US Ready Meals Market Scope:
| Category | Segments |
|---|---|
| By Product Type | (Dried Ready Meals, Shelf Stable Ready Meals, Chilled Ready Meals, Frozen Ready Meals, Others), |
| By Distribution Channel | (Supermarkets/Hypermarkets, Convenience Stores, Online Retail, Specialty Stores, Foodservice/HoReCa), |
| By End-User | (Household, Commercial), |
US Ready Meals Market Driver:
Rising Demand for Convenience Foods
A central structural driver of the US ready meals market is the sustained rise in demand for convenience-oriented food products. In 2025, the U.S. Bureau of Labour Statistics reported that employed persons spent significantly less time on food preparation compared with prior decades, reflecting long-term shifts in household routines. Time-use data indicate that working individuals allocate more hours to employment and commuting, reducing capacity for home cooking. This measurable decline in meal preparation time directly increases reliance on ready-to-heat and ready-to-eat food formats.
Consumer expenditure patterns further validate this demand shift. The U.S. Bureau of Economic Analysis reported continued growth in spending on food-at-home categories in 2025, even amid price normalization trends. Households increasingly allocate food budgets toward value-added, processed meal solutions rather than raw ingredients. Such expenditure reallocation reflects structural convenience prioritization rather than short-term behavioral fluctuation. Retail infrastructure and product availability reinforce this driver nationwide.
By 2025, retailers improved their digital ordering platforms and physical store fulfilment processes, boosting omnichannel distribution for grocery and mass merchandise outlets. Better cold-chain logistics and expanded omnichannel grocery access increase the availability of frozen and refrigerated meals in urban and suburban areas. As a result, the growing consumer demand for convenience foods significantly boosts ready meal sales and supports long-term market expansion.
US Ready Meals Market Trend:
Inclination Towards Organic Ready Meals
The organic ready meals trend has emerged from broader shifts in consumer preferences toward health, sustainability, and food quality. Recent data show that the organic food and drink market in the UK grew substantially in 2025, with overall organic sales rising nearly 8 % year‑ on‑year as consumers prioritized perceived health benefits and trust in food sources amid cost-of-living pressures. These drivers have propelled demand for convenience foods that align with clean eating values, including organic prepared meals free from synthetic pesticides or additives under established standards such as USDA organic certification or equivalent national programs.
Structural changes are visible across sourcing, supply, and certification systems. Stricter regulatory frameworks like the USDA Strengthening Organic Enforcement rule, effective since 2024, require deeper traceability and certification across supply chains, prompting manufacturers to invest in verified sourcing and ingredient transparency . Retailers, from mainstream supermarkets to organic‑focused outlets, are expanding shelf space for certified organic ready meals, reshaping distribution and production practices to meet this verified, clean‑label demand.
The trend is expected to persist as regulatory tightening reinforces consumer confidence and long‑term health concerns continue to shape food choices. Continued government‑mandated standards and traceability requirements make organic credentials a competitive necessity, anchoring market evolution toward nutritious, convenient meals that reflect enduring consumer priorities.
US Ready Meals Market Opportunity:
Strategic Investment Powering Ready Meal Innovation
The U.S. ready meals sector is poised to benefit from expanding public investment and grant programs aimed at strengthening domestic food systems and organic product markets. For example, the USDA’s Organic Market Development Grant (OMDG) program allocates funding ranging up to USD 3 million per project and about USD 85 million overall to build processing, aggregation, and distribution capacity for organic products , expanding market paths for producers. Such funding supports facilities and initiatives that can directly benefit manufacturers of organic ready meals by improving ingredient supply chains and processing infrastructure.
This investment translates into tangible demand creation by reducing capital constraints for new product lines and expanding market access. Federal grants and technical assistance for urban agriculture and innovative production totaling USD 14.4 million in 2025, encourage localised food production and distribution innovations that can integrate into the ready meals ecosystem. By facilitating partnerships between producers, processors, and retailers, these programs strengthen supply chains and create demand channels for ready meal products, emphasizing freshness and traceability.
Future investment also lowers barriers for new and smaller players. Targeted funding mechanisms enable early-stage companies to invest in processing capacity, marketing, and distribution without needing large upfront capital or extensive legacy networks. Smaller firms can access competitive grants for equipment, market development, and pilot initiatives that would otherwise be cost-prohibitive, allowing them to innovate and compete with larger incumbents.
US Ready Meals Market Challenge:
High Costs of Manufacturing & Packaging
A significant challenge in the U.S. ready-to-eat meals market is rising packaging and production costs, which directly impact product pricing. Ready meals often require multi-layered packaging, including plastic trays, films, and insulated containers, to ensure safety, freshness, and extended shelf life. Sustainable or eco-friendly alternatives, such as recyclable or compostable materials , are more expensive, increasing unit production costs.
These higher costs affect profit margins and market competitiveness. Manufacturers must balance affordability with quality and regulatory compliance, particularly in frozen or chilled formats. Sustainable and advanced packaging materials typically cost more than conventional alternatives, resulting in higher production expenses that manufacturers may need to pass on to consumers, as supported by the EPA’s packaging cost data.
Smaller and new entrants are particularly constrained by these pricing pressures . Unlike larger incumbents, they have limited bargaining power with packaging suppliers and cannot easily absorb increased production costs. High packaging and material costs reduce flexibility in product innovation, marketing, and distribution, making it more difficult to compete, expand, or scale in a market where both price and product quality influence consumer choices.
US Ready Meals Market (2026-2032) Segmentation Analysis:
The US Ready Meals Market study of MarkNtel Advisors evaluates & highlights the major trends and influencing factors in each segment. It includes predictions for the period 2026–32 at the country level. Based on the analysis, the market has been further classified as follows:
Based on Product type:
- Dried Ready Meals
- Shelf Stable Ready Meals
- Chilled Ready Meals
- Frozen Ready Meals
- Others
Frozen Ready Meals hold clear dominance in the U.S. ready meals market, with a market share of 45% supported by consistent consumer demand for convenience, combined with extended shelf life and high nutritional retention. Kraft Heinz announced a USD 3 billion investment to upgrade its U.S. manufacturing facilities, supporting efficiency gains and faster product innovation across its food portfolio, which includes ready meal products like frozen Kraft Mac & Cheese and Smart Ones. Policy influences, including USDA cold chain incentives and FDA standards facilitating frozen product distribution, have reduced logistical barriers, enabling broader geographic penetration, especially into suburban and rural grocery channels. End‑user demand characteristics show that time-pressed consumers, including working adults and families, prefer frozen options that balance convenience, portability, and perceived nutritional value, reinforcing sustained growth.
Frozen ready meals also benefit from economies of scale in production and distribution that competitors in chilled or shelf-stable categories find difficult to replicate, lowering unit costs and retail prices. Retailers in supermarkets and big‑box channels prioritize frozen ready meals because they drive frequent repeat purchases and maintain stable margins. Investments in freezer infrastructure by retail chains and expanded SKUs catering to dietary preferences (gluten-free, high‑protein, plant-based further entrench this segment’s appeal. Cumulatively, these structural, policy, and consumer drivers explain why frozen ready meals continue to outperform other product sub-segments.
Based on Distribution Channel:
- Supermarkets/Hypermarkets
- Convenience Stores
- Online Retail
- Specialty Stores
- Foodservice/HoReCa
Supermarkets and hypermarkets dominate the U.S. ready-to-eat meals market with a market share of 41% due to extensive store networks and broad product assortments. Major grocery retailers such as Walmart, Kroger, and Target dedicate large freezer and chilled sections to ready meals, carrying multiple SKUs across leading brands. These channels align with consumer preferences for one-stop shopping, where households purchase ready meals alongside groceries, household essentials, and fresh produce. Policy support, including USDA guidelines on food access and SNAP benefits redeemable in supermarkets, further strengthens supermarket dominance.
These stores offer a wide selection of chilled, frozen, and shelf-stable RTE meals, allowing consumers to purchase multiple brands and types in a single trip. Advanced supply chain and cold storage systems in supermarkets ensure that prepared foods remain fresh, while promotional strategies and private-label options attract value-conscious shoppers. Additionally, consumers trust the quality and safety standards maintained by major grocery chains, further reinforcing their dominance in the RTE meals market.
US Ready Meals Market (2026-32) Regional Analysis:
The Southern United States leads the U.S. ready-to-eat meals market, capturing approximately 37% of national consumption, driven by a combination of population density, income levels, and retail penetration. According to the U.S. Census Bureau 2025 population estimates, the South is the most populous U.S. region, providing a substantial consumer base for ready-to-eat meals and hosting several of the fastest-growing metropolitan areas, including Houston, Dallas–Fort Worth, Atlanta, Miami, and Charlotte. High urban concentration and rising household disposable income translate directly into demand for convenience meals and packaged, ready-to-eat products.
Urban lifestyles, dual-income households, and busy professional schedules in Southern cities create strong adoption of ready-to-eat meals. Public health nutrition campaigns and digital food education platforms, such as USDA MyPlate initiatives and SNAP-Ed nutrition education, support informed consumer choices and higher product uptake. The growing interest in healthier, portion-controlled, and ethnically diverse meal options further drives RTE adoption, particularly in urban and suburban areas. State-level incentives, such as business-friendly tax policies in Texas and Florida, encourage food manufacturers and distributors to expand operations. Federal regulations on food safety, labeling, and cold-chain standards enhance consumer trust and consistent product quality across the South, enabling higher adoption of RTE meals.
Gain a Competitive Edge with Our US Ready Meals Market Report:
- The US Ready Meals Market Report by MarkNtel Advisors provides a detailed & thorough analysis of market size & share, growth rate, competitive landscape, and key players. This comprehensive analysis helps businesses gain a holistic understanding of the market dynamics & make informed decisions.
- This report also highlights current market trends & future projections, allowing businesses to identify emerging opportunities & potential challenges. By understanding market forecasts, companies can align their strategies & stay ahead of the competition.
- The US Ready Meals Market Report aids in assessing & mitigating risks associated with entering or operating in the market. By understanding market dynamics, regulatory frameworks, and potential challenges, businesses can develop strategies to minimize risks & optimize their operations.
*Reports Delivery Format - Market research studies from MarkNtel Advisors are offered in PDF, Excel and PowerPoint formats. Within 24 hours of the payment being successfully received, the report will be sent to your email address.
Frequently Asked Questions
- Market Segmentation
- Introduction
- Product Definition
- Research Process
- Assumptions
- Executive Summary
- US Ready Meals Market Policies, Regulations, and Product Standards
- US Ready Meals Market Trends & Developments
- US Ready Meals Market Dynamics
- Growth Factors
- Challenges
- US Ready Meals Market Hotspot & Opportunities
- US Ready Meals Market Outlook, 2022-2032F
- Market Size & Outlook
- By Revenues (USD Million)
- Market Share & Outlook
- By Product Type- Market Size & Forecast 2022-2032, USD Million
- Dried Ready Meals
- Shelf Stable Ready Meals
- Chilled Ready Meals
- Frozen Ready Meals
- Others
- By Distribution Channel- Market Size & Forecast 2022-2032, USD Million
- Supermarkets/Hypermarkets
- Convenience Stores
- Online Retail
- Specialty Stores
- Foodservice/HoReCa
- By End-User- Market Size & Forecast 2022-2032, USD Million
- Household
- Commercial
- By Region- Market Size & Forecast 2022-2032, USD Million
- Northeast
- Midwest
- South
- West
- By Company
- Competition Characteristics
- Market Share & Analysis
- By Product Type- Market Size & Forecast 2022-2032, USD Million
- Market Size & Outlook
- US Dried Ready Meals Market Outlook, 2022-2032
- Market Size & Outlook
- By Revenues (USD Million)
- Market Share & Outlook
- By Distribution Channel- Market Size & Forecast 2022-2032, USD Million
- By End-User- Market Size & Forecast 2022-2032, USD Million
- By Region- Market Size & Forecast 2022-2032, USD Million
- Market Size & Outlook
- US Shelf Stable Ready Meals Market Outlook, 2022-2032
- Market Size & Outlook
- By Revenues (USD Million)
- Market Share & Outlook
- By Distribution Channel- Market Size & Forecast 2022-2032, USD Million
- By End-User- Market Size & Forecast 2022-2032, USD Million
- By Region- Market Size & Forecast 2022-2032, USD Million
- Market Size & Outlook
- US Chilled Ready Meals Market Outlook, 2022-2032
- Market Size & Outlook
- By Revenues (USD Million)
- Market Share & Outlook
- By Distribution Channel- Market Size & Forecast 2022-2032, USD Million
- By End-User- Market Size & Forecast 2022-2032, USD Million
- By Region- Market Size & Forecast 2022-2032, USD Million
- Market Size & Outlook
- US Frozen Ready Meals Market Outlook, 2022-2032
- Market Size & Outlook
- By Revenues (USD Million)
- Market Share & Outlook
- By Distribution Channel- Market Size & Forecast 2022-2032, USD Million
- By End-User- Market Size & Forecast 2022-2032, USD Million
- By Region- Market Size & Forecast 2022-2032, USD Million
- Market Size & Outlook
- US Ready Meals Market Key Strategic Imperatives for Success & Growth
- Competitive Outlook
- Company Profiles
- Nestlé S.A.
- Business Description
- Product Portfolio
- Collaborations & Alliances
- Recent Developments
- Financial Details
- Others
- Unilever
- Business Description
- Product Portfolio
- Collaborations & Alliances
- Recent Developments
- Financial Details
- Others
- Associated British Foods plc
- Business Description
- Product Portfolio
- Collaborations & Alliances
- Recent Developments
- Financial Details
- Others
- Hain Celestial Group, Inc.
- Business Description
- Product Portfolio
- Collaborations & Alliances
- Recent Developments
- Financial Details
- Others
- Kraft Heinz Company
- Business Description
- Product Portfolio
- Collaborations & Alliances
- Recent Developments
- Financial Details
- Others
- Campbell Soup Company
- Business Description
- Product Portfolio
- Collaborations & Alliances
- Recent Developments
- Financial Details
- Others
- Conagra Brands, Inc.
- Business Description
- Product Portfolio
- Collaborations & Alliances
- Recent Developments
- Financial Details
- Others
- Hormel Foods Corporation
- Business Description
- Product Portfolio
- Collaborations & Alliances
- Recent Developments
- Financial Details
- Others
- General Mills, Inc.
- Business Description
- Product Portfolio
- Collaborations & Alliances
- Recent Developments
- Financial Details
- Others
- The J.M. Smucker Company
- Business Description
- Product Portfolio
- Collaborations & Alliances
- Recent Developments
- Financial Details
- Others
- Amy's Kitchen, Inc.
- Business Description
- Product Portfolio
- Collaborations & Alliances
- Recent Developments
- Financial Details
- Others
- Barilla Holding S.p.A.
- Business Description
- Product Portfolio
- Collaborations & Alliances
- Recent Developments
- Financial Details
- Others
- Ajinomoto Foods North America, Inc.
- Business Description
- Product Portfolio
- Collaborations & Alliances
- Recent Developments
- Financial Details
- Others
- Taylor Fresh Foods, Inc.
- Business Description
- Product Portfolio
- Collaborations & Alliances
- Recent Developments
- Financial Details
- Others
- Ready Pac Produce, Inc.
- Business Description
- Product Portfolio
- Collaborations & Alliances
- Recent Developments
- Financial Details
- Others
- Reser's Fine Foods, Inc.
- Business Description
- Product Portfolio
- Collaborations & Alliances
- Recent Developments
- Financial Details
- Others
- Litehouse, Inc.
- Business Description
- Product Portfolio
- Collaborations & Alliances
- Recent Developments
- Financial Details
- Others
- Nestlé S.A.
- Company Profiles
- Disclaimer
MarkNtel Advisors follows a robust and iterative research methodology designed to ensure maximum accuracy and minimize deviation in market estimates and forecasts. Our approach combines both bottom-up and top-down techniques to effectively segment and quantify various aspects of the market. A consistent feature across all our research reports is data triangulation, which examines the market from three distinct perspectives to validate findings. Key components of our research process include:
1. Scope & Research Design At the outset, MarkNtel Advisors define the research objectives and formulate pertinent questions. This phase involves determining the type of research—qualitative or quantitative—and designing a methodology that outlines data collection methods, target demographics, and analytical tools. They also establish timelines and budgets to ensure the research aligns with client goals.
2. Sample Selection and Data Collection In this stage, the firm identifies the target audience and determines the appropriate sample size to ensure representativeness. They employ various sampling methods, such as random or stratified sampling, based on the research objectives. Data collection is carried out using tools like surveys, interviews, and observations, ensuring the gathered data is reliable and relevant.
3. Data Analysis and Validation Once data is collected, MarkNtel Advisors undertake a rigorous analysis process. This includes cleaning the data to remove inconsistencies, employing statistical software for quantitative analysis, and thematic analysis for qualitative data. Validation steps are taken to ensure the accuracy and reliability of the findings, minimizing biases and errors.

4. Data Forecast and FinalizationThe final phase involves forecasting future market trends based on the analyzed data. MarkNtel Advisors utilize predictive modeling and time series analysis to anticipate market behaviors. The insights are then compiled into comprehensive reports, featuring visual aids like charts and graphs, and include strategic recommendations to inform client decision-making
We offer flexible licensing options to cater to varying organizational needs. Choose the pricing pack that best suits your requirements:
Buy Now

