
Global Mass Spectrometry Market Research Report: Forecast (2025-2030)
Mass Spectrometry Market Size and Share Report - By Product Type (Instruments [Hybrid {Tandem Quadrupole, Quadrupole Time-of-Flight (Q-TOF), Triple Quadrupole, FTMS}, Single {Singl...e Quadrupole, Time-of-Flight (TOF), Ion Trap}, Others], Software & Services), By Application (Omics Research, Drug Discovery, Environmental Testing, Food Testing, Pharma/Biopharma Manufacturing, Clinical Diagnostics, Others), By End User (Pharmaceutical & Biotechnology Companies, Research Institutions & Academic Labs, Hospitals & Diagnostic Centers, Environmental Testing Laboratories, Food Testing Laboratories) and Others Read more
- Healthcare
- Aug 2025
- Pages 180
- Report Format: PDF, Excel, PPT
Global Mass Spectrometry Market
Projected 7.04% CAGR from 2025 to 2030
Study Period
2025-2030
Market Size (2024)
USD 6.9 Billion
Market Size (2030)
USD 10.38 Billion
Largest Region
North America
Projected CAGR
7.04%
Leading Segments
By Product Type: Instruments
Market Definition
Mass spectrometry is the technique used in powerful clinical tools for diagnosis that analyze biological samples, including blood, urine, saliva, plasma, etc., to precisely identify and quantify the information present in these samples to determine the presence of particular diseases.
Market Insights & Analysis: Global Mass Spectrometry Market (2025-30):
The Global Mass Spectrometry Market size was valued at around USD 6.9 billion in 2024 and is expected to reach USD 10.38 billion by 2030. Along with this, the market is estimated to grow at a CAGR of around 7.04% during the forecast period, i.e., 2025-30. The Global Mass Spectrometry Market is significantly growing due to several growth factors, including the rising public and environmental health concerns regarding sample analyses and food testing, the rising pharmaceutical industry, and the expansion of mass spectrometry infrastructure by heavy investments through the public and government sectors, the integration of advanced technologies such as artificial intelligence in the mass spectrometers, etc. One of the most prominent growth factors is the rising adoption of biologics manufacturing by the pharmaceutical and biotechnology companies, as these are highly efficient solutions for chronic diseases like diabetes, cancer, and autoimmune diseases. Biologics have complex structures, which are increasing the market demand.
Additionally, the active support from various governments of different countries, like the United States, Canada, the United Kingdom, Germany, Belgium, Australia, etc., through heavy investments in the infrastructure related to the mass spectrometers, is increasing the potential growth of this market. Also, the market is significantly growing due to the replacement of outdated systems by the latest medical devices, including mass spectrometers, which is increasing the market growth.
Moreover, the market is actively transforming due to the incorporation of artificial intelligence in mass spectrometry systems has increased the system's efficiency and reduced delays in outcomes. However, the high operational and maintenance costs of mass spectrometers are putting a financial burden on effectively utilizing these machines, especially in rural hospitals and laboratories. In addition, many regions, including Southeast Asia, Africa, Latin America, etc., are facing a shortage of skilled professionals to operate these advanced machines, thus hindering market growth & expansion.
Global Mass Spectrometry Market Scope:
| Category | Segments |
|---|---|
| By Product Type |
Instruments [Hybrid {Tandem Quadrupole, Quadrupole Time-of-Flight (Q-TOF), Triple Quadrupole, FTMS}, Single {Single Quadrupole, Time-of-Flight (TOF), Ion Trap}, Others], Software & Services) |
| By Application | Omics Research, Drug Discovery, Environmental Testing, Food Testing, Pharma/Biopharma Manufacturing, Clinical Diagnostics, Others |
| By End User | Pharmaceutical & Biotechnology Companies, Research Institutions & Academic Labs, Hospitals & Diagnostic Centers, Environmental Testing Laboratories, Food Testing Laboratories |
Global Mass Spectrometry Market Driver:
Rising Use in Environmental & Food Testing – The market growth is driven by the rising concerns of environmental and public health, and by regular monitoring of these samples. These analyses are increasing the demand for the mass spectrometry market globally. This is because the mass spectrometry techniques detect harmful substances like heavy metals, toxins, trace contaminants, etc., in the food samples to ensure food safety for consumption. Additionally, the technique is useful for testing environmental samples like air, water, and soil samples for contaminants such as pollutants, harmful chemicals, etc., which are deteriorating environmental health. These factors are increasing the global production capacity for manufacturing mass spectrometers. For instance, approximately 50,000 mass spectrometers (MS) units are being produced worldwide annually, showing their rising demand.

Global Mass Spectrometry Market Opportunity:
Growing Investments in Mass Spectrometry Infrastructure – The heavy investments in research and development studies worldwide, for the upgradation of the mass spectrometers and related infrastructure, offer lucrative growth opportunities for this market. For instance, in 2024, the UK Research and Innovation (UKRI) allocated about USD62 million for the Critical Mass UK Initiative, which aims to build a central hub and spoke network of labs having mass spectrometry across the country.
Additionally, the European Union’s Horizon Program (2025) has funded about USD3 million for the MASSTRUCT Project to set up a new mass spectrometry center in Greece for R&D. Also, in Germany (2025), the Technical University of Munich planned to upgrade its labs for better research on proteins by spending USD447,233 to buy new LC-MS machines. Moreover, other countries such as the United Kingdom, Canada, Australia, India, Belgium, etc. are also heavily investing in improving their mass spectrometry infrastructure. These heavy investments are increasing the demand for mass spectrometry and contributing to the potential market growth & expansion.
Global Mass Spectrometry Market Challenge:
High Cost & Shortage of Skilled Workforce – The market is facing a high equipment cost challenge along with the shortage of skilled workforce in many regions, like Latin America, some parts of Eastern Europe, Southeast Asia, and Africa. This is due to the advanced and complex instrumentation of mass spectrometers, which are highly expensive and demand specialized training. For instance, the basic MS can cost about USD150,000, while the latest models with enhanced features, such as FTMS, hybrid LC-MS, etc., can exceed USD1 million.
Additionally, the maintenance cost is also high, as these systems require regular software upgrades, frequent repairs, and appropriate lab spaces, which further increase the cumulative costs of mass spectrometers. These factors are limiting the widespread use of mass spectrometers in many sectors, like food testing, clinical diagnostics, environmental analysis, etc., thus hindering the market growth & expansion.
Global Mass Spectrometry Market Trend:
Integration of Artificial Intelligence with MS Devices – The incorporation of artificial intelligence in mass spectrometers is gaining traction in the market, as this integration increases the efficiency of medical devices, including mass spectrometers. This integration allows the machines to run faster, automatically, and provides more accurate results as compared to traditional mass spectrometers, which require time-consuming manual interpretation and analysis.
Several companies, such as Agilent, Thermo Fisher, Bruker, Waters, etc., have proactively started manufacturing the AI-enabled mass spectrometers on a commercial scale to improve diagnosis. For instance, the company called Thermo Fisher Scientific (2025) has launched an Orbital Astral Zoom MS that uses AI software via the Ardia platform, which provides 50% high multiplexing and high scanning speeds as compared to traditional MS. Similarly, Agilent Technologies (2025) has unveiled the InfinityLab Pro iQ series, including AI-powered compact Liquid Chromatography-Mass Spectrometry (LC-MS), which can easily detect faults and recommend corrective actions autonomously. These kinds of product launches are positively transforming this market.
Global Mass Spectrometry Market (2025-30): Segmentation Analysis
The Global Mass Spectrometry Market study of MarkNtel Advisors evaluates & highlights the major trends and influencing factors in each segment. It includes predictions for the period 2025–2030 at the global level. Based on the analysis, the market has been further classified as:
Based on Product Type:
- Instruments
- Hybrid
- Tandem Quadrupole
- Quadrupole Time-of-Flight (Q-TOF)
- Triple Quadrupole
- FTMS
- Single
- Single Quadrupole
- Time-of-Flight (TOF)
- Ion Trap
- Others
- Hybrid
- Software & Services
Within the product type segment, the instruments segment holds the largest market share of about 70%. This segment is characterized by a high demand for physical machines, resulting in increased revenue generation compared to software and services. Notably, hybrid mass spectrometers play a vital role, as they integrate two types of mass analyzers to improve sensitivity, accuracy, and efficiency. These advanced systems are particularly valuable for rapid, high-resolution testing and for analyzing complex data sets.
Within the instrument segment, triple quadrupole mass spectrometers are especially influential, contributing to 55% of the total production of mass spectrometry instruments worldwide. Their annual production capacity is approximately 6,000 units, underscoring their prominence in the market. The significant capital investment required for these instruments, typically ranging from USD 100,000 to USD 1 million, further drives market growth. Moreover, while software is essential for data management, it typically accompanies the instruments and cannot function independently without the hardware. This dependency reinforces the instruments' role as the cornerstone of the mass spectrometry market, ensuring their continued dominance in the global landscape.
Based on End-User:
- Pharmaceutical & Biotechnology Companies
- Research Institutions & Academic Labs
- Hospitals & Diagnostic Centers
- Environmental Testing Laboratories
- Food Testing Laboratories
- Others
Among these, the pharmaceutical & Biotechnology Companies are leading the market and accounting for more than 40% of the market share. This is the leading segment due to a high demand for drug testing from these companies, which highly require medical tools like Mass Spectrometers in bulk quantities. On average, about 20,000 pharmaceutical companies are present globally, which requires a large volume of mass spectrometers for structural analysis of the drugs produced there, thus contributing to the market growth.
Additionally, the adoption of biologics and biosimilars, being manufactured in pharmaceutical and biotechnology companies, is increasing the demand for mass spectrometry, due to their structural complexity. Unlike small drug molecules, these are not properly identified by simple chemistry techniques, thus raising the demand for mass spectrometry.
Global Mass Spectrometry Market (2025-30): Regional Projections
Geographically, the Global Mass Spectrometry Market expands across:
- North America
- South America
- Europe
- The Middle East & Africa
- Asia-Pacific
North America is dominating the market and holds about 38% share of the entire market value. The dominance is due to the presence of a strong pharmaceutical base and biotechnology companies in the region, which are actively utilizing a large volume of medical devices like mass spectrometers. For instance, the United States has the top pharmaceutical companies such as Pfizer, Johnson & Johnson, and Merck, which are extensively using MS for drug discovery and various testing. Similarly, Canada has Apotex Inc., Knight Therapeutics Inc., etc. are significantly contributing to the market growth & expansion.
Additionally, the growing government & private funding in the R&D witnessed by North American countries like the US, Mexico, and Canada is showing the dominance of this region in the Global Mass Spectrometry Market. For instance, the National Institutes of Health (NIH) is providing high funds, ranging from USD60,000 to USD2 million, to buy high-resolution MS systems for biological research. Likewise, the Canada Foundation Innovation (CFI) allocates adequate funds worth more than USD300,000 to help universities and research laboratories buy MS systems. These factors express the leadership of North America in the regional segment of this market.
Top Manufacturer of Mass Spectrometry leading the Global Market: Players, Analysis & Future Outlook
The leading manufacturers of mass spectrometry in the market, including Thermo Fisher Scientific Inc., Agilent Technologies Inc., Waters Corporation, Danaher Corporation, Bruker Corporation, Shimadzu Corporation, PerkinElmer Inc., JEOL Ltd., LECO Corporation, Advion Inc., Analytik Jena AG, Hiden Analytical, Rigaku Corporation, F. Hoffmann-La Roche Ltd, Jasco Corporation, and others, are looking forward to increasing their market size & share.
Global Mass Spectrometry Industry Recent Development:
- 2025: Agilent Technologies Inc. launched the InfinityLab Pro iQ Series (Pro iQ and Pro iQ Plus), which are new LC–MS detectors designed for faster, smarter, and more automated lab work. They also updated the 8850 GC system to work with mass spectrometry. These tools are smaller, quicker, and eco-friendlier, and are certified by My Green Lab for sustainability.
- 2024: Waters Corporation launched the Xevo MRT multi‑reflecting TOF system, delivering 100,000 fwhm resolution at 100 Hz MS/MS speed and < 500 ppb mass accuracy. Sustainability is emphasized via lighter, recyclable design materials and ACT ecolabel certification of multiple products.
Gain a Competitive Edge with Our Global Mass Spectrometry Market Report
- Global Mass Spectrometry Market Report by MarkNtel Advisors provides a detailed & thorough analysis of market size & share, growth rate, competitive landscape, and key players. This comprehensive analysis helps businesses gain a holistic understanding of the market dynamics & make informed decisions.
- This report also highlights current market trends & future projections, allowing businesses to identify emerging opportunities & potential challenges. By understanding market forecasts, companies can align their strategies & stay ahead of the competition.
- Global Mass Spectrometry Market Report aids in assessing & mitigating risks associated with entering or operating in the market. By understanding market dynamics, regulatory frameworks, and potential challenges, businesses can develop strategies to minimize risks & optimize their operations.
*Reports Delivery Format - Market research studies from MarkNtel Advisors are offered in PDF, Excel and PowerPoint formats. Within 24 hours of the payment being successfully received, the report will be sent to your email address.
Frequently Asked Questions
- Market Segmentation
- Introduction
- Product Definition
- Research Process
- Assumptions
- Executive Summary
- Global Mass Spectrometry Market Regulations, Policies & Standards
- Global Mass Spectrometry Market Trends & Developments
- Global Mass Spectrometry Market Dynamics
- Growth Drivers
- Challenges
- Global Mass Spectrometry Market Hotspots & Opportunities
- Global Mass Spectrometry Market Value Chain Analysis
- Global Mass Spectrometry Market Outlook, 2020-2030F
- Market Size & Analysis
- By Revenues (USD Million)
- Market Share & Analysis
- By Product Type
- Instruments– Market Size & Forecast 2020-2030, USD Million
- Hybrid– Market Size & Forecast 2020-2030, USD Million
- Tandem Quadrupole– Market Size & Forecast 2020-2030, USD Million
- Quadrupole Time-of-Flight (Q-TOF) – Market Size & Forecast 2020-2030, USD Million
- Triple Quadrupole– Market Size & Forecast 2020-2030, USD Million
- FTMS– Market Size & Forecast 2020-2030, USD Million
- Single– Market Size & Forecast 2020-2030, USD Million
- Single Quadrupole– Market Size & Forecast 2020-2030, USD Million
- Time-of-Flight (TOF) – Market Size & Forecast 2020-2030, USD Million
- Ion Trap– Market Size & Forecast 2020-2030, USD Million
- Others– Market Size & Forecast 2020-2030, USD Million
- Hybrid– Market Size & Forecast 2020-2030, USD Million
- Software & Services– Market Size & Forecast 2020-2030, USD Million
- Instruments– Market Size & Forecast 2020-2030, USD Million
- By Application
- Omics Research– Market Size & Forecast 2020-2030, USD Million
- Drug Discovery– Market Size & Forecast 2020-2030, USD Million
- Environmental Testing– Market Size & Forecast 2020-2030, USD Million
- Food Testing– Market Size & Forecast 2020-2030, USD Million
- Pharma/Biopharma Manufacturing– Market Size & Forecast 2020-2030, USD Million
- Clinical Diagnostics– Market Size & Forecast 2020-2030, USD Million
- Others– Market Size & Forecast 2020-2030, USD Million
- By End User
- Pharmaceutical & Biotechnology Companies– Market Size & Forecast 2020-2030, USD Million
- Research Institutions & Academic Labs– Market Size & Forecast 2020-2030, USD Million
- Hospitals & Diagnostic Centers– Market Size & Forecast 2020-2030, USD Million
- Environmental Testing Laboratories– Market Size & Forecast 2020-2030, USD Million
- Food Testing Laboratories– Market Size & Forecast 2020-2030, USD Million
- Others– Market Size & Forecast 2020-2030, USD Million
- By Region
- North America
- South America
- Europe
- Middle East & Africa
- Asia-Pacific
- By Product Type
- Market Size & Analysis
- North America Mass Spectrometry Market Outlook, 2020-2030F
- Market Size & Analysis
- By Revenues (USD Million)
- Market Share & Analysis
- By Product Type – Market Size & Forecast 2020–2030, USD Million
- By Application– Market Size & Forecast 2020–2030, USD Million
- By End User – Market Size & Forecast 2020–2030, USD Million
- By Country
- The US
- Canada
- Mexico
- The US Mass Spectrometry Market Outlook, 2020-2030F
- Market Size & Analysis
- By Revenues (USD Million)
- Market Share & Analysis
- By Product Type – Market Size & Forecast 2020–2030, USD Million
- By Application – Market Size & Forecast 2020–2030, USD Million
- By End-User – Market Size & Forecast 2020–2030, USD Million
- Market Size & Analysis
- Canada Mass Spectrometry Market Outlook, 2020-2030F
- Market Size & Analysis
- By Revenues (USD Million)
- Market Share & Analysis
- By Product Type – Market Size & Forecast 2020–2030, USD Million
- By Application – Market Size & Forecast 2020–2030, USD Million
- By End-User – Market Size & Forecast 2020–2030, USD Million
- Market Size & Analysis
- Mexico Mass Spectrometry Market Outlook, 2020-2030F
- Market Size & Analysis
- By Revenues (USD Million)
- Market Share & Analysis
- By Product Type – Market Size & Forecast 2020–2030, USD Million
- By Application – Market Size & Forecast 2020–2030, USD Million
- By End-User – Market Size & Forecast 2020–2030, USD Million
- Market Size & Analysis
- Market Size & Analysis
- South America Mass Spectrometry Market Outlook, 2020-2030F
- Market Size & Analysis
- By Revenues (USD Million)
- Market Share & Analysis
- By Product Type – Market Size & Forecast 2020–2030, USD Million
- By Application – Market Size & Forecast 2020–2030, USD Million
- By End-User – Market Size & Forecast 2020–2030, USD Million
- By Country
- Brazil
- Argentina
- Rest of South America
- Brazil Mass Spectrometry Market Outlook, 2020-2030F
- Market Size & Analysis
- By Revenues (USD Million)
- Market Share & Analysis
- By Product Type – Market Size & Forecast 2020–2030, USD Million
- By Application – Market Size & Forecast 2020–2030, USD Million
- By End-User – Market Size & Forecast 2020–2030, USD Million
- Market Size & Analysis
- Argentina Mass Spectrometry Market Outlook, 2020-2030F
- Market Size & Analysis
- By Revenues (USD Million)
- Market Share & Analysis
- By Product Type – Market Size & Forecast 2020–2030, USD Million
- By Application – Market Size & Forecast 2020–2030, USD Million
- By End-User – Market Size & Forecast 2020–2030, USD Million
- Market Size & Analysis
- Market Size & Analysis
- Europe Mass Spectrometry Market Outlook, 2020-2030F
- Market Size & Analysis
- By Revenues (USD Million)
- Market Share & Analysis
- By Product Type – Market Size & Forecast 2020–2030, USD Million
- By Application – Market Size & Forecast 2020–2030, USD Million
- By End-User – Market Size & Forecast 2020–2030, USD Million
- By Country
- Germany
- United Kingdom
- France
- Italy
- Spain
- Rest of Europe
- Germany Mass Spectrometry Market Outlook, 2020-2030F
- Market Size & Analysis
- By Revenues (USD Million)
- Market Share & Analysis
- By Product Type – Market Size & Forecast 2020–2030, USD Million
- By Application – Market Size & Forecast 2020–2030, USD Million
- By End-User – Market Size & Forecast 2020–2030, USD Million
- Market Size & Analysis
- United Kingdom Mass Spectrometry Market Outlook, 2020-2030F
- Market Size & Analysis
- By Revenues (USD Million)
- Market Share & Analysis
- By Product Type – Market Size & Forecast 2020–2030, USD Million
- By Application – Market Size & Forecast 2020–2030, USD Million
- By End-User – Market Size & Forecast 2020–2030, USD Million
- Market Size & Analysis
- France Mass Spectrometry Market Outlook, 2020-2030F
- Market Size & Analysis
- By Revenues (USD Million)
- Market Share & Analysis
- By Product Type – Market Size & Forecast 2020–2030, USD Million
- By Application – Market Size & Forecast 2020–2030, USD Million
- By End-User – Market Size & Forecast 2020–2030, USD Million
- Market Size & Analysis
- Italy Mass Spectrometry Market Outlook, 2020-2030F
- Market Size & Analysis
- By Revenues (USD Million)
- Market Share & Analysis
- By Product Type – Market Size & Forecast 2020–2030, USD Million
- By Application – Market Size & Forecast 2020–2030, USD Million
- By End-User – Market Size & Forecast 2020–2030, USD Million
- Market Size & Analysis
- Spain Mass Spectrometry Market Outlook, 2020-2030F
- Market Size & Analysis
- By Revenues (USD Million)
- Market Share & Analysis
- By Product Type – Market Size & Forecast 2020–2030, USD Million
- By Application – Market Size & Forecast 2020–2030, USD Million
- By End-User – Market Size & Forecast 2020–2030, USD Million
- Market Size & Analysis
- Market Size & Analysis
- Middle East and Africa Mass Spectrometry Market Outlook, 2020-2030F
- Market Size & Analysis
- By Revenues (USD Million)
- Market Share & Analysis
- By Product Type – Market Size & Forecast 2020–2030, USD Million
- By Application – Market Size & Forecast 2020–2030, USD Million
- By End-User – Market Size & Forecast 2020–2030, USD Million
- By Country
- Saudi Arabia
- The UAE
- South Africa
- Rest of Middle East and Africa
- Saudi Arabia Mass Spectrometry Market Outlook, 2020-2030F
- Market Size & Analysis
- By Revenues (USD Million)
- Market Share & Analysis
- By Product Type – Market Size & Forecast 2020–2030, USD Million
- By Application – Market Size & Forecast 2020–2030, USD Million
- By End-User – Market Size & Forecast 2020–2030, USD Million
- Market Size & Analysis
- The UAE Mass Spectrometry Market Outlook, 2020-2030F
- Market Size & Analysis
- By Revenues (USD Million)
- Market Share & Analysis
- By Product Type – Market Size & Forecast 2020–2030, USD Million
- By Application – Market Size & Forecast 2020–2030, USD Million
- By End-User – Market Size & Forecast 2020–2030, USD Million
- Market Size & Analysis
- South Africa Mass Spectrometry Market Outlook, 2020-2030F
- Market Size & Analysis
- By Revenues (USD Million)
- Market Share & Analysis
- By Product Type – Market Size & Forecast 2020–2030, USD Million
- By Application – Market Size & Forecast 2020–2030, USD Million
- By End-User – Market Size & Forecast 2020–2030, USD Million
- Market Size & Analysis
- Market Size & Analysis
- Asia-Pacific Mass Spectrometry Market Outlook, 2020-2030F
- Market Size & Analysis
- By Revenues (USD Million)
- Market Share & Analysis
- By Product Type – Market Size & Forecast 2020–2030, USD Million
- By Application – Market Size & Forecast 2020–2030, USD Million
- By End-User – Market Size & Forecast 2020–2030, USD Million
- By Country
- China
- Japan
- India
- South Korea
- Australia
- Rest of Asia-Pacific
- China Mass Spectrometry Market Outlook, 2020-2030F
- Market Size & Analysis
- By Revenues (USD Million)
- Market Share & Analysis
- By Product Type – Market Size & Forecast 2020–2030, USD Million
- By Application – Market Size & Forecast 2020–2030, USD Million
- By End-User – Market Size & Forecast 2020–2030, USD Million
- Market Size & Analysis
- Japan Mass Spectrometry Market Outlook, 2020-2030F
- Market Size & Analysis
- By Revenues (USD Million)
- Market Share & Analysis
- By Product Type – Market Size & Forecast 2020–2030, USD Million
- By Application – Market Size & Forecast 2020–2030, USD Million
- By End-User – Market Size & Forecast 2020–2030, USD Million
- Market Size & Analysis
- India Mass Spectrometry Market Outlook, 2020-2030F
- Market Size & Analysis
- By Revenues (USD Million)
- Market Share & Analysis
- By Product Type – Market Size & Forecast 2020–2030, USD Million
- By Application – Market Size & Forecast 2020–2030, USD Million
- By End-User – Market Size & Forecast 2020–2030, USD Million
- Market Size & Analysis
- South Korea Mass Spectrometry Market Outlook, 2020-2030F
- Market Size & Analysis
- By Revenues (USD Million)
- Market Share & Analysis
- By Product Type – Market Size & Forecast 2020–2030, USD Million
- By Application – Market Size & Forecast 2020–2030, USD Million
- By End-User – Market Size & Forecast 2020–2030, USD Million
- Market Size & Analysis
- Australia Mass Spectrometry Market Outlook, 2020-2030F
- Market Size & Analysis
- By Revenues (USD Million)
- Market Share & Analysis
- By Product Type – Market Size & Forecast 2020–2030, USD Million
- By Application – Market Size & Forecast 2020–2030, USD Million
- By End-User – Market Size & Forecast 2020–2030, USD Million
- Market Size & Analysis
- Market Size & Analysis
- Global Mass Spectrometry Market Strategic Imperatives for Growth & Success
- Competition Outlook
- Company Profiles
- Thermo Fisher Scientific Inc.
- Business Description
- Product Portfolio
- Strategic Alliances or Partnerships
- Recent Developments
- Financial Details
- Others
- Agilent Technologies Inc.
- Business Description
- Product Portfolio
- Strategic Alliances or Partnerships
- Recent Developments
- Financial Details
- Others
- Waters Corporation
- Business Description
- Product Portfolio
- Strategic Alliances or Partnerships
- Recent Developments
- Financial Details
- Others
- Danaher Corporation
- Business Description
- Product Portfolio
- Strategic Alliances or Partnerships
- Recent Developments
- Financial Details
- Others
- Bruker Corporation
- Business Description
- Product Portfolio
- Strategic Alliances or Partnerships
- Recent Developments
- Financial Details
- Others
- Shimadzu Corporation
- Business Description
- Product Portfolio
- Strategic Alliances or Partnerships
- Recent Developments
- Financial Details
- Others
- PerkinElmer Inc.
- Business Description
- Product Portfolio
- Strategic Alliances or Partnerships
- Recent Developments
- Financial Details
- Others
- JEOL Ltd.
- Business Description
- Product Portfolio
- Strategic Alliances or Partnerships
- Recent Developments
- Financial Details
- Others
- LECO Corporation
- Business Description
- Product Portfolio
- Strategic Alliances or Partnerships
- Recent Developments
- Financial Details
- Others
- Advion, Inc.
- Business Description
- Product Portfolio
- Strategic Alliances or Partnerships
- Recent Developments
- Financial Details
- Others
- Analytik Jena AG
- Business Description
- Product Portfolio
- Strategic Alliances or Partnerships
- Recent Developments
- Financial Details
- Others
- Hiden Analytical
- Business Description
- Product Portfolio
- Strategic Alliances or Partnerships
- Recent Developments
- Financial Details
- Others
- Rigaku Corporation
- Business Description
- Product Portfolio
- Strategic Alliances or Partnerships
- Recent Developments
- Financial Details
- Others
- F. Hoffmann-LA Roche Ltd.
- Business Description
- Product Portfolio
- Strategic Alliances or Partnerships
- Recent Developments
- Financial Details
- Others
- Jasco Corporation
- Business Description
- Product Portfolio
- Strategic Alliances or Partnerships
- Recent Developments
- Financial Details
- Others
- Others
- Thermo Fisher Scientific Inc.
- Company Profiles
- Disclaimer
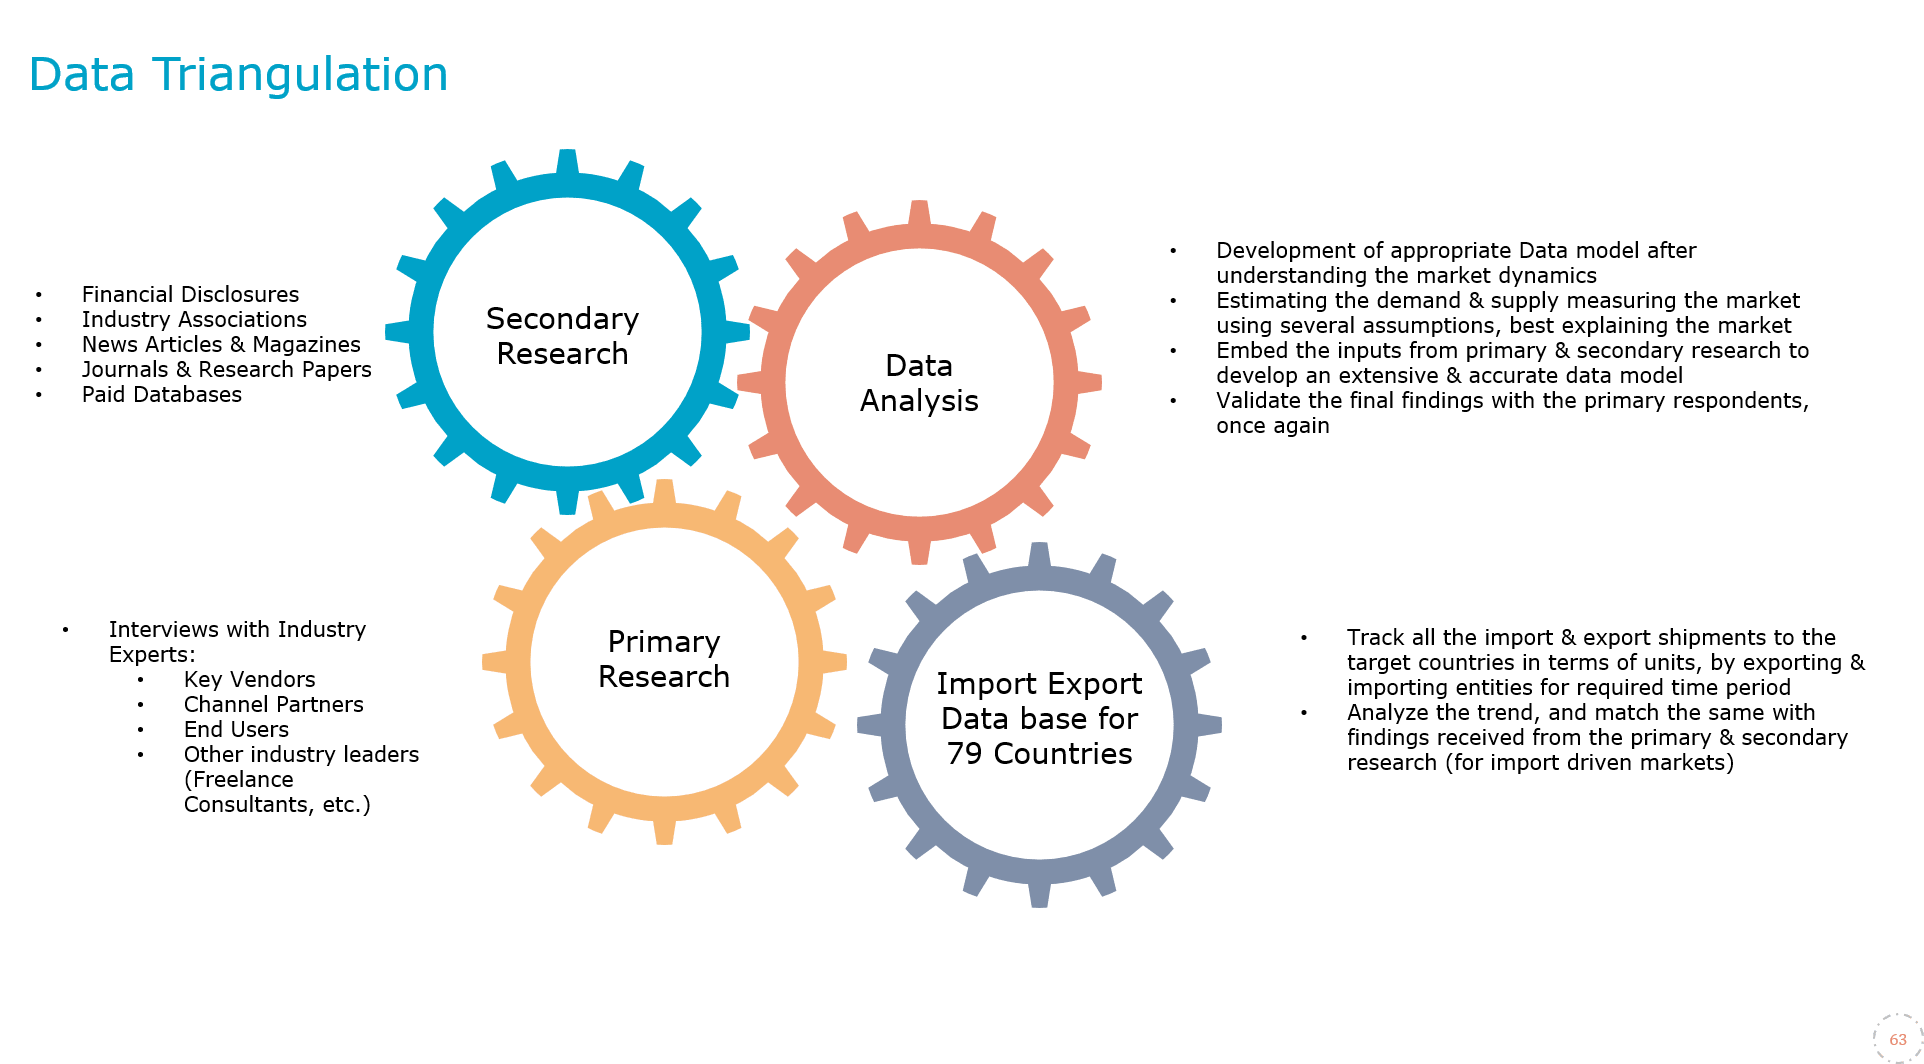
MarkNtel Advisors follows a robust and iterative research methodology designed to ensure maximum accuracy and minimize deviation in market estimates and forecasts. Our approach combines both bottom-up and top-down techniques to effectively segment and quantify various aspects of the market. A consistent feature across all our research reports is data triangulation, which examines the market from three distinct perspectives to validate findings. Key components of our research process include:
1. Scope & Research Design At the outset, MarkNtel Advisors define the research objectives and formulate pertinent questions. This phase involves determining the type of research—qualitative or quantitative—and designing a methodology that outlines data collection methods, target demographics, and analytical tools. They also establish timelines and budgets to ensure the research aligns with client goals.
2. Sample Selection and Data Collection In this stage, the firm identifies the target audience and determines the appropriate sample size to ensure representativeness. They employ various sampling methods, such as random or stratified sampling, based on the research objectives. Data collection is carried out using tools like surveys, interviews, and observations, ensuring the gathered data is reliable and relevant.
3. Data Analysis and Validation Once data is collected, MarkNtel Advisors undertake a rigorous analysis process. This includes cleaning the data to remove inconsistencies, employing statistical software for quantitative analysis, and thematic analysis for qualitative data. Validation steps are taken to ensure the accuracy and reliability of the findings, minimizing biases and errors.
4. Data Forecast and FinalizationThe final phase involves forecasting future market trends based on the analyzed data. MarkNtel Advisors utilize predictive modeling and time series analysis to anticipate market behaviors. The insights are then compiled into comprehensive reports, featuring visual aids like charts and graphs, and include strategic recommendations to inform client decision-making

