
Global Floating Wind Turbines Market Research Report: Forecast (2026-2032)
Floating Wind Turbines Market - By Technology / Platform Type (Spar-buoy, Semi-submersible, Tension-leg platform (TLP), Other emerging types), By Turbine Capacity (<5 MW, 5–10 MW, ... 10–15 MW, >15 MW), By Operation (On-Off Operation, Modulating Operation), By Water Depth (200–400 m, 400–600 m, 600 m), By Application / End Use (Utility-scale, Isolated/Off-grid or industrial), By Project Stage (Operational, Under construction, Planned/Approved, Pilot/Demonstration), By Component / System (Wind Turbine Generators (WTG), Floating Platforms, Mooring & Anchoring Systems, Cables & Subsea Infrastructure, Operation & Maintenance Services (O&M), By Investment / Business Model (Independent Power Producers (IPP), Utility & Government-led, Public-Private Partnerships (PPP), and others Read more
- Energy
- Dec 2025
- Pages 198
- Report Format: PDF, Excel, PPT
Global Floating Wind Turbines Market
Projected 41.52% CAGR from 2026 to 2032
Study Period
2026-2032
Market Size (2025)
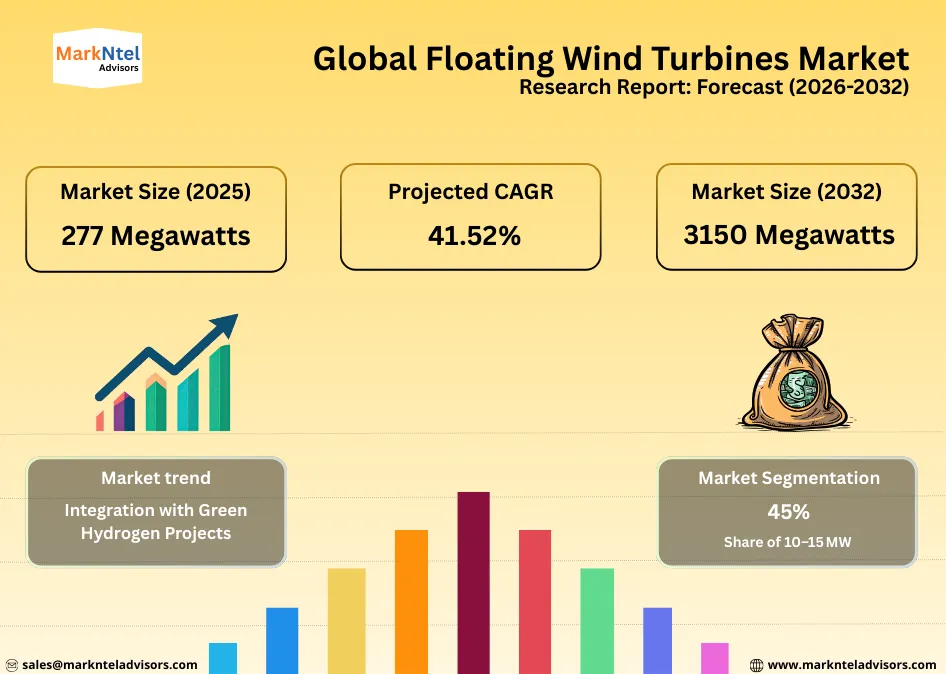
277 Megawatts
Market Size (2032)
3150 Megawatts
Largest Region
Europe
Projected CAGR
41.52%
Leading Segments
By Turbine Capacity: 10–15 MW
Global Floating Wind Turbines Market Report Key Takeaways:
- The Global Floating Wind Turbines Market size was valued at around 277 MW in 2025 and is projected to reach 3,150 MW by 2032. The estimated CAGR from 2026 to 2032 is around 41.52%, indicating strong growth.
- By Technology / Platform Type, the Spar-buoy segment holds around 47% share of the Global Floating Wind Turbines Market size in 2025.
- By Turbine Capacity, the 10–15 MW capacity segment represented 45% of the Global Floating Wind Turbines Market size in 2025.
- By Region, the Global Floating Wind Turbines Market is dominated by Europe, accounting for 65% share of the market.
- The leading floating wind turbine companies in the global market are ABB Group, Siemens Gamesa Renewable, MHI Vestas Offshore Wind, General Electric Company, Mingyang Smart Energy Group Co., Ltd, Doosan Corporation, Goldwind, Hitachi, Vestas, Shanghai Electric, and others.
Market Insights & Analysis: Global Floating Wind Turbines Market (2026- 2032):
The Global Floating Wind Turbines Market size was valued at around 277 megawatts in 2025 and is projected to reach 3,150 megawatts by 2032. Along with this, the market is estimated to grow at a CAGR of around 41.52% during the forecast period, i.e., 2026-32. The Global Floating Wind Turbines Market is primarily driven by rising global renewable energy targets and the growing adoption of floating wind technology to harness strong deep-water offshore wind resources where fixed turbines are not feasible. As countries accelerate decarbonization strategies, floating offshore wind has emerged as a practical solution for regions with steep seabed conditions and limited shallow-water availability.
By 2025, global floating wind capacity increased by 13% year-on-year to approximately 277 MW, supported by operational projects in Europe and Asia, while an additional 93 MW remains under construction. This growth reflects increasing confidence in floating platforms as a commercially deployable offshore technology. Government-led initiatives continue to shape future expansion. For instance, national offshore wind roadmaps in North America and Europe emphasize deeper-water deployment as a strategic priority for long-term energy security.
On a broader offshore wind scale, the International Energy Agency (IEA) projects global offshore wind capacity, including fixed-bottom and floating technologies, will expand from around 9.2 GW in 2024 to over 37 GW annually by 2030, propelled by policy support and renewable energy targets in Europe, Asia Pacific, and North America.
Emerging commercial projects such as large-scale floating farms and integration with green hydrogen infrastructure are expected to accelerate deployment beyond 2025. These initiatives, supported by public investment and conducive regulatory environments, will enhance market competitiveness and lower levelized costs over time. By expanding access to stronger deep-water wind resources and aligning with net-zero strategies, the floating wind segment is set to play an increasingly important role in the global renewable energy landscape through 2032.
Global Floating Wind Turbines Market Recent Developments:
- September 2025: Principle Power’s WindFloat® floating platforms surpassed 1 TWh of cumulative electricity generation across projects in Portugal and Scotland, demonstrating the technical maturity, offshore resilience, and commercial readiness of floating wind foundations while boosting investor confidence in scaling future projects using 15–20 MW turbines.
- September 2025: Lloyd’s Register granted Approval in Principle (AiP) to Samsung Heavy Industries for its SnapWind Float design. This certification validates the platform’s engineering and safety standards, supports commercial deployment, reduces project risk, and helps unlock offshore wind investments worth hundreds of millions of USD globally.
Global Floating Wind Turbines Market Scope:
| Category | Segments |
|---|---|
| By Technology / Platform Type | Spar-buoy, Semi-submersible, Tension-leg platform (TLP), Other emerging types), |
| By Turbine Capacity | (<5 MW, 5–10 MW, 10–15 MW, >15 MW), |
| By Operation | On-Off Operation, Modulating Operation), |
| By Water Depth | 200–400 m, 400–600 m, 600 m), |
| By Application / End Use | Utility-scale, Isolated/Off-grid or industrial), |
| By Project Stage | Operational, Under construction, Planned/Approved, Pilot/Demonstration), |
| By Component / System | Wind Turbine Generators (WTG), Floating Platforms, Mooring & Anchoring Systems, Cables & Subsea Infrastructure, Operation & Maintenance Services (O&M), |
| By Investment / Business Model | Independent Power Producers (IPP), Utility & Government-led, Public-Private Partnerships (PPP), and others |
Global Floating Wind Turbines Market Drivers:
Rising Demand for Sustainable & Clean Energy
The escalating global demand for sustainable and clean energy is a fundamental driver of the Global Floating Wind Turbines Market. According to the International Energy Agency (IEA), global renewable electricity capacity is projected to increase nearly 4,600 GW between 2025 and 2030, more than double the expansion seen in the previous five years, with offshore wind, including floating wind, playing a key role in this growth trajectory. Renewables are expected to become the largest source of global electricity by around 2025–2026, overtaking coal, and contributing an estimated 43–45% of total electricity generation by 2030.
Governments worldwide are committing significant funds toward clean energy transitions. For example, U.S. clean energy investments under the Inflation Reduction Act are projected to reach USD 370 billion, supporting wind and solar deployment through the late 2020s.
India’s renewable capacity reached 184.6 GW by June 2025, comprising nearly half of its total installed power capacity, with wind playing an increasingly prominent role.
Moreover, renewable additions are expected to remain robust, with the IEA forecasting that annual offshore wind capacity additions will grow from around 9.2 GW in 2024 to over 37 GW by 2030, driven by deeper offshore projects and supportive policy frameworks.
Overall, this sustained global shift toward clean energy, backed by strong governmental policies and substantial future investments, will continue to elevate demand for renewable technologies like floating wind turbines. The expanding clean energy footprint not only mitigates carbon emissions but also ensures robust market growth for floating wind systems in the upcoming years.
Global Floating Wind Turbines Market Trends:
Integration with Green Hydrogen Projects
A growing strategic trend in the global floating wind turbines industry is the integration of offshore renewable energy with green hydrogen production, enabling renewable electricity from wind to be converted into hydrogen via electrolysis. This approach addresses energy storage challenges and supports decarbonizing sectors like heavy industry and transport. In Scotland, government plans aim for a net-export green hydrogen target of 94 TWh annually by 2045, leveraging extensive offshore wind capacity to feed hydrogen infrastructure and export markets. This initiative received USD 21.2 million in public funding from the Scottish Government’s Energy Transition Fund toward hydrogen export infrastructure development.
In France’s Exclusive Economic Zone near Dunkirk, EDF has launched the HYODE project, coupling offshore wind power with an offshore electrolyzer station designed to produce green hydrogen and transport it by ship to ports. This represents a practical model for integrating offshore wind generation with hydrogen production facilities, enabling deeper water sites to contribute to energy diversification.
Beyond Europe, governments are exploring similar linkages; for instance, in 2023, the Dutch government granted USD 3.2 million to develop a floating hydrogen and ammonia facility connected to offshore wind sites, planned to be operational by 2027.
Overall, integrating floating wind with green hydrogen production is accelerating policy support and guiding infrastructure investments, enhancing the long-term economic viability of offshore renewable systems and expanding market demand over the next decade.
Global Floating Wind Turbines Market Challenges:
High Capital & Installation Costs
A major challenge facing the Global Floating Wind Turbines Market is the high capital expenditure (CAPEX) and complex installation requirements associated with deep-water offshore projects. Floating wind farms require advanced turbine units, custom floating platforms, specialized marine vessels, and extensive subsea infrastructure, significantly increasing upfront investment compared with fixed-bottom or onshore wind. According to the European Union’s EU Blue Economy Report 2025, the levelized cost of electricity (LCOE) for floating wind projects between 2020–2023 ranged widely at approximately USD 158–382/MWh due to manufacturing, engineering, and deployment challenges. Floating wind’s limited deployment volume further restricts economies of scale, keeping CAPEX high.
Governments are responding with targeted subsidies to mitigate these costs. For example, Norway’s inaugural floating wind tender includes up to USD 3.37 billion in capped state support to help developers bear early construction and technology risks.
Similarly, the UK government’s USD 71 million investment in the Port of Cromarty Firth aims to build floating wind infrastructure, addressing costly port and assembly bottlenecks that currently hinder installation efficiency.
Additionally, infrastructure adaptation costs (e.g., port upgrades, grid connections) remain significant; floating wind installations need deeper harbors and larger vessels, which further escalate CAPEX.
The high capital and installation costs driven by custom deep-water technology and specialized logistics remain a key barrier to faster floating wind adoption. Government support mitigates, but does not yet eliminate, this burden, underscoring the need for cost-reduction strategies and policy frameworks to unlock broader market growth.
Global Floating Wind Turbines Market (2026-32) Segmentation Analysis:
The Global Floating Wind Turbines Market Report and Forecast 2026-2032 offers a detailed analysis of the market based on the following segments:
Based on Technology / Platform Type
- Spar-buoy
- Semi-submersible
- Tension-leg platform (TLP)
- Other emerging types
The Spar-buoy platform leads the global floating wind turbines industry with a 47% share, driven by its stability in deep-water conditions and relative ease of deployment. This cylindrical buoy design, anchored with catenary mooring lines, can support large turbines in waters exceeding 200 m. Operational projects demonstrate their reliability and scalability. Hywind Tampen in Norway operates 11 turbines on spar-buoy foundations at approximately 300 m depth, successfully delivering commercial-scale electricity in extreme offshore conditions.
European initiatives continue to favor spar-buoy designs due to proven performance, structural resilience, and compatibility with larger turbine capacities. Its adaptability to high-wind offshore zones and ability to reduce installation and operational risks make it the preferred choice for deep-water floating wind projects globally, reinforcing its market leadership.
Based on Turbine Capacity
- <5 MW
- 5–10 MW
- 10–15 MW
- >15 MW
Turbines in the 10–15 MW capacity range dominate the market with 45% market share, reflecting the industry’s shift toward larger units that maximize energy output per platform and lower the levelized cost of electricity. Recent projects exemplify this trend. In 2024, the Green Volt floating wind farm in the North Sea planned to deploy multiple turbines around 16 MW, while Ocergy’s 15 MW-plus floating turbine project (2025) demonstrates the adoption of high-capacity turbines on deep-water platforms.
Pairing these large turbines with spar-buoy foundations ensures structural stability, higher energy yield, and cost efficiency. As offshore wind expands into deeper waters with stronger and more consistent wind resources, the preference for 10–15 MW turbines is expected to increase, reinforcing their market dominance and supporting large-scale, economically viable floating wind projects through the late 2020s.
Global Floating Wind Turbines Market (2026-32): Regional Projection
The Global Floating Wind Turbines Market is dominated by Europe, accounting for about 65% of the market share. This leadership stems from the region’s ambitious renewable energy targets, mature regulatory frameworks, and longstanding expertise in offshore wind infrastructure. European nations have prioritized deep‑water wind development to meet climate goals and reduce fossil fuel dependence. For instance, in 2025, Ocean Winds successfully installed the first floating wind turbine off the French Mediterranean coast as part of the Éoliennes Flottantes du Golfe du Lion (EFGL) project, marking a key step in commercial floating wind deployment in Europe.
Europe’s extensive offshore experience, favorable government policies, and strong investment support long‑term planning and industrial supply chains. Regulatory commitments such as the European Union’s ambitious offshore wind capacity goals further solidify its advantage. With vast areas of suitable deep‑water sites and integrated maritime industries, Europe continues to attract project developers and capital.
Gain a Competitive Edge with Our Global Floating Wind Turbines Market Report
- Global Floating Wind Turbines Market Report by MarkNtel Advisors provides a detailed & thorough analysis of market size & share, growth rate, competitive landscape, and key players. This comprehensive analysis helps businesses gain a holistic understanding of the market dynamics & make informed decisions.
- This report also highlights current market trends & future projections, allowing businesses to identify emerging opportunities & potential challenges. By understanding market forecasts, companies can align their strategies & stay ahead of the competition.
- Global Floating Wind Turbines Market Report aids in assessing & mitigating risks associated with entering or operating in the market. By understanding market dynamics, regulatory frameworks, and potential challenges, businesses can develop strategies to minimize risks & optimize their operations.
*Reports Delivery Format - Market research studies from MarkNtel Advisors are offered in PDF, Excel and PowerPoint formats. Within 24 hours of the payment being successfully received, the report will be sent to your email address.
Frequently Asked Questions
- Market Segmentation
- Introduction
- Product Definition
- Research Process
- Assumptions
- Executive Summary
- Global Floating Wind Turbines Market Policies, Regulations, Product Standards
- Global Floating Wind Turbines Market Trends & Development
- Global Floating Wind Turbines Market Dynamics
- Growth Drivers
- Challenges
- Global Floating Wind Turbines Market Hotspot & Opportunities
- Global Floating Wind Turbines Market Outlook, 2022-2032F
- Market Size & Analysis
- By Revenue (USD Million & Megawatt)
- Market Share & Analysis
- By Technology / Platform Type- (USD Million & Megawatt)
- Spar-buoy
- Semi-submersible
- Tension-leg platform (TLP)
- Other emerging types
- By Turbine Capacity- (USD Million & Megawatt)
- <5 MW
- 5–10 MW
- 10–15 MW
- >15 MW
- By Operation- (USD Million & Megawatt)
- On-Off Operation
- Modulating Operation
- By Water Depth- (USD Million & Megawatt)
- 200–400 m
- 400–600 m
- 600 m
- By Application / End Use- (USD Million & Megawatt)
- Utility-scale
- Isolated/Off-grid or industrial
- By Project Stage
- Operational
- Under construction
- Planned/Approved
- Pilot/Demonstration
- By Component / System- (USD Million & Megawatt)
- Wind Turbine Generators (WTG)
- Floating Platforms
- Mooring & Anchoring Systems
- Cables & Subsea Infrastructure
- Operation & Maintenance Services (O&M)
- By Investment / Business Model- (USD Million & Megawatt)
- Independent Power Producers (IPP)
- Utility & Government-led
- Public-Private Partnerships (PPP)
- By Region
- Europe
- Asia-Pacific
- North America
- Other regions
- By Company
- Competition Characteristics
- Market Share & Analysis
- By Technology / Platform Type- (USD Million & Megawatt)
- Market Size & Analysis
- North America Floating Wind Turbines Market Outlook, 2022-2032F
- Market Size & Analysis
- By Revenue (USD Million & Megawatt)
- Market Share & Analysis
- By Technology / Platform Type- (USD Million & Megawatt)
- By Turbine Capacity- (USD Million & Megawatt)
- By Operation- (USD Million & Megawatt)
- By Water Depth- (USD Million & Megawatt)
- By Application / End Use- (USD Million & Megawatt)
- By Component / System- (USD Million & Megawatt)
- By Investment / Business Model- (USD Million & Megawatt)
- By Country
- The US
- Canada
- Mexico
- The US Floating Wind Turbines Market Outlook, 2022-2032F
- Market Size & Analysis
- By Revenue (USD Million & Megawatt)
- Market Share & Analysis
- By Technology / Platform Type- (USD Million & Megawatt)
- By Turbine Capacity- (USD Million & Megawatt)
- By Operation- (USD Million & Megawatt)
- By Water Depth- (USD Million & Megawatt)
- By Application / End Use- (USD Million & Megawatt)
- By Component / System- (USD Million & Megawatt)
- By Investment / Business Model- (USD Million & Megawatt)
- Market Size & Analysis
- Canada Floating Wind Turbines Market Outlook, 2022-2032F
- Market Size & Analysis
- By Revenue (USD Million & Megawatt)
- Market Share & Analysis
- By Technology / Platform Type- (USD Million & Megawatt)
- By Turbine Capacity- (USD Million & Megawatt)
- By Operation- (USD Million & Megawatt)
- By Water Depth- (USD Million & Megawatt)
- By Application / End Use- (USD Million & Megawatt)
- By Component / System- (USD Million & Megawatt)
- By Investment / Business Model- (USD Million & Megawatt)
- Market Size & Analysis
- Mexico Floating Wind Turbines Market Outlook, 2022-2032F
- Market Size & Analysis
- By Revenue (USD Million & Megawatt)
- Market Share & Analysis
- By Technology / Platform Type- (USD Million & Megawatt)
- By Turbine Capacity- (USD Million & Megawatt)
- By Operation- (USD Million & Megawatt)
- By Water Depth- (USD Million & Megawatt)
- By Application / End Use- (USD Million & Megawatt)
- By Component / System- (USD Million & Megawatt)
- By Investment / Business Model- (USD Million & Megawatt)
- Market Size & Analysis
- Market Size & Analysis
- Europe Floating Wind Turbines Market Outlook, 2022-2032F
- Market Size & Analysis
- By Revenue (USD Million & Megawatt)
- Market Share & Analysis
- By Technology / Platform Type- (USD Million & Megawatt)
- By Turbine Capacity- (USD Million & Megawatt)
- By Operation- (USD Million & Megawatt)
- By Water Depth- (USD Million & Megawatt)
- By Application / End Use- (USD Million & Megawatt)
- By Component / System- (USD Million & Megawatt)
- By Investment / Business Model- (USD Million & Megawatt)
- By Country
- The UK
- Norway
- Italy
- Germany
- France
- Rest of Europe
- The UK Floating Wind Turbines Market Outlook, 2022-2032F
- Market Size & Analysis
- By Revenue (USD Million & Megawatt)
- Market Share & Analysis
- By Technology / Platform Type- (USD Million & Megawatt)
- By Turbine Capacity- (USD Million & Megawatt)
- By Operation- (USD Million & Megawatt)
- By Water Depth- (USD Million & Megawatt)
- By Application / End Use- (USD Million & Megawatt)
- By Component / System- (USD Million & Megawatt)
- By Investment / Business Model- (USD Million & Megawatt)
- Market Size & Analysis
- Norway Floating Wind Turbines Market Outlook, 2022-2032F
- Market Size & Analysis
- By Revenue (USD Million & Megawatt)
- Market Share & Analysis
- By Technology / Platform Type- (USD Million & Megawatt)
- By Turbine Capacity- (USD Million & Megawatt)
- By Operation- (USD Million & Megawatt)
- By Water Depth- (USD Million & Megawatt)
- By Application / End Use- (USD Million & Megawatt)
- By Component / System- (USD Million & Megawatt)
- By Investment / Business Model- (USD Million & Megawatt)
- Market Size & Analysis
- Italy Floating Wind Turbines Market Outlook, 2022-2032F
- Market Size & Analysis
- By Revenue (USD Million & Megawatt)
- Market Share & Analysis
- By Technology / Platform Type- (USD Million & Megawatt)
- By Turbine Capacity- (USD Million & Megawatt)
- By Operation- (USD Million & Megawatt)
- By Water Depth- (USD Million & Megawatt)
- By Application / End Use- (USD Million & Megawatt)
- By Component / System- (USD Million & Megawatt)
- By Investment / Business Model- (USD Million & Megawatt)
- Market Size & Analysis
- France Floating Wind Turbines Market Outlook, 2022-2032F
- Market Size & Analysis
- By Revenue (USD Million & Megawatt)
- Market Share & Analysis
- By Technology / Platform Type- (USD Million & Megawatt)
- By Turbine Capacity- (USD Million & Megawatt)
- By Operation- (USD Million & Megawatt)
- By Water Depth- (USD Million & Megawatt)
- By Application / End Use- (USD Million & Megawatt)
- By Component / System- (USD Million & Megawatt)
- By Investment / Business Model- (USD Million & Megawatt)
- Market Size & Analysis
- Market Size & Analysis
- Asia-Pacific Floating Wind Turbines Market Outlook, 2022-2032F
- Market Size & Analysis
- By Revenue (USD Million & Megawatt)
- Market Share & Analysis
- By Technology / Platform Type- (USD Million & Megawatt)
- By Turbine Capacity- (USD Million & Megawatt)
- By Operation- (USD Million & Megawatt)
- By Water Depth- (USD Million & Megawatt)
- By Application / End Use- (USD Million & Megawatt)
- By Component / System- (USD Million & Megawatt)
- By Investment / Business Model- (USD Million & Megawatt)
- By Country
- China
- Japan
- South Korea
- Rest of APAC
- China Floating Wind Turbines Market Outlook, 2022-2032F
- Market Size & Analysis
- By Revenue (USD Million & Megawatt)
- Market Share & Analysis
- By Technology / Platform Type- (USD Million & Megawatt)
- By Turbine Capacity- (USD Million & Megawatt)
- By Operation- (USD Million & Megawatt)
- By Water Depth- (USD Million & Megawatt)
- By Application / End Use- (USD Million & Megawatt)
- By Component / System- (USD Million & Megawatt)
- By Investment / Business Model- (USD Million & Megawatt)
- Market Size & Analysis
- Japan Floating Wind Turbines Market Outlook, 2022-2032F
- Market Size & Analysis
- By Revenue (USD Million & Megawatt)
- Market Share & Analysis
- By Technology / Platform Type- (USD Million & Megawatt)
- By Turbine Capacity- (USD Million & Megawatt)
- By Operation- (USD Million & Megawatt)
- By Water Depth- (USD Million & Megawatt)
- By Application / End Use- (USD Million & Megawatt)
- By Component / System- (USD Million & Megawatt)
- By Investment / Business Model- (USD Million & Megawatt)
- Market Size & Analysis
- South Korea Floating Wind Turbines Market Outlook, 2022-2032F
- Market Size & Analysis
- By Revenue (USD Million & Megawatt)
- Market Share & Analysis
- By Technology / Platform Type- (USD Million & Megawatt)
- By Turbine Capacity- (USD Million & Megawatt)
- By Operation- (USD Million & Megawatt)
- By Water Depth- (USD Million & Megawatt)
- By Application / End Use- (USD Million & Megawatt)
- By Component / System- (USD Million & Megawatt)
- By Investment / Business Model- (USD Million & Megawatt)
- Market Size & Analysis
- Market Size & Analysis
- Global Floating Wind Turbines Market Key Strategic Imperatives for Success & Growth
- Competition Outlook
- Company Profiles
- ABB Group
- Business Description
- Product Portfolio
- Strategic Alliances or Partnerships
- Recent Developments
- Financial Details
- Others
- Siemens Gamesa Renewable
- Business Description
- Product Portfolio
- Strategic Alliances or Partnerships
- Recent Developments
- Financial Details
- Others
- MHI Vestas Offshore Wind
- Business Description
- Product Portfolio
- Strategic Alliances or Partnerships
- Recent Developments
- Financial Details
- Others
- General Electric Company
- Business Description
- Product Portfolio
- Strategic Alliances or Partnerships
- Recent Developments
- Financial Details
- Others
- Mingyang Smart Energy Group Co., Ltd.
- Business Description
- Product Portfolio
- Strategic Alliances or Partnerships
- Recent Developments
- Financial Details
- Others
- Doosan Corporation
- Business Description
- Product Portfolio
- Strategic Alliances or Partnerships
- Recent Developments
- Financial Details
- Others
- Goldwind
- Business Description
- Product Portfolio
- Strategic Alliances or Partnerships
- Recent Developments
- Financial Details
- Others
- Hitachi
- Business Description
- Product Portfolio
- Strategic Alliances or Partnerships
- Recent Developments
- Financial Details
- Others
- Vestas
- Business Description
- Product Portfolio
- Strategic Alliances or Partnerships
- Recent Developments
- Financial Details
- Others
- Shanghai Electric
- Business Description
- Product Portfolio
- Strategic Alliances or Partnerships
- Recent Developments
- Financial Details
- Others
- Others
- ABB Group
- Company Profiles
- Disclaimer
MarkNtel Advisors follows a robust and iterative research methodology designed to ensure maximum accuracy and minimize deviation in market estimates and forecasts. Our approach combines both bottom-up and top-down techniques to effectively segment and quantify various aspects of the market. A consistent feature across all our research reports is data triangulation, which examines the market from three distinct perspectives to validate findings. Key components of our research process include:
1. Scope & Research Design At the outset, MarkNtel Advisors define the research objectives and formulate pertinent questions. This phase involves determining the type of research—qualitative or quantitative—and designing a methodology that outlines data collection methods, target demographics, and analytical tools. They also establish timelines and budgets to ensure the research aligns with client goals.
2. Sample Selection and Data Collection In this stage, the firm identifies the target audience and determines the appropriate sample size to ensure representativeness. They employ various sampling methods, such as random or stratified sampling, based on the research objectives. Data collection is carried out using tools like surveys, interviews, and observations, ensuring the gathered data is reliable and relevant.
3. Data Analysis and Validation Once data is collected, MarkNtel Advisors undertake a rigorous analysis process. This includes cleaning the data to remove inconsistencies, employing statistical software for quantitative analysis, and thematic analysis for qualitative data. Validation steps are taken to ensure the accuracy and reliability of the findings, minimizing biases and errors.

4. Data Forecast and FinalizationThe final phase involves forecasting future market trends based on the analyzed data. MarkNtel Advisors utilize predictive modeling and time series analysis to anticipate market behaviors. The insights are then compiled into comprehensive reports, featuring visual aids like charts and graphs, and include strategic recommendations to inform client decision-making
We offer flexible licensing options to cater to varying organizational needs. Choose the pricing pack that best suits your requirements:
Buy Now

