
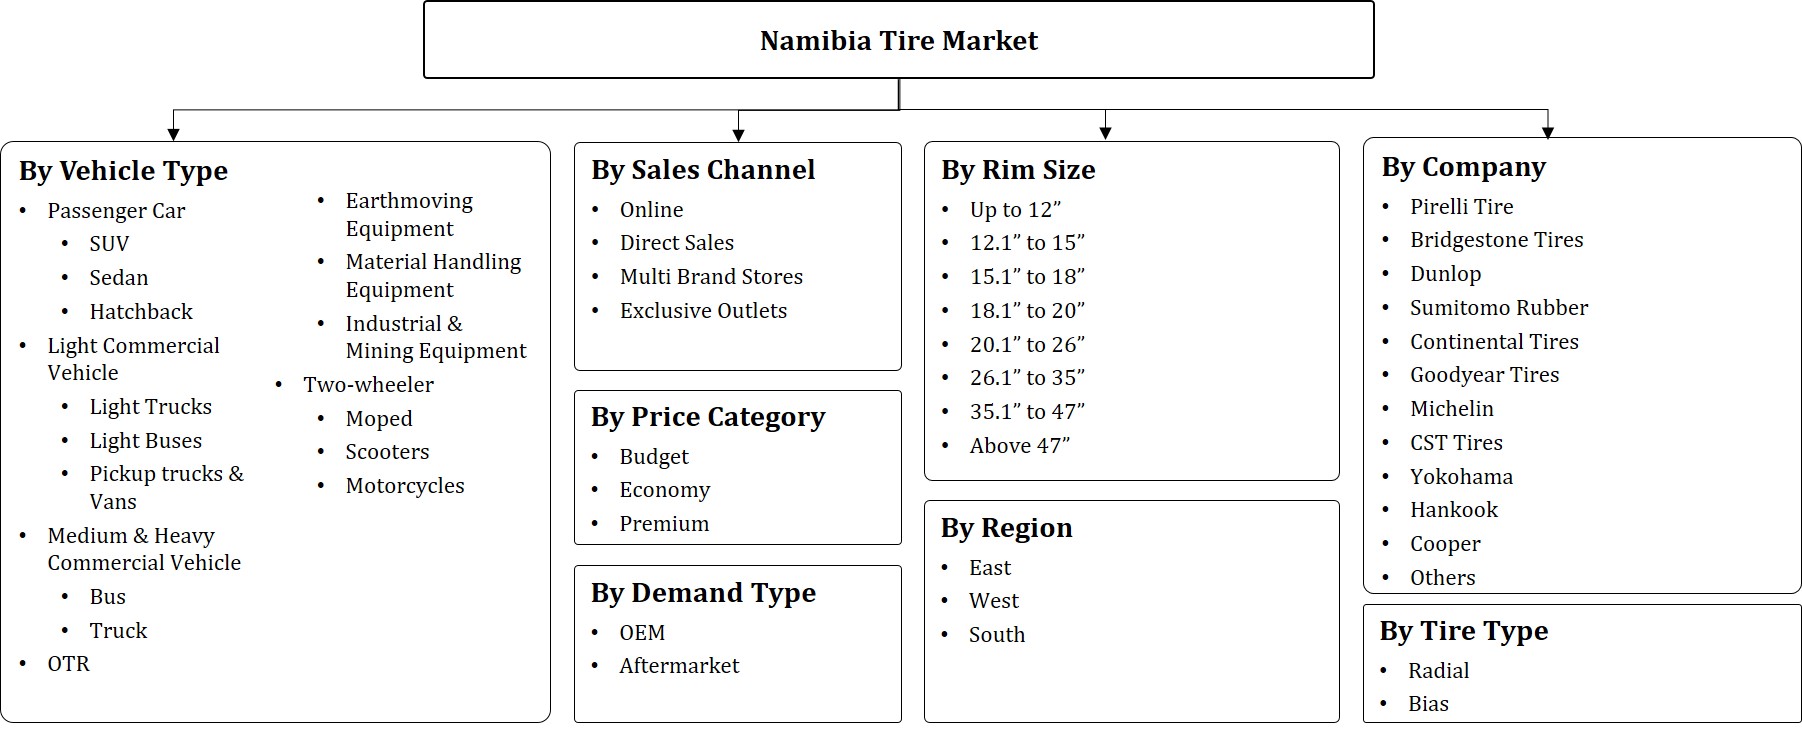
By Vehicle Type (Passenger Cars (SUV, Sedan, Hatchback & Bakkies), Light Commercial Vehicles (LCV) (Light Trucks, Light Buses, Pickup Trucks & Vans), Medium & Heavy Commercial Vehi......cles (Bus, Truck, Two Wheelers, Moped, Scooters, Motorcycles), Off the Road (OTR) (Earthmoving Equipment, Material Handling Equipment, Industrial & Mining Equipment), By Demand Type (OEM, Replacement), By Type of Tire (Radial, Bias), By Season (All-Season, Summer), By Sales Channel (Online, Dealers/ Exclusive Outlets), By Rim Size (Up to 12, 12.1” to 15”, 15.1.” to 18”, 18.1” to 20”, 20.1” to 22.5”, 22.6” to 26”, 26.1” to 35”, 35.1” to 47”, Above 47”), By Price Category (Low, Medium, High), By Region (AI Khor, Ad Dawhah, AI Wakrah, AI Rayyan), By Competitors (Bridgestone Corporation, Continental, Sumitomo Rubber Co., Goodyear, Michelin, Pirelli, CST Tires) Read more
- Tire
- Aug 2023
- 153
- PDF, Excel, PPT
Market Definition
Namibia's automotive & tire industries are undergoing significant developments and expect steady growth in the near future. Since the country has only a few prominent tire manufacturers, the tire industry is mainly import-driven. With superior road infrastructure, Namibia is experiencing a swift volume growth in its vehicle fleet, i.e., generating promising opportunities for tire manufacturers and boosting the overall tire industry.
Market Insights & Analysis: Namibia Tire Market (2023-28)
The Namibia Tire Market is projected to grow at around 2.8% CAGR during the forecast period, i.e., 2023-28. The market is likely to be driven principally by improving economic conditions and, in turn, the growing consumer inclination toward private vehicle ownership, i.e., leading to a rising vehicle fleet size and, subsequently, increasing demand for tires in the country. In addition, the immense focus of the government on infrastructural developments associated with road construction, maintenance, & expansion is also showcasing an increasing number of vehicles on roads and, in turn, positively influencing the Namibia tire market growth.
| Report Coverage | Details |
|---|---|
| Study Period | Historical Data: 2018-21 |
| Base Year: 2022 | |
| Forecast Period: 2023-28 | |
| CAGR(2023-28) | 2.8% |
| Key Companies Profiled | Bridgestone Corporation, Continental, Sumitomo Rubber Co., Goodyear, Michelin, Pirelli, and CST Tires. |
| Unit Denominations | USD Million/Billion |
As vehicles have become a necessity for people instead of a luxury, the sales of second-hand cars are also escalating swiftly, i.e., creating the need for timely repairs & replacement of tires. In addition, the mining & agriculture sectors of Namibia are vital contributors to its economy, and these industries constantly require specialized vehicles & machinery that rely on durable tires. Hence, growth in these sectors has a direct impact on the demand for tires, particularly for mining trucks & agricultural machinery.
The tire market in Namibia is largely import-driven as the country does not have significant domestic tire manufacturing capacity and relies heavily on tire imports from South Africa, China, Europe, & the United States to cater to the end-user demand. Though the government has taken some initiatives to establish tire manufacturing plants in the country, it is not yet at a scale to fulfill the entire domestic demand. Tire importers, distributors, & retailers in the country are playing a crucial role in sourcing tires from international manufacturers to cater to the diverse needs of consumers and, consequently, propelling the growth of the tire industry in Namibia.
Namibia Tire Market Research Report (2023-2028) - Table of Contents
- Market Segmentation
- Introduction
- Market Definition
- Research Process
- Assumptions
- Executive Summary
- Namibia Tire Market Trends & Development
- Namibia Tire Market Dynamics
- Drivers
- Challenges
- Namibia Tire Market PORTER’S Five Forces Analysis
- Namibia Tire Market Value Chain & Margin Analysis
- Namibia Tire Market Regulations, Policies & Product Standards
- Namibia Tire Market Hotspot & Opportunities
- Namibia Tire Market Analysis, 2018-2028
- Market Size & Analysis
- By Revenues (USD Million)
- By Units Sold (Thousand Units)
- Market Share & Analysis
- By Vehicle Type
- Passenger Car-Market Size & Forecast 2018-2028F, Units Sold (Thousand Units)
- Light Commercial Vehicle (LCV) -Market Size & Forecast 2018-2028F, Units Sold (Thousand Units)
- Medium & Heavy Commercial Vehicle (MHCV) -Market Size & Forecast 2018-2028F, Units Sold (Thousand Units)
- Off-Road Tire (OTR) -Market Size & Forecast 2018-2028F, Units Sold (Thousand Units)
- Two Wheeler-Market Size & Forecast 2018-2028F, Units Sold (Thousand Units)
- By Demand Type
- OEM-Market Size & Forecast 2018-2028F, Units Sold (Thousand Units)
- Aftermarket-Market Size & Forecast 2018-2028F, Units Sold (Thousand Units)
- By Tire Type
- Radial-Market Size & Forecast 2018-2028F, Units Sold (Thousand Units)
- Bias-Market Size & Forecast 2018-2028F, Units Sold (Thousand Units)
- By Sales Channel
- Online-Market Size & Forecast 2018-2028F, Units Sold (Thousand Units)
- Direct Sales-Market Size & Forecast 2018-2028F, Units Sold (Thousand Units)
- Multi Brand Stores-Market Size & Forecast 2018-2028F, Units Sold (Thousand Units)
- Exclusive Outlets-Market Size & Forecast 2018-2028F, Units Sold (Thousand Units)
- By Price Category
- Budget-Market Size & Forecast 2018-2028F, Unit Sold (Thousand)
- Economy-Market Size & Forecast 2018-2028F, Unit Sold (Thousand)
- Premium-Market Size & Forecast 2018-2028F, Unit Sold (Thousand)
- By Rim Size
- Up to 12” -Market Size & Forecast 2018-2028F, Units Sold (Thousand Units)
- 12.1” to 15” -Market Size & Forecast 2018-2028F, Units Sold (Thousand Units)
- 15.1” to 18” -Market Size & Forecast 2018-2028F, Units Sold (Thousand Units)
- 18.1” to 20” -Market Size & Forecast 2018-2028F, Units Sold (Thousand Units)
- 20.1” to 26” -Market Size & Forecast 2018-2028F, Units Sold (Thousand Units)
- 26.1” to 35” -Market Size & Forecast 2018-2028F, Units Sold (Thousand Units)
- 35.1” to 47” -Market Size & Forecast 2018-2028F, Units Sold (Thousand Units)
- Above 47”-Market Size & Forecast 2018-2028F, Units Sold (Thousand Units)
- By Region
- East
- West
- South
- By Company
- Competition Characteristics
- Market Share & Analysis
- By Vehicle Type
- Market Size & Analysis
- Namibia Passenger Car Tire Market Outlook, 2018-2028F
- Market Size & Analysis
- By Revenues (USD Million)
- By Units Sold (Thousand Units)
- Market Share & Analysis
- By Type
- SUV- Market Size & Forecast 2018-2028F, Units Sold (Thousand Units)
- Sedan- Market Size & Forecast 2018-2028F, Units Sold (Thousand Units)
- Hatchback- Market Size & Forecast 2018-2028F, Units Sold (Thousand Units)
- By Demand Type- Market Size & Forecast 2018-2028F, Units Sold (Thousand Units)
- By Tire Type-Market Size & Forecast 2018-2028F, Units Sold (Thousand Units)
- By Sales Channel, Market Size & Forecast 2018-2028F, Units Sold (Thousand Units)
- By Price Category-Market Size & Forecast 2018-2028F, Units Sold (Thousand Units)
- By Rim Size-Market Size & Forecast 2018-2028F, Units Sold (Thousand Units)
- Up to 12” -Market Size & Forecast 2018-2028F, Units Sold (Thousand Units)
- 12.1” to 15” -Market Size & Forecast 2018-2028F, Units Sold (Thousand Units)
- 15.1.” to 18” -Market Size & Forecast 2018-2028F, Units Sold (Thousand Units)
- By Region-Market Size & Forecast 2018-2028F, Units Sold (Thousand Units)
- By Type
- Market Size & Analysis
- Namibia Light Commercial Vehicle Tire Market Outlook, 2018-2028F
- Market Size & Analysis
- By Revenues (USD Million)
- By Units Sold (Thousand Units)
- Market Share & Analysis
- By Type
- Light Trucks-Market Size & Forecast 2018-2028F, Units Sold (Thousand Units)
- Light Buses-Market Size & Forecast 2018-2028F, Units Sold (Thousand Units)
- Pickup trucks & Vans-Market Size & Forecast 2018-2028F, Units Sold (Thousand Units)
- By Demand Type- Market Size & Forecast 2018-2028F, Units Sold (Thousand Units)
- By Tire Type-Market Size & Forecast 2018-2028F, Units Sold (Thousand Units)
- By Sales Channel, Market Size & Forecast 2018-2028F, Units Sold (Thousand Units)
- By Price Category-Market Size & Forecast 2018-2028F, Units Sold (Thousand Units)
- By Rim Size-Market Size & Forecast 2018-2028F, Units Sold (Thousand Units)
- Up to 15” -Market Size & Forecast 2018-2028F, Units Sold (Thousand Units)
- 15.1” to 16” -Market Size & Forecast 2018-2028F, Units Sold (Thousand Units)
- Above 16” -Market Size & Forecast 2018-2028F, Units Sold (Thousand Units)
- By Region-Market Size & Forecast 2018-2028F, Units Sold (Thousand Units)
- By Type
- Market Size & Analysis
- Namibia Medium & Heavy Commercial Vehicle Tire Market Outlook, 2018-2028F
- Market Size & Analysis
- By Revenues (USD Million)
- By Units Sold (Thousand Units)
- Market Share & Analysis
- By Type
- Bus- Market Size & Forecast 2018-2028F, Units Sold (Thousand Units)
- Truck- Market Size & Forecast 2018-2028F, Units Sold (Thousand Units)
- By Demand Type- Market Size & Forecast 2018-2028F, Units Sold (Thousand Units)
- By Tire Type-Market Size & Forecast 2018-2028F, Units Sold (Thousand Units)
- By Sales Channel, Market Size & Forecast 2018-2028F, Units Sold (Thousand Units)
- By Price Category-Market Size & Forecast 2018-2028F, Units Sold (Thousand Units)
- By Rim Size-Market Size & Forecast 2018-2028F, Units Sold (Thousand Units)
- Up to 20”
- 20.1” to 22.5”
- 22.6” to 26”
- By Region-Market Size & Forecast 2018-2028F, Units Sold (Thousand Units)
- By Type
- Market Size & Analysis
- Namibia OTR Vehicle Tire Market Outlook, 2018-2028F
- Market Size & Analysis
- By Revenues (USD Million)
- By Units Sold (Thousand Units)
- Market Share & Analysis
- By Type
- Earth Moving Equipment
- Material Handling Equipment
- Agricultural Equipment
- By Demand Type- Market Size & Forecast 2018-2028F, Units Sold (Thousand Units)
- By Tire Type-Market Size & Forecast 2018-2028F, Units Sold (Thousand Units)
- By Sales Channel, Market Size & Forecast 2018-2028F, Units Sold (Thousand Units)
- By Price Category-Market Size & Forecast 2018-2028F, Units Sold (Thousand Units)
- By Rim Size-Market Size & Forecast 2018-2028F, Units Sold (Thousand Units)
- Up to 12”
- 12.1” to 15”
- 15.1.” to 18”
- 18.1” to 20”
- 20.1” to 26”
- 26.1” to 35”
- 35.1” to 47”
- Above 47”
- By Region-Market Size & Forecast 2018-2028F, Units Sold (Thousand Units)
- By Type
- Market Size & Analysis
- Namibia Two Wheeler Tire Market Outlook, 2018-2028F
- Market Size & Analysis
- By Revenues (USD Million)
- By Units Sold (Thousand Units)
- Market Share & Analysis
- By Type
- Mopeds- Market Size & Forecast 2018-2028F, Units Sold (Thousand Units)
- Scooters- Market Size & Forecast 2018-2028F, Units Sold (Thousand Units)
- Motorcycle- Market Size & Forecast 2018-2028F, Units Sold (Thousand Units)
- By Demand Type- Market Size & Forecast 2018-2028F, Units Sold (Thousand Units)
- By Tire Type-Market Size & Forecast 2018-2028F, Units Sold (Thousand Units)
- By Sales Channel, Market Size & Forecast 2018-2028F, Units Sold (Thousand Units)
- By Price Category-Market Size & Forecast 2018-2028F, Units Sold (Thousand Units)
- By Rim Size-Market Size & Forecast 2018-2028F, Units Sold (Thousand Units)
- Up to 12”- Market Size & Forecast 2018-2028F, Units Sold (Thousand Units)
- 12.1” to 15”- Market Size & Forecast 2018-2028F, Units Sold (Thousand Units)
- 15.1.” to 18”- Market Size & Forecast 2018-2028F, Units Sold (Thousand Units)
- By Region-Market Size & Forecast 2018-2028F, Units Sold (Thousand Units)
- By Type
- Market Size & Analysis
- Namibia Tire Market Key Strategic Imperatives for Success & Growth
- Competition Outlook
- Company Profiles
- Pirelli Tire
- Business Description
- Product Portfolio
- Strategic Alliances or Partnerships
- Recent Developments
- Financial Details
- Others
- Bridgestone Tires
- Business Description
- Product Portfolio
- Strategic Alliances or Partnerships
- Recent Developments
- Financial Details
- Others
- Sumitomo Rubber
- Business Description
- Product Portfolio
- Strategic Alliances or Partnerships
- Recent Developments
- Financial Details
- Others
- Continental Tires
- Business Description
- Product Portfolio
- Strategic Alliances or Partnerships
- Recent Developments
- Financial Details
- Others
- Goodyear Tires
- Business Description
- Product Portfolio
- Strategic Alliances or Partnerships
- Recent Developments
- Financial Details
- Others
- Michelin
- Business Description
- Product Portfolio
- Strategic Alliances or Partnerships
- Recent Developments
- Financial Details
- Others
- CST Tires
- Business Description
- Product Portfolio
- Strategic Alliances or Partnerships
- Recent Developments
- Financial Details
- Others
- Dunlop
- Business Description
- Product Portfolio
- Strategic Alliances or Partnerships
- Recent Developments
- Financial Details
- Others
- Yokohama
- Business Description
- Product Portfolio
- Strategic Alliances or Partnerships
- Recent Developments
- Financial Details
- Others
- Hankook
- Business Description
- Product Portfolio
- Strategic Alliances or Partnerships
- Recent Developments
- Financial Details
- Others
- Cooper
- Business Description
- Product Portfolio
- Strategic Alliances or Partnerships
- Recent Developments
- Financial Details
- Others
- Others
- Pirelli Tire
- Company Profiles
- Disclaimer
MarkNtel Advisors follows a robust and iterative research methodology designed to ensure maximum accuracy and minimize deviation in market estimates and forecasts. Our approach combines both bottom-up and top-down techniques to effectively segment and quantify various aspects of the market. A consistent feature across all our research reports is data triangulation, which examines the market from three distinct perspectives to validate findings. Key components of our research process include:
1. Scope & Research Design At the outset, MarkNtel Advisors define the research objectives and formulate pertinent questions. This phase involves determining the type of research—qualitative or quantitative—and designing a methodology that outlines data collection methods, target demographics, and analytical tools. They also establish timelines and budgets to ensure the research aligns with client goals.
2. Sample Selection and Data Collection In this stage, the firm identifies the target audience and determines the appropriate sample size to ensure representativeness. They employ various sampling methods, such as random or stratified sampling, based on the research objectives. Data collection is carried out using tools like surveys, interviews, and observations, ensuring the gathered data is reliable and relevant.
3. Data Analysis and Validation Once data is collected, MarkNtel Advisors undertake a rigorous analysis process. This includes cleaning the data to remove inconsistencies, employing statistical software for quantitative analysis, and thematic analysis for qualitative data. Validation steps are taken to ensure the accuracy and reliability of the findings, minimizing biases and errors.

4. Data Forecast and FinalizationThe final phase involves forecasting future market trends based on the analyzed data. MarkNtel Advisors utilize predictive modeling and time series analysis to anticipate market behaviors. The insights are then compiled into comprehensive reports, featuring visual aids like charts and graphs, and include strategic recommendations to inform client decision-making
FILL THE FORM TO GET THE FREE SAMPLE PAGES
We offer flexible licensing options to cater to varying organizational needs. Choose the pricing pack that best suits your requirements:
Buy Now