

By Product Type (Grocery & Staples, Snacks & Beverages, Fresh Produce & Dairy, Personal Care & OTC Pharma, Home & Cleaning Supplies, Electronics & Accessories, Pet Care, Flowers & Gifts, Others), By D... ... Gifts, Others), By Delivery Time Promise (Under 10 Minutes, 11–30 Minutes, 31–60 Minutes), By Platform Type (Mobile App-Based Platforms, Web-Based Platforms), By End-User (Urban Population, Suburban & Rural, Corporate & Institutional), and others Read more
- FMCG
- Jul 2026
- 140
- PDF, Excel, PPT
India Quick Commerce Market Report Key Takeaways:
- India Quick Commerce Market size was valued at around USD 5.6 billion in 2025 and is projected to grow from USD 5.8 billion in 2026 to USD 87.5 billion by 2032.
- The market is exhibiting a CAGR of 56.9% during the forecast period.
- By product type, grocery & staples held 61% of the Industry in 2026.
- By delivery time promise, the under-10-minute segment captured 62% of the market share in 2026.
- Leading companies hold a significant market and constitute a market share of 80% in 2026.
India Quick Commerce Market Size & Outlook
The quick commerce industry in India was valued at USD 5.6 billion in 2025 and is currently standing at USD 5.8 billion in 2026. The industry is projected to grow to USD 87.5 billion by 2032, showcasing a CAGR of around 56.9% during the forecast period, i.e., 2026–32.
The industry is rapidly transforming India's retail ecosystem by enabling ultra-fast delivery of groceries, daily essentials, and an expanding assortment of beauty, personal care, consumer electronics, and pharmacy products through hyperlocal dark store networks. Rising urbanization, increasing smartphone penetration, and widespread digital payment adoption continue to reshape consumer purchasing behaviour, driving higher reliance on instant delivery services. Reflecting this structural shift, quick commerce accounted for nearly 17% of India's e-commerce gross merchandise value (GMV) in July 2026, highlighting its growing importance within the country's broader digital retail landscape.
To address this accelerating demand, leading market participants are significantly expanding their fulfilment infrastructure to improve delivery density, shorten fulfilment radii, and strengthen their presence across additional urban centres. Blinkit operated 2,243 dark stores as of March 2026, while Swiggy Instamart and Zepto had each expanded their networks to more than 1,000 locations. These capacity additions, combined with improving operating efficiencies and strong order volumes, continue to strengthen service quality and support higher fulfilment scale across India's major metropolitan markets.
At the same time, the regulatory landscape is evolving to support more structured industry growth. India's four labour codes became effective in November 2025, with the Code on Social Security formally recognizing gig workers, representing an important step toward strengthening workforce protection within the platform economy. In parallel, the preliminary inquiry initiated by the Competition Commission of India into quick commerce companies during 2025 reflects increasing regulatory oversight aimed at promoting fair competition and market transparency. Together, these developments are expected to foster a more stable operating environment, enhance investor confidence, and support the industry's long-term sustainable growth.
India Quick Commerce Market Key Indicators
- UPI processed USD 313 billion across 23.2 billion transactions in May 2026, enabling seamless, real-time digital payments for low-value purchases. The expanding digital payments ecosystem supports higher transaction frequency, improves customer convenience, and strengthens adoption of quick commerce services.
- India recorded 1.03 billion internet subscribers as of December 2025, providing a large and expanding digital consumer base. Rising internet penetration enhances access to app-based retail platforms, supporting customer acquisition and geographical expansion for quick commerce operators.
- Blinkit's network expanded to 2,243 dark stores by March 2026, enabling wider geographic coverage and faster order fulfilment. Increasing dark store density improves delivery efficiency, supports category expansion, and strengthens the operational foundation for sustained market growth.
- Zepto secured USD 450 million in October 2025, highlighting strong institutional confidence in India's quick commerce sector. Continued capital inflows support infrastructure expansion, technology investments, and accelerated market penetration across additional urban locations.
India Quick Commerce Market Scope
| Category | Segments |
|---|---|
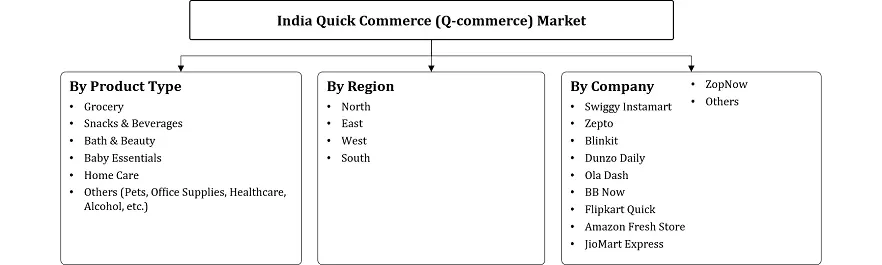
| By Product Type | Grocery & Staples, Snacks & Beverages, Fresh Produce & Dairy, Personal Care & OTC Pharma, Home & Cleaning Supplies, Electronics & Accessories, Pet Care, Flowers & Gifts, Others |
| By Delivery Time Promise | Under 10 Minutes, 11–30 Minutes, 31–60 Minutes |
| By Platform Type | Mobile App-Based Platforms, Web-Based Platforms |
| By End-User | Urban Population, Suburban & Rural, Corporate & Institutional |
India Quick Commerce Market Growth Drivers
Rising Gen Z and Millennial Preference for Convenience Led Urban Consumption
Changing consumption patterns among Gen Z and millennial consumers are emerging as a primary growth driver for the quick commerce industry in India. Urban lifestyles, rising smartphone usage, and increasing preference for digital shopping are accelerating the adoption of quick commerce platforms for groceries, personal care, beauty products, electronics, and other daily essentials. As purchasing behaviour shifts toward on demand fulfilment, platforms continue expanding product assortments to serve evolving consumer expectations.
The influence of younger consumers is increasingly evident in platform performance. Flipkart Minutes reported in 2026 that Gen Z accounted for more than 40% of its customer base, with demand expanding across daily essentials, beauty, electronics, and wellness categories, while overall order volumes increased fivefold year on year. These consumption patterns indicate growing acceptance of quick commerce beyond emergency grocery purchases.
As Gen Z and millennial consumers increasingly use quick commerce for routine and discretionary purchases, platforms are expanding fulfilment networks, increasing product availability, and improving service frequency to meet evolving demand.
Reflecting this demand outlook, Swiggy raised USD 1.13 billion from institutional investors in late 2025 to expand Instamart's dark store network, while Flipkart crossed 800 dark stores in April 2026 and targeted a doubling of its network by year's end. These investments demonstrate how rising consumer demand is accelerating capacity expansion and reinforcing long-term growth across the quick commerce industry in India.
- Market Segmentation
- Introduction
- Product Definition
- Research Process
- Assumptions
- Executive Summary
- India Quick Commerce Consumer Behaviour Analysis
- Buyer’s Profile
- Age
- Sex
- State of Domicile
- Income Group
- Profession
- Willingness to Opt Quick Commerce
- Reasons to Opt Quick Commerce
- Region-wise Penetration
- Most Preferred Products to Buy
- Products Customers Willing to Buy via Quick Commerce in Next Couple of Years
- Expectations from the Quick Commerce Companies
- Buyer’s Profile
- India Quick Commerce Market Policies, Regulations, and Product Standards
- India Quick Commerce Market Trends & Developments
- India Quick Commerce Market Dynamics
- Growth Factors
- Challenges
- India Quick Commerce Market Hotspot & Opportunities
- India Quick Commerce Market Start-up Ecosystem
- Entrepreneurial Activity
- Year-on-Year Funding Received
- Funding Received by Top Companies
- Key Investors Active in the Market
- Series-Wise Funding Received
- Seed Funding
- Angel Investing
- Venture Capitalists (VC) Funding
- Others
- India Quick Commerce Market Framework, 2023
- Total Addressable Market (TAM)
- Service Obtainable Market (SAM)
- Serviceable Available Market (SOM)
- India Quick Commerce Market Outlook, 2022-2032F
- Market Size & Outlook
- By Revenues (USD Million)
- Market Segmentation & Outlook
- By Product Type- Market Size & Forecast 2022-2032, USD Million
- Grocery & Staples
- Snacks & Beverages
- Fresh Produce & Dairy
- Personal Care & OTC Pharma
- Home & Cleaning Supplies
- Electronics & Accessories
- Pet Care
- Flowers & Gifts
- Others
- By Delivery Time Promise- Market Size & Forecast 2022-2032, USD Million
- Under 10 Minutes
- 11–30 Minutes
- 31–60 Minutes
- By Platform Type- Market Size & Forecast 2022-2032, USD Million- Market Size & Forecast 2022-2032, USD Million
- Mobile App-Based Platforms
- Web-Based Platforms
- By End-User- Market Size & Forecast 2022-2032, USD Million- Market Size & Forecast 2022-2032, USD Million
- Urban Population
- Suburban & Rural
- Corporate & Institutional
- By Region- Market Size & Forecast 2022-2032, USD Million
- North
- East
- West
- South
- By Company
- Competition Characteristics
- Market Share & Analysis
- By Product Type- Market Size & Forecast 2022-2032, USD Million
- Market Size & Outlook
- North India Quick Commerce Market Outlook, 2022-2032
- Market Size & Outlook
- By Revenues (USD Million)
- Market Segmentation & Outlook
- By Product Type-Market Size & Forecast 2022-2032, USD Million
- By Delivery Time Promise- Market Size & Forecast 2022-2032, USD Million
- By Platform Type- Market Size & Forecast 2022-2032, USD Million- Market Size & Forecast 2022-2032, USD Million
- By End-User- Market Size & Forecast 2022-2032, USD Million- Market Size & Forecast 2022-2032, USD Million
- By Region- Market Size & Forecast 2022-2032, USD Million
- Market Size & Outlook
- South India Quick Commerce Market Outlook, 2022-2032
- Market Size & Outlook
- By Revenues (USD Million)
- Market Segmentation & Outlook
- By Product Type-Market Size & Forecast 2022-2032, USD Million
- By Delivery Time Promise- Market Size & Forecast 2022-2032, USD Million
- By Platform Type- Market Size & Forecast 2022-2032, USD Million- Market Size & Forecast 2022-2032, USD Million
- By End-User- Market Size & Forecast 2022-2032, USD Million- Market Size & Forecast 2022-2032, USD Million
- By Region- Market Size & Forecast 2022-2032, USD Million
- Market Size & Outlook
- North India Quick Commerce Market Outlook, 2022-2032
- Market Size & Outlook
- By Revenues (USD Million)
- Market Segmentation & Outlook
- By Product Type-Market Size & Forecast 2022-2032, USD Million
- By Delivery Time Promise- Market Size & Forecast 2022-2032, USD Million
- By Platform Type- Market Size & Forecast 2022-2032, USD Million- Market Size & Forecast 2022-2032, USD Million
- By End-User- Market Size & Forecast 2022-2032, USD Million- Market Size & Forecast 2022-2032, USD Million
- By Region- Market Size & Forecast 2022-2032, USD Million
- Market Size & Outlook
- East India Quick Commerce Market Outlook, 2022-2032
- Market Size & Outlook
- By Revenues (USD Million)
- Market Segmentation & Outlook
- By Product Type-Market Size & Forecast 2022-2032, USD Million
- By Delivery Time Promise- Market Size & Forecast 2022-2032, USD Million
- By Business- Market Size & Forecast 2022-2032, USD Million
- By Platform Type- Market Size & Forecast 2022-2032, USD Million- Market Size & Forecast 2022-2032, USD Million
- By End-User- Market Size & Forecast 2022-2032, USD Million- Market Size & Forecast 2022-2032, USD Million
- By Region- Market Size & Forecast 2022-2032, USD Million
- Market Size & Outlook
- India Quick Commerce Market Key Strategic Imperatives for Success & Growth
- Competitive Outlook
- Company Profiles
- Eternal Ltd. (Blinkit)
- Business Description
- Product Portfolio
- Collaborations & Alliances
- Recent Developments
- Financial Details
- Others
- Swiggy Limited (Instamart)
- Business Description
- Product Portfolio
- Collaborations & Alliances
- Recent Developments
- Financial Details
- Others
- Zepto Marketplace Pvt Ltd.
- Business Description
- Product Portfolio
- Collaborations & Alliances
- Recent Developments
- Financial Details
- Others
- Tata Digital Ltd. (Big Basket Now)
- Business Description
- Product Portfolio
- Collaborations & Alliances
- Recent Developments
- Financial Details
- Others
- Wallmart Inc. (Flipkart Minutes)
- Business Description
- Product Portfolio
- Collaborations & Alliances
- Recent Developments
- Financial Details
- Others
- Amazon.com Inc. (Amazon Now)
- Business Description
- Product Portfolio
- Collaborations & Alliances
- Recent Developments
- Financial Details
- Others
- Reliance Industries Ltd. (Jio Mart Express)
- Business Description
- Product Portfolio
- Collaborations & Alliances
- Recent Developments
- Financial Details
- Others
- FreshToHome Foods Private Limited
- Business Description
- Product Portfolio
- Collaborations & Alliances
- Recent Developments
- Financial Details
- Others
- Delightful Gourmet Private Limited (Licious)
- Business Description
- Product Portfolio
- Collaborations & Alliances
- Recent Developments
- Financial Details
- Others
- Innovative Retail Concepts Private Limited (Nature's Basket)
- Business Description
- Product Portfolio
- Collaborations & Alliances
- Recent Developments
- Financial Details
- Others
- Eternal Ltd. (Blinkit)
- Company Profiles
- Disclaimer
MarkNtel Advisors follows a robust and iterative research methodology designed to ensure maximum accuracy and minimize deviation in market estimates and forecasts. Our approach combines both bottom-up and top-down techniques to effectively segment and quantify various aspects of the market. A consistent feature across all our research reports is data triangulation, which examines the market from three distinct perspectives to validate findings. Key components of our research process include:
1. Scope & Research Design At the outset, MarkNtel Advisors define the research objectives and formulate pertinent questions. This phase involves determining the type of research—qualitative or quantitative—and designing a methodology that outlines data collection methods, target demographics, and analytical tools. They also establish timelines and budgets to ensure the research aligns with client goals.
2. Sample Selection and Data Collection In this stage, the firm identifies the target audience and determines the appropriate sample size to ensure representativeness. They employ various sampling methods, such as random or stratified sampling, based on the research objectives. Data collection is carried out using tools like surveys, interviews, and observations, ensuring the gathered data is reliable and relevant.
3. Data Analysis and Validation Once data is collected, MarkNtel Advisors undertake a rigorous analysis process. This includes cleaning the data to remove inconsistencies, employing statistical software for quantitative analysis, and thematic analysis for qualitative data. Validation steps are taken to ensure the accuracy and reliability of the findings, minimizing biases and errors.

4. Data Forecast and FinalizationThe final phase involves forecasting future market trends based on the analyzed data. MarkNtel Advisors utilize predictive modeling and time series analysis to anticipate market behaviors. The insights are then compiled into comprehensive reports, featuring visual aids like charts and graphs, and include strategic recommendations to inform client decision-making
We’d love to understand what matters most to you.