
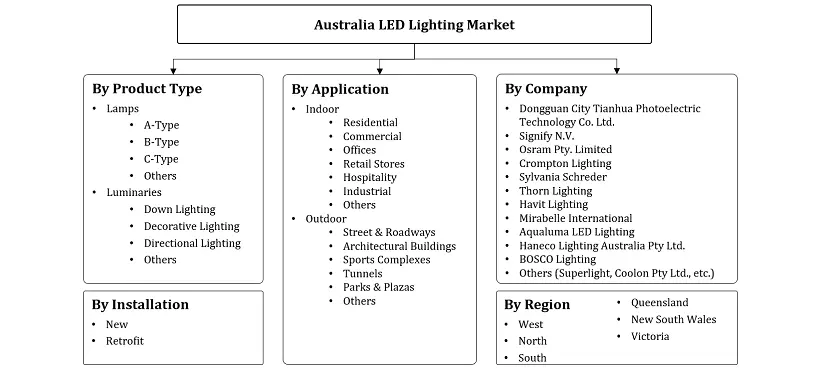
Australia LED Lighting Market - By Product Type (Lamps, Luminaires), By Application (Indoor, Outdoor), By Installation (New, Retrofit), By Sales Channel (Indirect Sales, Direct Sales) and others ... es) and others Read more
- FMCG
- Mar 2024
- 128
- PDF, Excel, PPT
Market Insights & Analysis: Australia LED Lighting Market (2024-30):
The Australia LED Lighting Market size is estimated to grow at a CAGR of around 4.1% during the forecast period, i.e., 2024-30. With a growing emphasis on energy efficiency, low costs, durability, and sustainability, coupled with government initiatives promoting LED adoption, the market has witnessed significant growth. Australia's commitment to reducing carbon emissions and transitioning towards renewable energy sources has driven widespread adoption of LED lighting solutions across residential, commercial, and industrial sectors.
Additionally, the country's stringent energy efficiency standards and regulations have further propelled the shift towards LED technology. Technological advancements in LED chips, coupled with declining costs and improved performance, have boosted market penetration. However, challenges such as price competitiveness, concerns regarding product quality & durability, and the need for infrastructure upgrades may hinder market growth.
| Report Coverage | Details |
|---|---|
| Study Period | Historical Data: 2019-22 |
| Base Year: 2023 | |
| Forecast Period: 2024-30 | |
| CAGR (2024-30) | 4.1% |
| Region Covered | West, North, South, Queensland, New South Wales, Victoria |
| Key Companies Profiled | Dongguan City Tianhua Photoelectric Technology Co. Ltd., Signify N.V., Osram Pty. Limited, Crompton Lighting, Sylvania Schreder, Thorn Lighting, Havit Lighting, Mirabelle International, Aqualuma LED Lighting, Haneco Lighting Australia Pty Ltd., BOSCO Lighting, Others |
| Unit Denominations | USD Million/Billion |
Overall, the Australia LED Lighting Market offers substantial opportunities for manufacturers, suppliers, and stakeholders to capitalize on the growing demand for energy-efficient lighting solutions amidst increasing environmental consciousness and regulatory support.
Australia LED Lighting Market Driver:
Elimination of Incandescent Lighting to Drive the Demand for LED Lighting in Australia – Australia's pioneering move to eliminate incandescent lighting underscores its commitment to energy efficiency & sustainability, positioning the nation as a leader in adopting LED technology. The widespread penetration of LED lighting products in Australia is driven by several factors, including stringent energy efficiency regulations, government incentives, and technological advancements.
With the ban on incandescent bulbs, consumers & businesses have increasingly turned to LED lighting solutions due to their superior energy efficiency, longer lifespan, and environmental benefits. LED lighting continues to gain traction across residential, commercial, and industrial sectors, supported by ongoing infrastructure upgrades & innovative product developments, the Australian LED Lighting Market experiences sustained growth. This penetration not only addresses energy conservation goals but also fosters economic benefits through reduced electricity consumption & maintenance costs, further driving the widespread adoption of LED lighting solutions nationwide.
- Market Segmentation
- Introduction
- Market Definition
- Research Process
- Assumptions
- Executive Summary
- Australia LED Lights Market PESTLE Analysis
- Australia LED Lights Market Trends & Insights
- Australia LED Lights Market Dynamics
- Growth Drivers
- Challenges
- Australia LED Lights Market Value Chain and Margin Analysis
- Australia LED Lights Market Pricing Analysis, 2024
- Comparative Price Points, By Company
- YoY Product Wise Price Trends
- Forecast- Average Price
- Australia LED Lights Market Hotspots & Opportunities
- Australia LED Lights Market Outlook, 2019-2030F
- Market Size & Analysis
- By Revenues (USD Million)
- Market Share & Analysis
- By Product Type
- Lamps- (Market Size & Forecast 2019-2030, (USD Million)
- A-Type- (Market Size & Forecast 2019-2030, (USD Million)
- B-Type- (Market Size & Forecast 2019-2030, (USD Million)
- C-Type- (Market Size & Forecast 2019-2030, (USD Million)
- Others- (Market Size & Forecast 2019-2030, (USD Million)
- Luminaires- (Market Size & Forecast 2019-2030, (USD Million)
- Down Lighting- (Market Size & Forecast 2019-2030, (USD Million)
- Decorative Lighting- (Market Size & Forecast 2019-2030, (USD Million)
- Directional Lighting- (Market Size & Forecast 2019-2030, (USD Million)
- Others- (Market Size & Forecast 2019-2030, (USD Million)
- Lamps- (Market Size & Forecast 2019-2030, (USD Million)
- By Application
- Indoor- (Market Size & Forecast 2019-2030, (USD Million)
- Residential- (Market Size & Forecast 2019-2030, (USD Million)
- Commercial- (Market Size & Forecast 2019-2030, (USD Million)
- Offices- (Market Size & Forecast 2019-2030, (USD Million)
- Retail Stores- (Market Size & Forecast 2019-2030, (USD Million)
- Hospitality- (Market Size & Forecast 2019-2030, (USD Million)
- Others- (Market Size & Forecast 2019-2030, (USD Million)
- Industrial- (Market Size & Forecast 2019-2030, (USD Million)
- Others- (Market Size & Forecast 2019-2030, (USD Million)
- Outdoor- (Market Size & Forecast 2019-2030, (USD Million)
- Streets and Roadways- (Market Size & Forecast 2019-2030, (USD Million)
- Architectural Buildings- (Market Size & Forecast 2019-2030, (USD Million)
- Sports Complexes- (Market Size & Forecast 2019-2030, (USD Million)
- Tunnels- (Market Size & Forecast 2019-2030, (USD Million)
- Parks & Plazas- (Market Size & Forecast 2019-2030, (USD Million)
- Others- (Market Size & Forecast 2019-2030, (USD Million)
- Indoor- (Market Size & Forecast 2019-2030, (USD Million)
- By Installation
- New- (Market Size & Forecast 2019-2030, (USD Million)
- Retrofit- (Market Size & Forecast 2019-2030, (USD Million)
- By Sales Channel
- Indirect Sales- (Market Size & Forecast 2019-2030, (USD Million)
- Dealers & Distributors- (Market Size & Forecast 2019-2030, (USD Million)
- Retail Stores- (Market Size & Forecast 2019-2030, (USD Million)
- Direct Sales- (Market Size & Forecast 2019-2030, (USD Million)
- Indirect Sales- (Market Size & Forecast 2019-2030, (USD Million)
- By Region
- West
- North
- South
- Queensland
- New South Wales
- Victoria
- By Company
- Competition Characteristics
- Market Share of Leading Companies
- By Product Type
- Market Size & Analysis
- Australia Indoor LED Lights Market Outlook, 2019-2030F
- Market Size & Analysis
- By Revenues (USD Million)
- Market Share & Analysis
- By Product Type- (Market Size & Forecast 2019-2030, (USD Million)
- By Installation- (Market Size & Forecast 2019-2030, (USD Million)
- By Sales Channel- (Market Size & Forecast 2019-2030, (USD Million)
- Market Size & Analysis
- Australia Outdoor LED Lights Market Outlook, 2019-2030F
- Market Size & Analysis
- By Revenues (USD Million)
- Market Share & Analysis
- By Product Type- (Market Size & Forecast 2019-2030, (USD Million)
- By Installation- (Market Size & Forecast 2019-2030, (USD Million)
- By Sales Channel- (Market Size & Forecast 2019-2030, (USD Million)
- Market Size & Analysis
- Australia LED Lights Market Key Strategic Imperatives for Growth & Success
- Competition Outlook
- Company Profiles
- Dongguan City Tianhua Photoelectric Technology Co. Ltd.
- Business Description
- Product Segments
- Strategic Alliances or Partnerships
- Recent Developments
- Financial Details
- Others
- Signify N.V.
- Business Description
- Product Segments
- Strategic Alliances or Partnerships
- Recent Developments
- Financial Details
- Others
- Osram Pty. Limited
- Business Description
- Product Segments
- Strategic Alliances or Partnerships
- Recent Developments
- Financial Details
- Others
- Crompton Lighting
- Business Description
- Product Segments
- Strategic Alliances or Partnerships
- Recent Developments
- Financial Details
- Others
- Sylvania Schreder
- Business Description
- Product Segments
- Strategic Alliances or Partnerships
- Recent Developments
- Financial Details
- Others
- Thorn Lighting
- Business Description
- Product Segments
- Strategic Alliances or Partnerships
- Recent Developments
- Financial Details
- Others
- Havit Lighting
- Business Description
- Product Segments
- Strategic Alliances or Partnerships
- Recent Developments
- Financial Details
- Others
- Mirabelle International
- Business Description
- Product Segments
- Strategic Alliances or Partnerships
- Recent Developments
- Financial Details
- Others
- Aqualuma LED Lighting
- Business Description
- Product Segments
- Strategic Alliances or Partnerships
- Recent Developments
- Financial Details
- Others
- Haneco Lighting Australia Pty Ltd.
- Business Description
- Product Segments
- Strategic Alliances or Partnerships
- Recent Developments
- Financial Details
- Others
- BOSCO Lighting
- Business Description
- Product Segments
- Strategic Alliances or Partnerships
- Recent Developments
- Financial Details
- Others
- Others (Superlight, Coolon Pty Ltd., etc.)
- Business Description
- Product Segments
- Strategic Alliances or Partnerships
- Recent Developments
- Financial Details
- Others
- Dongguan City Tianhua Photoelectric Technology Co. Ltd.
- Company Profiles
- Disclaimer
MarkNtel Advisors follows a robust and iterative research methodology designed to ensure maximum accuracy and minimize deviation in market estimates and forecasts. Our approach combines both bottom-up and top-down techniques to effectively segment and quantify various aspects of the market. A consistent feature across all our research reports is data triangulation, which examines the market from three distinct perspectives to validate findings. Key components of our research process include:
1. Scope & Research Design At the outset, MarkNtel Advisors define the research objectives and formulate pertinent questions. This phase involves determining the type of research—qualitative or quantitative—and designing a methodology that outlines data collection methods, target demographics, and analytical tools. They also establish timelines and budgets to ensure the research aligns with client goals.
2. Sample Selection and Data Collection In this stage, the firm identifies the target audience and determines the appropriate sample size to ensure representativeness. They employ various sampling methods, such as random or stratified sampling, based on the research objectives. Data collection is carried out using tools like surveys, interviews, and observations, ensuring the gathered data is reliable and relevant.
3. Data Analysis and Validation Once data is collected, MarkNtel Advisors undertake a rigorous analysis process. This includes cleaning the data to remove inconsistencies, employing statistical software for quantitative analysis, and thematic analysis for qualitative data. Validation steps are taken to ensure the accuracy and reliability of the findings, minimizing biases and errors.

4. Data Forecast and FinalizationThe final phase involves forecasting future market trends based on the analyzed data. MarkNtel Advisors utilize predictive modeling and time series analysis to anticipate market behaviors. The insights are then compiled into comprehensive reports, featuring visual aids like charts and graphs, and include strategic recommendations to inform client decision-making
We’d love to understand what matters most to you.