

By Type (Diesel Generators, Gas Generators (Biogas, Natural Gas, Propane), Hybrid Generators, Renewable Fuel Generators (Biofuel, Hydrogen Fuel Cells, Solar-Powered Generators)), B......y Portability (Stationary, Portable), By Power Rating (Capacity) (Low Power — Less than 75 kVA, Medium Power — 75–375 kVA, High Power — Greater than 375 kVA), By End users (Agriculture, Commercial, Construction, Government & Public Sector, Healthcare, Hospitality, Industrial (Chemical & Petrochemical, Food & Beverage Processing, Manufacturing, Metal & Mining, Oil & Gas, Pharmaceuticals & Life Sciences), Residential, Telecommunications, Utilities & Power Plants), and others Read more
- Energy
- Sep 2026
- 380
- PDF, Excel, PPT
Power Generators Market Key Takeaways
- The global power generators market is valued at USD 35.21 billion in 2025, to 36.22 billion, and is expected to reach USD 56.21 billion by 2032, expanding at a 7.60% CAGR.
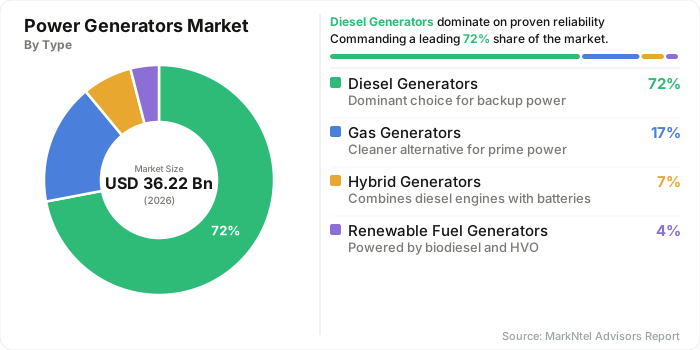
- By type, Diesel generators account for approximately 72% of the market.
- By end-user, the Industrial segment holds the largest share at 46%.
- Asia Pacific accounts for approximately 35% of the global market.
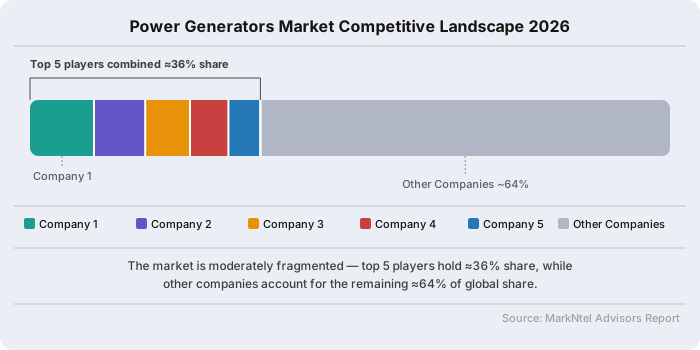
- The market is moderately concentrated, with the top five players collectively accounting for approximately 36%.
Power Generators Market Size and Outlook
The Power Generators Market was valued at USD 35.21 billion in 2025, is expected to reach USD 36.22 billion, and is projected to grow at a CAGR of 7.60%, reaching USD 56.21 billion by 2032. Growth is being driven by declining grid reliability and the rapid expansion of power-intensive facilities, particularly data centers, which are widening the gap between available utility supply and end-user power requirements.
In South Africa, Eskom's October 2025 Medium-Term System Adequacy Outlook indicated that generation shortages could bring back load shedding in 2029 and 2030, keeping standby generation important for commercial and industrial users.
Commercial and industrial users are increasingly treating backup generation as part of their core power infrastructure rather than an emergency-only solution. India's Grade A office market recorded 61.4 million square feet of net absorption in 2025, while premium office buildings increasingly offer 100% power backup as a standard feature. In the Democratic Republic of Congo, a power deficit of more than 5,000 MW, including around 900 MW of mining demand, has pushed Ivanhoe's Kamoa-Kakula copper operation to use diesel backup to maintain new processing capacity.
The demand is also broadening across major economic and strategic country groups. In NATO countries, generator requirements are increasingly linked to defence facilities, critical infrastructure and resilience investments. NATO members agreed in 2025 to increase defence spending to 5% of GDP by 2035, including spending on critical infrastructure protection, civil preparedness and resilience. This creates additional requirements for reliable backup and mobile power at military bases, communication facilities, airports and other critical assets.
Demand is also expanding through large-scale onsite power projects. Caterpillar agreed in January 2026 to supply 2 GW of natural-gas generator sets to the Monarch Compute Campus in West Virginia, where onsite generation will reduce dependence on additional utility infrastructure. In Nigeria, around 42,000 telecom towers spend an estimated USD 524 million annually on diesel, while hybrid power adoption remained only about 20% in February 2026, underscoring the continued role of generators in telecom operations. Similarly, In the U.S. Permian Basin, ProPetro's ProPwr secured an 80 MW contract in 2025 to convert stranded associated gas into onsite power where grid connections remain limited.
Together, grid reliability challenges, data center expansion, industrial activity, telecom infrastructure, and remote power requirements are broadening generator demand across developed and emerging markets, supporting long-term demand for standby, prime-power, and onsite generation systems.
Power Generators Market Key Indicators
- Around 655 million people lacked electricity access in 2025, with ~85% concentrated in Sub-Saharan Africa. Unreliable grids directly increase reliance on standby and prime-power generators. Over the next five years, demand should remain strongest in grid-deficit markets, while mature economies generate mainly replacement demand. Sub-Saharan Africa, South Asia and Southeast Asia will be most impacted.
- Global manufacturing entered 2026 in expansion territory, although 2026 manufacturing output growth was estimated at ~2.6%. Industrial expansion increases electricity loads from machinery, processing and production lines, supporting prime and backup generators. Over five years, new-installation demand should concentrate in industrializing economies. China, India and Southeast Asia will remain the most exposed regions.
- Global data-center capacity is projected to nearly double from ~103 GW in 2025 to ~200 GW by 2030. High availability requirements make high-capacity gensets integral to backup architectures. Over five years, data-center expansion will remain the strongest structural driver for high-kVA generator demand and increasingly support gas and hybrid systems. North America, Europe, India and Southeast Asia will benefit most.
- China operated approximately 4.83 million 5G base stations by end-2025, increasing beyond 4.96 million by March 2026. Expanding tower networks create recurring power requirements, particularly at off-grid sites. Over five years, generator demand should remain steady but increasingly hybridized with solar and batteries. South Asia and Sub-Saharan Africa will remain most dependent on generator-based telecom power.
Power Generators Market Scope
| Category | Segments |
|---|---|
| By Type | Diesel Generators, Gas Generators (Biogas, Natural Gas, Propane), Hybrid Generators, Renewable Fuel Generators (Biofuel, Hydrogen Fuel Cells, Solar-Powered Generators |
| By Portability | Stationary, Portable |
| By Power Rating | Capacity) (Low Power — Less than 75 kVA, Medium Power — 75–375 kVA, High Power — Greater than 375 kVA |
| By End users | Agriculture, Commercial, Construction, Government & Public Sector, Healthcare, Hospitality, Industrial (Chemical & Petrochemical, Food & Beverage Processing, Manufacturing, Metal & Mining, Oil & Gas, Pharmaceuticals & Life Sciences), Residential, Telecommunications, Utilities & Power Plants |
Power Generators Market Growth Drivers
Rising Global Electricity Demand and the Need for Reliable Backup Power
The accelerating growth in global electricity consumption is creating a broader requirement for reliable and flexible power-generation capacity, supporting demand for power generators across commercial, industrial, infrastructure, and residential applications. According to the IEA, global electricity demand increased by around 3% in 2025 and is forecast to grow at an average 3.6% annually during 2026–2030, adding roughly 1,100 TWh of electricity demand each year. This growth is being driven by industrial expansion, electrification, air-conditioning, electric vehicles, and data centres.
For the power generators market, the significance is not limited to additional electricity generation. Rapidly growing loads are also increasing the need for backup and standby generation when grid supply is interrupted or insufficient, particularly for facilities where downtime can cause major operational or financial losses. Data centres are an important example; their electricity consumption increased by 17% in 2025, while AI-focused facilities are growing even faster. At the same time, industrial facilities, hospitals, telecommunications networks, commercial buildings, and critical infrastructure require continuous power availability as their dependence on electricity increases. This combination of higher electricity demand, expanding critical loads, and the need for power continuity is therefore encouraging investment in diesel, gas, dual-fuel, and hybrid generator systems worldwide.
Recent Trends
Increasing Adoption of Hybrid and Dual-Fuel Generator Technologies for Lower Emissions and Operating Costs
The power generators industry is increasingly shifting toward hybrid battery-generator and dual-fuel systems as end users seek to reduce fuel consumption and emissions without compromising the reliability and long-duration operation provided by conventional generators. In hybrid systems, batteries handle short-duration and low-load requirements, allowing the generator engine to operate less frequently and closer to its optimal loading range. For example, Atlas Copco launched its QHS Integrated Hybrid Generator range in March 2026, combining diesel engines, batteries, power electronics, and energy management in a single unit. The company reported that the systems can reduce fuel consumption and CO₂ emissions by up to 80% and engine runtime by more than 95% compared with conventional diesel-only operation.
The trend is also gaining importance in data centers and other mission-critical facilities, where batteries can manage rapid load fluctuations while generators provide longer-duration backup. A 2026 CIGRE study specifically examined diesel-generator and battery-storage hybrid power stations for AI-driven data centers, highlighting the need to manage highly dynamic power requirements while maintaining uninterrupted operation. Meanwhile, dual-fuel systems are gaining traction because they allow operators to switch between fuels such as diesel and natural gas, providing greater fuel flexibility and helping reduce operating costs and emissions. Thus, manufacturers are increasingly developing generator platforms that combine fuel flexibility, battery storage, and intelligent controls, making hybridization an important technology trend across the global power generators market.
Power Generators Market Opportunities and Challenges
Emission Regulations Reshaping the Generators Market Toward Hybrid and Low-Emission Power Solutions
A major challenge for the global power generators market is increasing regulatory pressure on diesel and fossil-fuel generator sets. In Europe, Stage V emission requirements are pushing manufacturers toward advanced engines and after-treatment technologies, increasing equipment complexity and compliance costs. In India, CPCB standards cover diesel, natural-gas, LPG, and dual-fuel gensets, requiring manufacturers to meet defined emission limits and certification requirements. In California, CARB regulations have also pushed stationary emergency engines toward lower-emission technologies and tighter operational requirements. These regulatory requirements increase engineering, certification, maintenance, and production costs, creating greater pressure on conventional generator manufacturers, particularly in price-sensitive emerging markets.
However, these regulatory pressures are creating opportunities for manufacturers to develop hybrid, dual-fuel, and battery-integrated generator systems that maintain reliable backup while reducing fuel consumption and emissions. In the U.S. Permian Basin, Aggreko deployed a 350 kW natural-gas generator with a 500 kW/250 kWh battery for an oil-and-gas operation, reducing generator runtime and fuel costs by 96%. Similarly, United Rentals used a 500-kW BESS-generator hybrid at a Kansas City data-center construction site, cutting generator runtime by 85%. These deployments demonstrate opportunities for suppliers to expand beyond conventional gensets into integrated generator-BESS systems, energy-management solutions, remote monitoring, and dual-fuel technologies, enabling customers to meet emissions requirements while retaining dependable power.
Segmentation Insights
Diesel Generators Maintain Dominance Across Major Power Markets
Diesel generators account for approximately 72% of the global power generators market, supported by their established use across industrial, commercial, infrastructure, and critical-power applications. In China, rising industrial electricity requirements are supporting demand for reliable onsite and backup power; industrial electricity consumption increased 6.4% in the first two months of 2026, while electricity use by high-tech and equipment manufacturing increased 10.6%, increasing the power requirements of factories and production facilities. In the U.S., diesel generators are increasingly used as critical backup infrastructure for data centers, with diesel-generator capacity serving U.S. data centers reaching an estimated 55 GW in 2024, compared with around 20 GW in previous years.
South Africa also demonstrates the continuing importance of diesel-based generation for power reliability. Eskom generated 1,078 GWh through diesel-fired OCGT plants during 2025–26, using them to support the electricity system during periods of supply constraints. In Nigeria, persistent dependence on self-generation among businesses has also sustained generator demand, with the country importing approximately USD 281 million of generator sets in 2024. These examples across major and emerging power markets demonstrate why high reliability, rapid start-up, and established fuel and servicing infrastructure continue to support the dominant position of diesel generators globally. By type of power generator, the market is further segmented into the following sub-categories:
- Diesel Generators
- Gas Generators
- Hybrid Generators
- Renewable Fuel Generators
Industrial Segment Leads as Capacity Expansion Drives Incremental Generator Demand
The Industrial segment is the leading end-user category with a market share of 46%, because its generator demand is primarily created by new production capacity, plant expansions and increasing electrical loads, rather than simply by the number of existing industrial facilities. In China, industrial electricity consumption increased 5.3% in January–June 2026, while high-tech and equipment manufacturing consumption rose 9.8%, reflecting the expansion of electricity-intensive manufacturing such as EVs, batteries, electronics and advanced equipment; new production lines add motors, automation, HVAC and other critical electrical loads that need backup during grid interruptions.
In India, government-supported food-processing projects had added 3.4 million tonnes/year of processing and preservation capacity across 274 approved project locations by February 2026, creating additional demand for electricity-intensive processing, refrigeration, pumping and packaging equipment and consequently increasing the need for backup generation.
In Malawi, mining-sector electricity demand is projected to reach approximately 140 MW over the next five years, driven by projects including Kasiya, Malingunde, Songwe Hill and Kayelekera, the remote location of such projects creates requirements for generators as both prime and backup power.
Similarly, Saudi Arabia's industrial production increased 8.7% in Q4 2025, with manufacturing output rising 5.6%, adding new electrical loads across industrial and processing facilities. Thus, industrial generator demand is being driven by the conversion of industrial investment into additional electrical loads—new factories, production lines, processing capacity and mines—which increases the amount of power that operators need to protect or supply onsite. By end user industry the market is further segmented into the following sub-categories:
- Agriculture
- Commercial
- Construction
- Government & Public Sector
- Healthcare
- Hospitality
- Industrial
- Oil & Gas
- Pharmaceuticals & Life Sciences
- Residential
- Telecommunications
- Utilities & Power Plants
Power Generators Market Geographical Analysis
Asia Pacific accounts for an estimated 35% of the global power generators market, making it the leading regional market, supported by the region’s large industrial base, rapid electricity-demand growth, data-center expansion and continued investment in power infrastructure. The region’s generator demand is particularly broad-based because the underlying requirement differs across its major economies. China is the largest source of incremental power demand, with the IEA expecting the country to contribute almost 70% of Asia Pacific’s additional electricity demand through 2030. China’s electricity demand is forecast to grow by 4.9% annually during 2026–2030, supported by industrial activity, EVs, data centers and continued electrification.
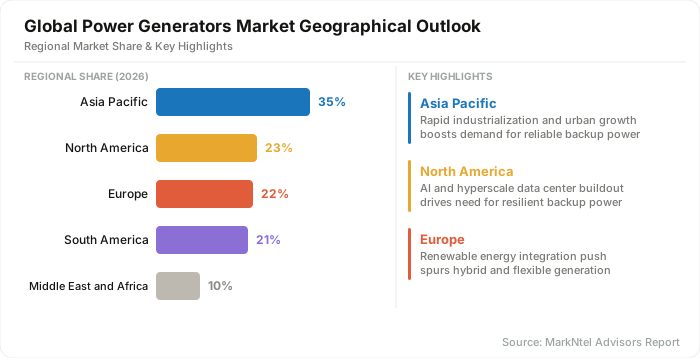
India is another major demand center, with electricity demand expected to increase by 6.4% annually through 2030; industry is expected to contribute around one-third of this increase, creating additional requirements for backup generation across manufacturing and infrastructure facilities. Meanwhile, Southeast Asia is forecast to record 5.3% annual electricity-demand growth, supported by economic expansion and rising electrification. Overall, Asia Pacific generated two-thirds of the global increase in electricity demand in 2025, while its electricity consumption is expected to reach 56% of global use by 2030, reinforcing the region’s importance for generator demand.
Power Generators Market Competitive Landscape
The global power generators market is moderately concentrated, with the top five players—Caterpillar, Cummins, Generac, Kohler, and Rolls-Royce—accounting for approximately 36% of the market. The remaining market is highly fragmented, comprising numerous regional manufacturers, specialized generator suppliers, rental power providers, and smaller local players.
Major Plyers in the power generators market
- Caterpillar Inc.
- Cummins Inc.
- Generac Holdings Inc.
- Kohler Co.
- Rolls-Royce Holdings plc
- Mitsubishi Heavy Industries Ltd.
- Wärtsilä Corporation
- Atlas Copco AB
- Yanmar Holdings Co., Ltd.
- Doosan Corporation
- AKSA Power Generation
- HIMOINSA S.L.
- Kirloskar Oil Engines Limited
- Mahindra Powerol
- Aggreko plc
Power Generators Market News and Recent Developments
2025: U.S. EPA Clarifies 50-Hour Rule for Emergency Generators
The EPA clarified that qualifying emergency engines can operate for up to 50 hours annually in non-emergency situations to support grid reliability under specified arrangements.
Impact: The clarification expands the potential commercial use of standby generators beyond outage protection, allowing qualifying facilities to participate in grid-support programs. This increases the economic value of installed generator capacity while creating differences in market opportunities depending on local balancing-authority arrangements and regulatory conditions.
2025: Rolls-Royce Launches Fast-Start mtu Gas Generator for Data Centers
Rolls-Royce introduced its 20V4000 mtu gas generator for the 60-Hz market, offering a 45-second fast-start capability from 2026. The system can operate using biogas and biomethane and is designed for future hydrogen use.
Impact: Faster start-up improves the competitiveness of gas generators in mission-critical applications traditionally dominated by diesel, while fuel flexibility supports data centers seeking lower-emission backup solutions and strengthens Rolls-Royce’s position in the North American market.
2026: Generac Acquires Belvidere Facility to Expand Large-Megawatt Generator Capacity
Generac acquired a manufacturing facility in Belvidere, Illinois, to expand packaging capacity for large-megawatt generators, with operations expected to begin in 2027 and more than 100 jobs planned. The move follows its acquisition of Enercon Engineering.
Impact: The investment increases Generac’s production capacity for large generator systems and strengthens its ability to respond to rising data-center demand, while greater vertical integration of enclosure and packaging capabilities can improve supply-chain flexibility and delivery efficiency.
2026: Cummins Signs Agreement with Circe Energy for West Texas AI Data Center
Cummins will supply natural-gas generator sets for Circe Energy’s behind-the-meter prime-power microgrid supporting its West Texas HPC data-center campus. Deliveries will run from 2026 to 2030 and include HSK78 and QSK60 platforms.
Impact: The agreement strengthens Cummins’ exposure to AI-driven data-center power demand while providing multi-year order visibility and supporting the growing adoption of natural-gas generation for grid-independent data-center operations.
- Market Segmentation
- Introduction
- Product Definition
- Research Process
- Assumptions
- Executive Summary
- Power Generators Market Policies, Regulations, and Product Standards
- Power Generators Market Trends & Developments
- Power Generators Market Dynamics
- Growth Factors
- Challenges
- Power Generators Market Hotspot & Opportunities
- Power Generators Market Outlook, 2022-2032
- Market Size & Outlook
- By Revenues (USD Million)
- Market Segmentation & Outlook
- By Type - Market Size & Forecast 2022-2032, USD Million
- Diesel Generators
- Gas Generators
- Biogas
- Natural Gas
- Propane
- Hybrid Generators
- Renewable Fuel Generators
- Biofuel
- Hydrogen Fuel Cells
- Solar-Powered Generators
- By Portability- Market Size & Forecast 2022-2032, USD Million
- Stationary
- Portable
- By Power Rating (Capacity) - Market Size & Forecast 2022-2032, USD Million
- Low Power — Less than 75 kVA
- Medium Power — 75–375 kVA
- High Power — Greater than 375 kVA
- By End users- Market Size & Forecast 2022-2032, USD Million
- Agriculture
- Commercial
- Construction
- Government & Public Sector
- Healthcare
- Hospitality
- Industrial
- Chemical & Petrochemical
- Food & Beverage Processing
- Manufacturing
- Metal & Mining
- Oil & Gas
- Pharmaceuticals & Life Sciences
- Residential
- Telecommunications
- Utilities & Power Plants
- By Region
- North America
- South America
- Europe
- Middle East & Africa
- Asia Pacific
- By Company
- Competition Characteristics
- Market Segmentation & Outlook
- By Type - Market Size & Forecast 2022-2032, USD Million
- Market Size & Outlook
- North America Power Generators Market Outlook, 2022-2032
- Market Size & Outlook
- By Revenues (USD Million)
- Market Segmentation & Outlook
- By Type- Market Size & Forecast 2022-2032, USD Million
- By portability- Market Size & Forecast 2022-2032, USD Million
- By end user- Market Size & Forecast 2022-2032, USD Million
- By power rating(capacity)- Market Size & Forecast 2022-2032, USD Million
- By Country
- The US
- Canada
- Mexico
- The US Power Generators Market Outlook, 2022-2032F
- Market Size & Outlook
- By Revenues (USD Million)
- Market Segmentation & Outlook
- By Type- Market Size & Forecast 2022-2032, USD Million
- By portability- Market Size & Forecast 2022-2032, USD Million
- By end user- Market Size & Forecast 2022-2032, USD Million
- By power rating(capacity)- Market Size & Forecast 2022-2032, USD Million
- Market Size & Outlook
- Canada Power Generators Market Outlook, 2022-2032F
- Market Size & Outlook
- By Revenues (USD Million)
- Market Segmentation & Outlook
- By Type- Market Size & Forecast 2022-2032, USD Million
- By portability- Market Size & Forecast 2022-2032, USD Million
- By end user- Market Size & Forecast 2022-2032, USD Million
- By power rating(capacity)- Market Size & Forecast 2022-2032, USD Million
- Market Size & Outlook
- Market Size & Outlook
- South America Power Generators Market Outlook, 2022-2032
- Market Size & Outlook
- By Revenues (USD Million)
- Market Segmentation & Outlook
- By Type- Market Size & Forecast 2022-2032, USD Million
- By portability- Market Size & Forecast 2022-2032, USD Million
- By end user- Market Size & Forecast 2022-2032, USD Million
- By power rating(capacity)- Market Size & Forecast 2022-2032, USD Million
- By Country
- Brazil
- Argentina
- Chile
- Colombia
- Peru
- Ecuador
- Rest of South America
- Brazil Power Generators Market Outlook, 2022-2032F
- Market Size & Outlook
- By Revenues (USD Million)
- Market Segmentation & Outlook
- By Type- Market Size & Forecast 2022-2032, USD Million
- By portability- Market Size & Forecast 2022-2032, USD Million
- By end user- Market Size & Forecast 2022-2032, USD Million
- By power rating(capacity)- Market Size & Forecast 2022-2032, USD Million
- Market Size & Outlook
- Argentina Power Generators Market Outlook, 2022-2032F
- Market Size & Outlook
- By Revenues (USD Million)
- Market Segmentation & Outlook
- By Type- Market Size & Forecast 2022-2032, USD Million
- By portability- Market Size & Forecast 2022-2032, USD Million
- By end user- Market Size & Forecast 2022-2032, USD Million
- By power rating(capacity)- Market Size & Forecast 2022-2032, USD Million
- Market Size & Outlook
- Chile Power Generators Market Outlook, 2022-2032F
- Market Size & Outlook
- By Revenues (USD Million)
- Market Segmentation & Outlook
- By Type- Market Size & Forecast 2022-2032, USD Million
- By portability- Market Size & Forecast 2022-2032, USD Million
- By end user- Market Size & Forecast 2022-2032, USD Million
- By power rating(capacity)- Market Size & Forecast 2022-2032, USD Million
- Market Size & Outlook
- Colombia Power Generators Market Outlook, 2022-2032F
- Market Size & Outlook
- By Revenues (USD Million)
- Market Segmentation & Outlook
- By Type- Market Size & Forecast 2022-2032, USD Million
- By portability- Market Size & Forecast 2022-2032, USD Million
- By end user- Market Size & Forecast 2022-2032, USD Million
- By power rating(capacity)- Market Size & Forecast 2022-2032, USD Million
- Market Size & Outlook
- Peru Power Generators Market Outlook, 2022-2032F
- Market Size & Outlook
- By Revenues (USD Million)
- Market Segmentation & Outlook
- By Type- Market Size & Forecast 2022-2032, USD Million
- By portability- Market Size & Forecast 2022-2032, USD Million
- By end user- Market Size & Forecast 2022-2032, USD Million
- By power rating(capacity)- Market Size & Forecast 2022-2032, USD Million
- Market Size & Outlook
- Ecuador Power Generators Market Outlook, 2022-2032F
- Market Size & Outlook
- By Revenues (USD Million)
- Market Segmentation & Outlook
- By Type- Market Size & Forecast 2022-2032, USD Million
- By portability- Market Size & Forecast 2022-2032, USD Million
- By end user- Market Size & Forecast 2022-2032, USD Million
- By power rating(capacity)- Market Size & Forecast 2022-2032, USD Million
- Market Size & Outlook
- Market Size & Outlook
- Europe Power Generators Market Outlook, 2022-2032F
- Market Size & Outlook
- By Revenues (USD Million)
- Market Segmentation & Outlook
-
- By Type- Market Size & Forecast 2022-2032, USD Million
- By portability- Market Size & Forecast 2022-2032, USD Million
- By end user- Market Size & Forecast 2022-2032, USD Million
- By power rating(capacity)- Market Size & Forecast 2022-2032, USD Million
- By Country
- The UK
- Germany
- France
- Italy
- Spain
- Benelux
- Rest of Europe
-
- The UK Power Generators Market Outlook, 2022-2032F
- Market Size & Outlook
- By Revenues (USD Million)
- Market Segmentation & Outlook
- By Type- Market Size & Forecast 2022-2032, USD Million
- By portability- Market Size & Forecast 2022-2032, USD Million
- By end user- Market Size & Forecast 2022-2032, USD Million
- By power rating(capacity)- Market Size & Forecast 2022-2032, USD Million
- Market Size & Outlook
- Germany Power Generators Market Outlook, 2022-2032F
- Market Size & Outlook
- By Revenues (USD Million)
- Market Segmentation & Outlook
- By Type- Market Size & Forecast 2022-2032, USD Million
- By portability- Market Size & Forecast 2022-2032, USD Million
- By end user- Market Size & Forecast 2022-2032, USD Million
- By power rating(capacity)- Market Size & Forecast 2022-2032, USD Million
- Market Size & Outlook
- France Power Generators Market Outlook, 2022-2032F
- Market Size & Outlook
- By Revenues (USD Million)
- Market Segmentation & Outlook
- By Type- Market Size & Forecast 2022-2032, USD Million
- By portability- Market Size & Forecast 2022-2032, USD Million
- By end user- Market Size & Forecast 2022-2032, USD Million
- By power rating(capacity)- Market Size & Forecast 2022-2032, USD Million
- Market Size & Outlook
- Italy Power Generators Market Outlook, 2022-2032F
- Market Size & Outlook
- By Revenues (USD Million)
- Market Segmentation & Outlook
- By Type- Market Size & Forecast 2022-2032, USD Million
- By portability- Market Size & Forecast 2022-2032, USD Million
- By end user- Market Size & Forecast 2022-2032, USD Million
- By power rating(capacity)- Market Size & Forecast 2022-2032, USD Million
- Market Size & Outlook
- Spain Power Generators Market Outlook, 2022-2032F
- Market Size & Outlook
- By Revenues (USD Million)
- Market Segmentation & Outlook
- By Type- Market Size & Forecast 2022-2032, USD Million
- By portability- Market Size & Forecast 2022-2032, USD Million
- By end user- Market Size & Forecast 2022-2032, USD Million
- By power rating(capacity)- Market Size & Forecast 2022-2032, USD Million
- Market Size & Outlook
- Benelux Power Generators Market Outlook, 2022-2032F
- Market Size & Outlook
- By Revenues (USD Million)
- Market Segmentation & Outlook
- By Type- Market Size & Forecast 2022-2032, USD Million
- By portability- Market Size & Forecast 2022-2032, USD Million
- By end user- Market Size & Forecast 2022-2032, USD Million
- By power rating(capacity)- Market Size & Forecast 2022-2032, USD Million
- Market Size & Outlook
- Market Size & Outlook
- Middle East & Africa Power Generators Market Outlook, 2022-2032F
- Market Size & Outlook
- By Revenues (USD Million)
- Market Segmentation & Outlook
-
- By Type- Market Size & Forecast 2022-2032, USD Million
- By portability- Market Size & Forecast 2022-2032, USD Million
- By end user- Market Size & Forecast 2022-2032, USD Million
- By power rating(capacity)- Market Size & Forecast 2022-2032, USD Million
- By Country
- Saudi Arabia
- The UAE
- South Africa
- Egypt
- Qatar
- Kuwait
- Oman
- Nigeria
-
- Saudi Arabia Power Generators Market Outlook, 2022-2032F
- Market Size & Outlook
- By Revenues (USD Million)
- Market Segmentation & Outlook
- By Type- Market Size & Forecast 2022-2032, USD Million
- By portability- Market Size & Forecast 2022-2032, USD Million
- By end user- Market Size & Forecast 2022-2032, USD Million
- By power rating(capacity)- Market Size & Forecast 2022-2032, USD Million
- Market Size & Outlook
- The UAE Power Generators Market Outlook, 2022-2032F
- Market Size & Outlook
- By Revenues (USD Million)
- Market Segmentation & Outlook
- By Type- Market Size & Forecast 2022-2032, USD Million
- By portability- Market Size & Forecast 2022-2032, USD Million
- By end user- Market Size & Forecast 2022-2032, USD Million
- By power rating(capacity)- Market Size & Forecast 2022-2032, USD Million
- Market Size & Outlook
- South Africa Power Generators Market Outlook, 2022-2032F
- Market Size & Outlook
- By Revenues (USD Million)
- Market Segmentation & Outlook
- By Type- Market Size & Forecast 2022-2032, USD Million
- By portability- Market Size & Forecast 2022-2032, USD Million
- By end user- Market Size & Forecast 2022-2032, USD Million
- By power rating(capacity)- Market Size & Forecast 2022-2032, USD Million
- Market Size & Outlook
- Egypt Power Generators Market Outlook, 2022-2032F
- Market Size & Outlook
- By Revenues (USD Million)
- Market Segmentation & Outlook
- By Type- Market Size & Forecast 2022-2032, USD Million
- By portability- Market Size & Forecast 2022-2032, USD Million
- By end user- Market Size & Forecast 2022-2032, USD Million
- By power rating(capacity)- Market Size & Forecast 2022-2032, USD Million
- Market Size & Outlook
- Qatar Power Generators Market Outlook, 2022-2032F
- Market Size & Outlook
- By Revenues (USD Million)
- Market Segmentation & Outlook
- By Type- Market Size & Forecast 2022-2032, USD Million
- By portability- Market Size & Forecast 2022-2032, USD Million
- By end user- Market Size & Forecast 2022-2032, USD Million
- By power rating(capacity)- Market Size & Forecast 2022-2032, USD Million
- Market Size & Outlook
- Kuwait Power Generators Market Outlook, 2022-2032F
- Market Size & Outlook
- By Revenues (USD Million)
- Market Segmentation & Outlook
- By Type- Market Size & Forecast 2022-2032, USD Million
- By portability- Market Size & Forecast 2022-2032, USD Million
- By end user- Market Size & Forecast 2022-2032, USD Million
- By power rating(capacity)- Market Size & Forecast 2022-2032, USD Million
- Market Size & Outlook
- Oman Power Generators Market Outlook, 2022-2032F
- Market Size & Outlook
- By Revenues (USD Million)
- Market Segmentation & Outlook
- By Type- Market Size & Forecast 2022-2032, USD Million
- By portability- Market Size & Forecast 2022-2032, USD Million
- By end user- Market Size & Forecast 2022-2032, USD Million
- By power rating(capacity)- Market Size & Forecast 2022-2032, USD Million
- Market Size & Outlook
- Market Size & Outlook
- Asia Pacific Power Generators Market Outlook, 2022-2032F
- Market Size & Outlook
- By Revenues (USD Million)
- Market Segmentation & Outlook
-
- By Type- Market Size & Forecast 2022-2032, USD Million
- By portability- Market Size & Forecast 2022-2032, USD Million
- By end user- Market Size & Forecast 2022-2032, USD Million
- By power rating(capacity)- Market Size & Forecast 2022-2032, USD Million
- By Country
- China
- Japan
- India
- South Korea
- Australia
- Indonesia
- Thailand
- Vietnam
- New Zealand
- Rest of Asia-Pacific
-
- China Power Generators Market Outlook, 2022-2032F
- Market Size & Outlook
- By Revenues (USD Million)
- Market Segmentation & Outlook
- By Type- Market Size & Forecast 2022-2032, USD Million
- By portability- Market Size & Forecast 2022-2032, USD Million
- By end user- Market Size & Forecast 2022-2032, USD Million
- By power rating(capacity)- Market Size & Forecast 2022-2032, USD Million
- Market Size & Outlook
- Japan Power Generators Market Outlook, 2022-2032F
- Market Size & Outlook
- By Revenues (USD Million)
- Market Segmentation & Outlook
- By Type- Market Size & Forecast 2022-2032, USD Million
- By portability- Market Size & Forecast 2022-2032, USD Million
- By end user- Market Size & Forecast 2022-2032, USD Million
- By power rating(capacity)- Market Size & Forecast 2022-2032, USD Million
- Market Size & Outlook
- India Power Generators Market Outlook, 2022-2032F
- Market Size & Outlook
- By Revenues (USD Million)
- Market Segmentation & Outlook
- By Type- Market Size & Forecast 2022-2032, USD Million
- By portability- Market Size & Forecast 2022-2032, USD Million
- By end user- Market Size & Forecast 2022-2032, USD Million
- By power rating(capacity)- Market Size & Forecast 2022-2032, USD Million
- Market Size & Outlook
- South Korea Power Generators Market Outlook, 2022-2032F
- Market Size & Outlook
- By Revenues (USD Million)
- Market Segmentation & Outlook
- By Type- Market Size & Forecast 2022-2032, USD Million
- By portability- Market Size & Forecast 2022-2032, USD Million
- By end user- Market Size & Forecast 2022-2032, USD Million
- By power rating(capacity)- Market Size & Forecast 2022-2032, USD Million
- Market Size & Outlook
- Australia Power Generators Market Outlook, 2022-2032F
- Market Size & Outlook
- By Revenues (USD Million)
- Market Segmentation & Outlook
- By Type- Market Size & Forecast 2022-2032, USD Million
- By portability- Market Size & Forecast 2022-2032, USD Million
- By end user- Market Size & Forecast 2022-2032, USD Million
- By power rating(capacity)- Market Size & Forecast 2022-2032, USD Million
- Market Size & Outlook
- Indonesia Power Generators Market Outlook, 2022-2032F
- Market Size & Outlook
- By Revenues (USD Million)
- Market Segmentation & Outlook
- By Type- Market Size & Forecast 2022-2032, USD Million
- By portability- Market Size & Forecast 2022-2032, USD Million
- By end user- Market Size & Forecast 2022-2032, USD Million
- By power rating(capacity)- Market Size & Forecast 2022-2032, USD Million
- Market Size & Outlook
- Thailand Power Generators Market Outlook, 2022-2032F
- Market Size & Outlook
- By Revenues (USD Million)
- Market Segmentation & Outlook
- By Type- Market Size & Forecast 2022-2032, USD Million
- By portability- Market Size & Forecast 2022-2032, USD Million
- By end user- Market Size & Forecast 2022-2032, USD Million
- By power rating(capacity)- Market Size & Forecast 2022-2032, USD Million
- Market Size & Outlook
- Vietnam Power Generators Market Outlook, 2022-2032F
- Market Size & Outlook
- By Revenues (USD Million)
- Market Segmentation & Outlook
- By Type- Market Size & Forecast 2022-2032, USD Million
- By portability- Market Size & Forecast 2022-2032, USD Million
- By end user- Market Size & Forecast 2022-2032, USD Million
- By power rating(capacity)- Market Size & Forecast 2022-2032, USD Million
- Market Size & Outlook
- New Zealand Power Generators Market Outlook, 2022-2032F
- Market Size & Outlook
- By Revenues (USD Million)
- Market Segmentation & Outlook
- By Type- Market Size & Forecast 2022-2032, USD Million
- By portability- Market Size & Forecast 2022-2032, USD Million
- By end user- Market Size & Forecast 2022-2032, USD Million
- By power rating(capacity)- Market Size & Forecast 2022-2032, USD Million
- Market Size & Outlook
- Market Size & Outlook
- Power Generators Market Key Strategic Imperatives for Success & Growth
- Competitive Outlook
- Company Profiles
- Caterpillar Inc.
- Business Description
- Product Portfolio
- Collaborations & Alliances
- Recent Developments
- Financial Details
- Others
- Cummins Inc.
- Business Description
- Product Portfolio
- Collaborations & Alliances
- Recent Developments
- Financial Details
- Others
- Rolls-Royce Holdings plc
- Business Description
- Product Portfolio
- Collaborations & Alliances
- Recent Developments
- Financial Details
- Others
- Mitsubishi Heavy Industries, Ltd.
- Business Description
- Product Portfolio
- Collaborations & Alliances
- Recent Developments
- Financial Details
- Others
- Generac Holdings Inc.
- Business Description
- Product Portfolio
- Collaborations & Alliances
- Recent Developments
- Financial Details
- Others
- Wacker Neuson SE
- Business Description
- Product Portfolio
- Collaborations & Alliances
- Recent Developments
- Financial Details
- Others
- Aggreko plc
- Business Description
- Product Portfolio
- Collaborations & Alliances
- Recent Developments
- Financial Details
- Others
- HIMOINSA S.L.
- Business Description
- Product Portfolio
- Collaborations & Alliances
- Recent Developments
- Financial Details
- Others
- Atlas Copco AB
- Business Description
- Product Portfolio
- Collaborations & Alliances
- Recent Developments
- Financial Details
- Others
- Kirloskar Oil Engines Limited
- Business Description
- Product Portfolio
- Collaborations & Alliances
- Recent Developments
- Financial Details
- Others
- Doosan Corporation
- Business Description
- Product Portfolio
- Collaborations & Alliances
- Recent Developments
- Financial Details
- Others
- Yanmar Holdings Co., Ltd.
- Business Description
- Product Portfolio
- Collaborations & Alliances
- Recent Developments
- Financial Details
- Others
- Wärtsilä Corporation
- Business Description
- Product Portfolio
- Collaborations & Alliances
- Recent Developments
- Financial Details
- Others
- AKSA Power Generation
- Business Description
- Product Portfolio
- Collaborations & Alliances
- Recent Developments
- Financial Details
- Others
- Kohler Co.
- Business Description
- Product Portfolio
- Collaborations & Alliances
- Recent Developments
- Financial Details
- Others
- Caterpillar Inc.
- Company Profiles
- Disclaimer

MarkNtel Advisors follows a robust and iterative research methodology designed to ensure maximum accuracy and minimize deviation in market estimates and forecasts. Our approach combines both bottom-up and top-down techniques to effectively segment and quantify various aspects of the market. A consistent feature across all our research reports is data triangulation, which examines the market from three distinct perspectives to validate findings. Key components of our research process include:
1. Scope & Research Design At the outset, MarkNtel Advisors define the research objectives and formulate pertinent questions. This phase involves determining the type of research—qualitative or quantitative—and designing a methodology that outlines data collection methods, target demographics, and analytical tools. They also establish timelines and budgets to ensure the research aligns with client goals.
2. Sample Selection and Data Collection In this stage, the firm identifies the target audience and determines the appropriate sample size to ensure representativeness. They employ various sampling methods, such as random or stratified sampling, based on the research objectives. Data collection is carried out using tools like surveys, interviews, and observations, ensuring the gathered data is reliable and relevant.
3. Data Analysis and Validation Once data is collected, MarkNtel Advisors undertake a rigorous analysis process. This includes cleaning the data to remove inconsistencies, employing statistical software for quantitative analysis, and thematic analysis for qualitative data. Validation steps are taken to ensure the accuracy and reliability of the findings, minimizing biases and errors.

4. Data Forecast and FinalizationThe final phase involves forecasting future market trends based on the analyzed data. MarkNtel Advisors utilize predictive modeling and time series analysis to anticipate market behaviors. The insights are then compiled into comprehensive reports, featuring visual aids like charts and graphs, and include strategic recommendations to inform client decision-making
FILL THE FORM TO INQUIRE BEFORE BUYING THIS REPORT
We offer flexible licensing options to cater to varying organizational needs. Choose the pricing pack that best suits your requirements:
Buy Now Talk to our Consultant
 Request Customization