

By Product, (Food and Beverages, Personal and Household Care, Apparel, Footwear, and Accessories, Furniture, Toys, and Hobby, Electronic and Household Appliances, Pharmaceuticals),...... By Distribution Channel, (Supermarkets/Hypermarkets, Convenience Stores, Department Stores, Specialty Stores, Online, Independent Retailers, Chain Retailers, Franchise Stores), By Price Range, (Premium, Mid-range, Economy/Value Retail), By Store Size, (Small Stores, Medium Stores, Large Stores), and others Read more
- FMCG
- Jul 2026
- 140
- PDF, Excel, PPT
Indonesia Retail Market Key Takeaways
- Indonesia retail market size was valued at USD 191 billion in 2025 and is projected to grow from USD 208 billion in 2026 to USD 316 billion by 2032.
- The industry is projected to reflect sustained growth at a steady CAGR of 7.22% during 2026-2032.
- By product type, food & beverage holds a significant share of about 40% in 2026.
- By distribution channel, convenience stores seized a significant share of about 33% in 2026.
- The industry is highly fragmented. However, the top five players collectively account for nearly 2% share.
Indonesia Retail Market Size and Outlook
The Indonesia retail market size was valued at USD 191 billion in 2025 and is projected to grow from USD 208 billion in 2026 to USD 316 billion by 2032. Along with this, the market is estimated to grow at a CAGR of around 7.22% during the forecast period, i.e., 2026-32.
The market continues to demonstrate strong resilience, supported by robust household consumption, a large young population, and improving digital and logistics infrastructure. Retail activity remains closely tied to domestic demand, which is a key contributor to Indonesia’s economic stability, accounting for more than half of the national GDP through household spending.
Recent data shows that retail activity continues to strengthen despite periodic fluctuations. For instance, retail sales grew 6.3% year-on-year in November 2025, marking the fastest pace in nearly two years, supported by higher spending in food, beverages, automotive products, and recreational goods. Similarly, earlier in 2025, growth reached 4.7% in July, driven by stronger demand for essential goods and recovery in discretionary categories after seasonal adjustments. These trends highlight Indonesia’s consumption-driven economy, where household spending remains a core growth engine.
On a broader scale, consumer activity continues to expand across both physical and digital channels. Data from Statistics Indonesia (BPS) shows that e-retail and marketplace transactions grew 6.19% quarter-on-quarter in Q3 2025, with strong demand in personal care, household products, fashion, and recreational goods. This reflects a structural shift in shopping behavior, as more consumers adopt online platforms for convenience, variety, and competitive pricing.
At the macro level, Indonesia’s economy has maintained around 5% growth, which continues to support purchasing power and retail expansion. However, short-term fluctuations are still visible due to seasonal spending patterns, inflationary pressures, and post-holiday demand corrections.
Overall, the Indonesian retail industry is entering a phase of balanced expansion, where traditional retail remains strong while e-commerce accelerates rapidly. The combination of rising incomes, urbanization, and digital adoption is expected to sustain long-term growth, making Indonesia one of the most dynamic retail landscapes in Southeast Asia.
Indonesia Retail Market Key Indicators
- FMCG sales through e-commerce in Indonesia reached approximately USD 4.1 billion (Jan–Jul 2025), growing around 26% year-on-year. Beauty led the category with about USD 2.24 billion, followed by Food & Beverages at USD 0.85 billion, Health at USD 0.64 billion, and Mom & Kids at USD 0.38 billion. This strong performance reflects rising online household consumption across essential segments. The trend highlights increasing digital penetration in daily retail spending and reinforces e-commerce as a key driver of FMCG market expansion in Indonesia.
- Digital payments have become a structural backbone of Indonesia's retail economy. Data directly from Bank Indonesia's December 2025 Board of Governors Meeting confirms that total digital payment transactions reached 4.6 billion by November 2025, a 40% year-on-year increase spanning mobile banking, Quick Response Indonesia Code, and internet banking. QRIS alone recorded 1.68 billion transactions, with full-year 2025 volume hitting 13.66 billion, more than double the central bank's own target of 6.5 billion. QRIS users reached 59 million, served by 42 million merchants, 90% of whom are MSMEs. Bank Indonesia projects a further 29.79% growth in digital payment transactions through 2026.
- The manufacturing sector remains a fundamental pillar of Indonesia's economy, contributing approximately 20% to GDP. The government's "Making Indonesia 4.0" roadmap actively targets five priority sectors: food and beverages, textiles, automotive, chemicals, and electronics, with incentives including tax holidays, import duty exemptions, and streamlined licensing in Special Economic Zones. Manufacturing investment reached USD 45 billion in 2024.
The Indonesia Retail Market Scope
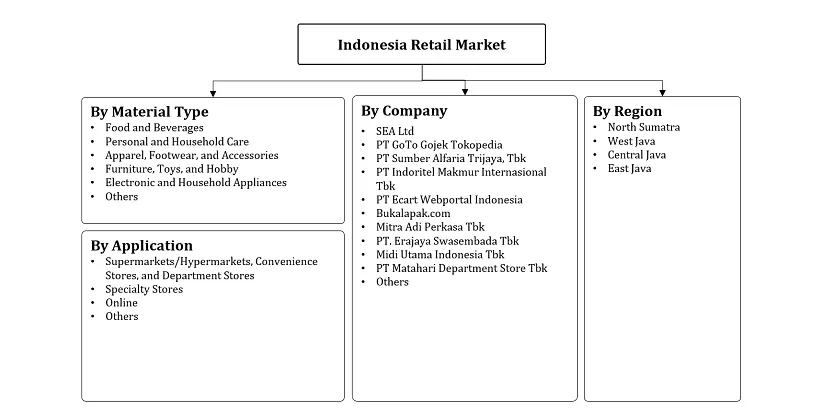
| Category | Segments |
|---|---|
| By Product | Food and Beverages, Personal and Household Care, Apparel, Footwear, and Accessories, Furniture, Toys, and Hobby, Electronic and Household Appliances, Pharmaceuticals |
| By Distribution Channel | Supermarkets/Hypermarkets, Convenience Stores, Department Stores, Specialty Stores, Online |
| By Ownership | Independent Retailers, Chain Retailers, Franchise Stores |
| By Price Range | Premium, Mid-range, Economy/Value Retail |
| By Store Size | Small Stores, Medium Stores, Large Stores |
The Indonesia Retail Market Growth Drivers
Rapid Growth of E-commerce and Digital Connectivity
The rapid growth of e-commerce and marketplaces driving Indonesia’s retail industry, supported by rising digital connectivity, stronger payment systems, and increasing consumer trust in online platforms. According to Bank Indonesia, e-commerce transaction value reached USD 2.8 billion in July 2025, reflecting continued expansion in digital retail activity and sustained consumer spending online. During the same period, transaction volumes reached 466.9 million, indicating strong repeat purchases and growing marketplace penetration.
A key structural enabler of this growth is Indonesia’s rising internet penetration, which reached 72.78% of the population in 2024, according to Statistics Indonesia (BPS) in Telecommunication Statistics 2024. This expanding connectivity base is crucial in supporting mobile-first shopping behavior, especially in Tier 1 and Tier 2 cities, where smartphone usage and digital access are significantly higher. The increasing availability of internet services is enabling consumers to access e-commerce platforms more frequently, compare products online, and complete digital transactions with greater convenience. It is also strengthening the participation of MSMEs in online marketplaces, as improved connectivity allows smaller sellers to reach wider customer bases beyond physical store limitations.
E-commerce in Indonesia is rapidly expanding due to high internet penetration, strong digital payment adoption, and rising consumer trust in online platforms. With continued infrastructure development and policy support, this trend will remain a powerful driver of retail sector growth in the coming years.
- Market Segmentation
- Introduction
- Product Definition
- Research Process
- Assumptions
- Executive Summary
- Indonesia Retail Market Policies, Regulations, and Product Standards
- Indonesia Retail Market Trends & Developments
- Indonesia Retail Market Dynamics
- Growth Factors
- Challenges
- Indonesia Retail Market Hotspot & Opportunities
- Indonesia Retail Market Outlook, 2022-2032F
- Market Size & Outlook
- By Revenues (USD Million)
- Market Segmentation & Outlook
- By Product- Market Size & Forecast 2022-2032, USD Million
- Food and Beverage
- Fresh Food
- Fruits
- Apples
- Bananas
- Oranges
- Mangoes
- Berries
- Grapes
- Others
- Vegetables
- Potatoes
- Tomatoes
- Onions
- Leafy Greens
- Others
- Meat
- Beef
- Pork
- Lamb
- Poultry
- Chicken
- Turkey
- Seafood
- Fish
- Shellfish
- Others
- Dairy Products
- Milk
- Cheese
- Butter & Margarine
- Yogurt & Probiotic Drinks
- Others
- Fruits
- Packaged Food
- Snacks & Confectionery
- Chips & Savory Snacks
- Chocolates
- Sugar Confectionery (Candies, Gums)
- Others
- Ready-to-Eat / Ready-to-Cook Meals
- Frozen Meals
- Instant Noodles
- Ready Curry / Meal Kits
- Others
- Bakery Products
- Bread
- Cakes & Pastries
- Biscuits & Cookies
- Others
- Snacks & Confectionery
- Beverages
- Non-Alcoholic
- Carbonated Soft Drinks
- Juices
- Bottled Water
- Energy & Sports Drinks
- Tea & Coffee (Packaged/RTD)
- Others
- Alcoholic Beverages
- Beer
- Wine
- Spirits
- Others
- Non-Alcoholic
- Grocery Staples
- Rice
- Wheat
- Pulses
- Oils
- Fresh Food
- Personal and Household Care
- Personal Care
- Skincare
- Moisturizers
- Sunscreens
- Anti-aging Products
- Face Wash & Cleansers
- Others
- Haircare
- Shampoos
- Conditioners
- Hair Oils
- Hair Styling Products
- Others
- Cosmetics & Makeup
- Foundation
- Powder
- Mascara
- Eyeliner
- Lipstick
- Lip Balm
- Others
- Fragrances
- Perfumes
- Deodorants
- Skincare
- Household Care
- Cleaning Products
- Laundry Detergents
- Dishwashing Liquids
- Surface Cleaners
- Disinfectants
- Others
- Paper Products
- Toilet Paper
- Tissues
- Paper Towels
- Others
- Home Care Consumables
- Air Fresheners
- Insect Repellents
- Cleaning Products
- Personal Care
- Apparel, Footwear, and Accessories
- Apparel
- Men’s Wear
- Shirts
- T-shirts
- Trousers
- Ethnic Wear
- Others
- Women’s Wear
- Dresses
- Tops
- Sarees
- Ethnic Wear
- Others
- Kids Wear
- Infant Wear
- School Wear
- Men’s Wear
- Footwear
- Casual Footwear
- Sneakers
- Sandals
- Sports Footwear
- Running Shoes
- Training Shoes
- Formal Footwear
- Leather Shoes
- Office Footwear
- Casual Footwear
- Accessories
- Bags & Luggage
- Backpacks
- Suitcases
- Watches
- Analog
- Smartwatches
- Jewelry & Fashion Accessories
- Gold
- Diamond
- Fashion Jewelry
- Bags & Luggage
- Apparel
- Furniture, Toys, and Hobby
- Furniture
- Home Furniture
- Sofas
- Beds
- Dining Tables
- Others
- Office Furniture
- Chairs
- Workstations
- Home Furniture
- Home Décor
- Lighting
- Lamps
- LED Fixtures
- Decorative Items
- Wall Art
- Vases
- Others
- Lighting
- Toys & Games
- Educational Toys
- Electronic Toys
- Hobby & Leisure
- Sports Goods
- Cricket Bats
- Footballs
- Fitness Equipment
- Others
- DIY & Craft Kits
- Art Supplies
- Hobb Kits
- Others
- Sports Goods
- Furniture
- Electronic and Household Appliances
- Consumer Electronics
- Smartphones & Tablets
- Laptops & Computers
- Audio & Video Devices
- Home Appliances
- Large Appliances
- Refrigerators
- Washing Machines
- ACs
- Others
- Small Appliances
- Microwaves
- Mixers
- Vacuum Cleaners
- Others
- Large Appliances
- Smart Devices
- Wearables
- Smart Home Systems
- Consumer Electronics
- Pharmaceuticals
- OTC Drugs
- Pain Relievers
- Cold & Flu Medicines
- Digestive Aids
- Prescription Medicines
- Chronic Disease Drugs
- Antibiotics
- Health Supplements
- Vitamins
- Protein Supplements
- Herbal Supplements
- Others
- OTC Drugs
- Food and Beverage
- By Distribution Channel- Market Size & Forecast 2022-2032, USD Million
- Supermarkets/Hypermarkets
- Convenience Stores
- Department Stores
- Specialty Stores
- Online
- By Ownership- Market Size & Forecast 2022-2032, USD Million
- Independent Retailers
- Chain Retailers
- Franchise Stores
- By Price Range- Market Size & Forecast 2022-2032, USD Million
- Premium
- Mid-range
- Economy/Value Retail
- By Store Size- Market Size & Forecast 2022-2032, USD Million
- Small Stores
- Medium Stores
- Large Stores
- By Region
- North Sumatra
- West Java
- Central Java
- East Java
- By Company
- Competition Characteristics
- Market Share & Analysis
- By Product- Market Size & Forecast 2022-2032, USD Million
- Market Size & Outlook
- Indonesia Food and Beverage Market Outlook, 2022-2032F
- Market Size & Outlook
- By Revenues (USD Million)
- Market Segmentation & Outlook
- By Distribution Channel- Market Size & Forecast 2022-2032, USD Million
- By Ownership- Market Size & Forecast 2022-2032, USD Million
- By Price Range- Market Size & Forecast 2022-2032, USD Million
- By Store Size- Market Size & Forecast 2022-2032, USD Million
- By Region- Market Size & Forecast 2022-2032, USD Million
- Market Size & Outlook
- Indonesia Personal and Household Care Market Outlook, 2022-2032F
- Market Size & Outlook
- By Revenues (USD Million)
- Market Segmentation & Outlook
- By Distribution Channel- Market Size & Forecast 2022-2032, USD Million
- By Ownership- Market Size & Forecast 2022-2032, USD Million
- By Price Range- Market Size & Forecast 2022-2032, USD Million
- By Store Size- Market Size & Forecast 2022-2032, USD Million
- By Region- Market Size & Forecast 2022-2032, USD Million
- Market Size & Outlook
- Indonesia Apparel, Footwear, and Accessories Market Outlook, 2022-2032F
- Market Size & Outlook
- By Revenues (USD Million)
- Market Segmentation & Outlook
- By Distribution Channel- Market Size & Forecast 2022-2032, USD Million
- By Ownership- Market Size & Forecast 2022-2032, USD Million
- By Price Range- Market Size & Forecast 2022-2032, USD Million
- By Store Size- Market Size & Forecast 2022-2032, USD Million
- By Region- Market Size & Forecast 2022-2032, USD Million
- Market Size & Outlook
- Indonesia Furniture, Toys, and Hobby Market Outlook, 2022-2032F
- Market Size & Outlook
- By Revenues (USD Million)
- Market Segmentation & Outlook
- By Distribution Channel- Market Size & Forecast 2022-2032, USD Million
- By Ownership- Market Size & Forecast 2022-2032, USD Million
- By Price Range- Market Size & Forecast 2022-2032, USD Million
- By Store Size- Market Size & Forecast 2022-2032, USD Million
- By Region- Market Size & Forecast 2022-2032, USD Million
- Market Size & Outlook
- Indonesia Electronic and Household Appliances Market Outlook, 2022-2032F
- Market Size & Outlook
- By Revenues (USD Million)
- Market Segmentation & Outlook
- By Distribution Channel- Market Size & Forecast 2022-2032, USD Million
- By Ownership- Market Size & Forecast 2022-2032, USD Million
- By Price Range- Market Size & Forecast 2022-2032, USD Million
- By Store Size- Market Size & Forecast 2022-2032, USD Million
- By Region- Market Size & Forecast 2022-2032, USD Million
- Market Size & Outlook
- Indonesia Pharmaceuticals Market Outlook, 2022-2032F
- Market Size & Outlook
- By Revenues (USD Million)
- Market Segmentation & Outlook
- By Distribution Channel- Market Size & Forecast 2022-2032, USD Million
- By Ownership- Market Size & Forecast 2022-2032, USD Million
- By Price Range- Market Size & Forecast 2022-2032, USD Million
- By Store Size- Market Size & Forecast 2022-2032, USD Million
- By Region- Market Size & Forecast 2022-2032, USD Million
- Market Size & Outlook
- Indonesia Retail Market Key Strategic Imperatives for Success & Growth
- Competitive Outlook
- Company Profiles
- PT Indomarco Prismatama
- Business Description
- Product Portfolio
- Collaborations & Alliances
- Recent Developments
- Financial Details
- Others
- PT Sumber Alfaria Trijaya Tbk
- Business Description
- Product Portfolio
- Collaborations & Alliances
- Recent Developments
- Financial Details
- Others
- PT Matahari Department Store Tbk
- Business Description
- Product Portfolio
- Collaborations & Alliances
- Recent Developments
- Financial Details
- Others
- PT Matahari Putra Prima Tbk
- Business Description
- Product Portfolio
- Collaborations & Alliances
- Recent Developments
- Financial Details
- Others
- PT Hero Retail Nusantara
- Business Description
- Product Portfolio
- Collaborations & Alliances
- Recent Developments
- Financial Details
- Others
- PT Trans Retail Indonesia
- Business Description
- Product Portfolio
- Collaborations & Alliances
- Recent Developments
- Financial Details
- Others
- PT Ramayana Lestari Sentosa Tbk
- Business Description
- Product Portfolio
- Collaborations & Alliances
- Recent Developments
- Financial Details
- Others
- PT Mitra Adiperkasa Tbk
- Business Description
- Product Portfolio
- Collaborations & Alliances
- Recent Developments
- Financial Details
- Others
- PT Bukalapak.com Tbk
- Business Description
- Product Portfolio
- Collaborations & Alliances
- Recent Developments
- Financial Details
- Others
- PT Tokopedia
- Business Description
- Product Portfolio
- Collaborations & Alliances
- Recent Developments
- Financial Details
- Others
- Others
- PT Indomarco Prismatama
- Company Profiles
- Disclaimer
MarkNtel Advisors follows a robust and iterative research methodology designed to ensure maximum accuracy and minimize deviation in market estimates and forecasts. Our approach combines both bottom-up and top-down techniques to effectively segment and quantify various aspects of the market. A consistent feature across all our research reports is data triangulation, which examines the market from three distinct perspectives to validate findings. Key components of our research process include:
1. Scope & Research Design At the outset, MarkNtel Advisors define the research objectives and formulate pertinent questions. This phase involves determining the type of research—qualitative or quantitative—and designing a methodology that outlines data collection methods, target demographics, and analytical tools. They also establish timelines and budgets to ensure the research aligns with client goals.
2. Sample Selection and Data Collection In this stage, the firm identifies the target audience and determines the appropriate sample size to ensure representativeness. They employ various sampling methods, such as random or stratified sampling, based on the research objectives. Data collection is carried out using tools like surveys, interviews, and observations, ensuring the gathered data is reliable and relevant.
3. Data Analysis and Validation Once data is collected, MarkNtel Advisors undertake a rigorous analysis process. This includes cleaning the data to remove inconsistencies, employing statistical software for quantitative analysis, and thematic analysis for qualitative data. Validation steps are taken to ensure the accuracy and reliability of the findings, minimizing biases and errors.

4. Data Forecast and FinalizationThe final phase involves forecasting future market trends based on the analyzed data. MarkNtel Advisors utilize predictive modeling and time series analysis to anticipate market behaviors. The insights are then compiled into comprehensive reports, featuring visual aids like charts and graphs, and include strategic recommendations to inform client decision-making
FILL THE FORM TO INQUIRE BEFORE BUYING THIS REPORT
We offer flexible licensing options to cater to varying organizational needs. Choose the pricing pack that best suits your requirements:
Buy Now Talk to our Consultant
 Request Customization