
Global Well Stimulation & Cementing Additives Market Research Report: Forecast (2026-2032)
Well Stimulation & Cementing Additives Market - By Well Type (Onshore Wells, Offshore Wells), By Product Type (Friction Reducers, Crosslinkers, Surfactants, Dispersants, Retarder ... s, Gas-Migration Control Additives, Others (Base Fluids, Proppants, Gelling Agents, etc), By Sales Channel (Project-Based / Contractor-Led Sales, Direct Supply to Operators, Distributor & Chemical Supplier Channels), By Application Type (High-temperature / high-pressure (HTHP) wells, High-salinity reservoirs, Offshore wells and logistics-constrained sites, Green or environmentally compliant additive formulations), and others Read more
- Chemicals
- Dec 2025
- Pages 198
- Report Format: PDF, Excel, PPT
Global Well Stimulation & Cementing Additives Market
Projected 6.53% CAGR from 2026 to 2032
Study Period
2026-2032
Market Size (2025)
USD 6.93 Billion
Market Size (2032)
USD 10.79 Billion
Largest Region
North America
Projected CAGR
6.53%
Leading Segments
By Well Type: Onshore Wells
Global Well Stimulation & Cementing Additives Market Report Key Takeaways:
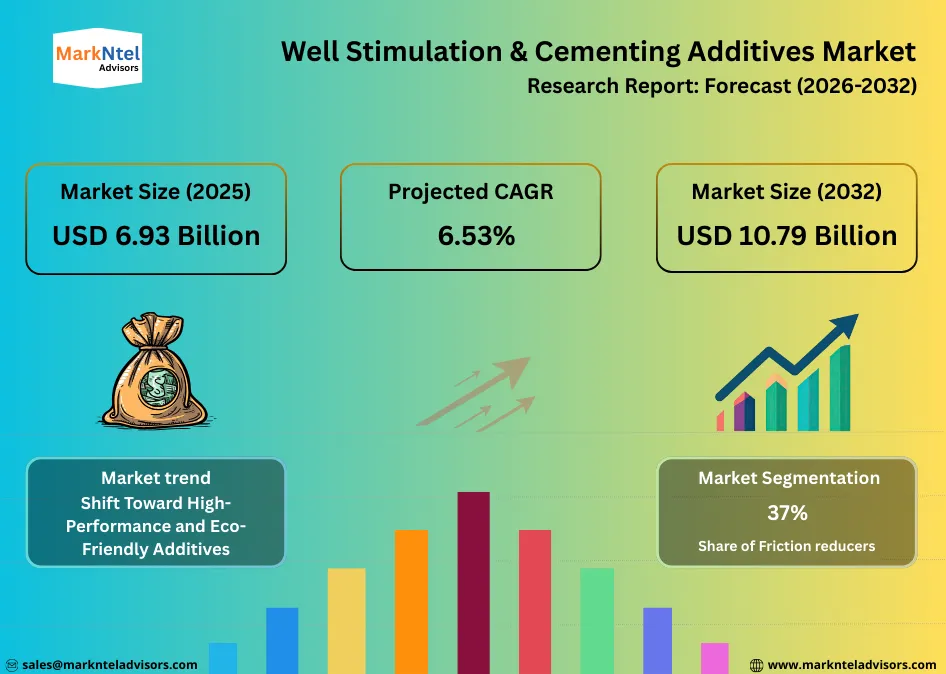
- Market size is valued at around USD6.93 billion in 2025 and is projected to reach USD10.79 billion by 2032. The estimated CAGR from 2026 to 2032 is around 6.53%, indicating strong growth.
- By Region, North America leads the Well Stimulation & Cementing Additives Market by holding a market share of about 41% in terms of quantity sold.
- By Product Type, Friction Reducers represented a significant market share of about 37% (in terms of revenues) in the Global Well Stimulation & Cementing Additives Market in 2025.
- By Well Type, the on-shore wells represented a major share of the Global Well Stimulation & Cementing Additives Market, accounting for about 83% in 2025. Meanwhile, High Temperature and High Pressure Wells are also expected to grow further and hold a market share of about 39% in terms of quantity during 2026-32.
- Leading Well Stimulation & Cementing Additives companies are Schlumberger Limited, Halliburton, Baker Hughes, Weatherford International, Clariant, Dow Chemical, BASF SE, Solvay, Evonik Industries, Arkema, SNF Group, Innospec Oilfield Services, CES Energy Solutions, Dorf Ketal, Croda Energy Technologies, and others.
- The pricing of these additives are set to remain volatile in the next five years as well due to geopolitical events in Europe and Middle East. However, in base case scenario the average prices are set to soar at a CAGR of around 5.88%.
Market Insights & Analysis: Global Well Stimulation & Cementing Additives Market (2026-32):
The Global Well Stimulation & Cementing Additives Market size is valued at around USD6.93 billion in 2025 and is projected to reach USD10.79 billion by 2032. Along with this, the market is estimated to grow at a CAGR of around 6.53% during the forecast period, i.e., 2026-32.
The Global Well Stimulation & Cementing Additives Market is expected to remain strong as upstream oil and gas activity continues at high levels. According to the International Energy Agency (IEA), global oil production increased by 1.5 million barrels per day in 2025, pushing total output to an average near 104.3 million b/d and further projected toward 108.7 million b/d in 2026. This expansion reflects contributions from both Organization of the Petroleum Exporting Countries (OPEC+) and non-OPEC producers, including the United States, Brazil, Canada, and others.
Additionally, higher oil output requires more drilling, stimulation, and well integrity work, which in turn drives demand for chemical additives used in well stimulation and cementing operations. For reference, increased offshore and unconventional drilling demands high-performance friction reducers, surfactants, fluid-loss control agents, and advanced cement additives that withstand extreme temperatures and pressures. As operators seek to enhance reservoir recovery and secure wellbore integrity, additive consumption rises.
Moreover, globally, around 70,000 new oil and gas wells were drilled in 2024, demonstrating persistent drilling activity and associated additive needs. Similarly, in the United States alone, producing wells remain near historic levels, with over 918,000 producing wells recorded in 2024, underscoring the scale of ongoing field development and maintenance work. These factors are contributing to the market growth.
Global Well Stimulation & Cementing Additives Market Recent Developments:
- 2024: SLB announced an all-stock agreement to acquire ChampionX Corporation for about USD7.75 billion. This strategic move strengthens SLB's production and recovery portfolio by adding ChampionX's chemical, fluid, and digital technologies, enhancing capabilities in well stimulation, cementing, and production optimization services.
- 2024: Avient Corporation launched ColorMatrix Amosorb Oxyloop-1, an oxygen scavenger additive used in PET packaging masterbatches to improve recyclability and extend shelf life, supporting higher recycled content and better performance in the global Well Stimulation & Cementing Additives market.
Global Well Stimulation & Cementing Additives Market Scope:
| Category | Segments |
|---|---|
| By Well Type | Onshore Wells, Offshore Wells), |
| By Product Type | Friction Reducers, Crosslinkers, Surfactants, Dispersants, Retarders, Gas-Migration Control Additives, Others (Base Fluids, Proppants, Gelling Agents, etc), |
| By Sales Channel | Project-Based / Contractor-Led Sales, Direct Supply to Operators, Distributor & Chemical Supplier Channels), |
| By Application Type | High-temperature / high-pressure (HTHP) wells, High-salinity reservoirs, Offshore wells and logistics-constrained sites, Green or environmentally compliant additive formulations), and others |
Global Well Stimulation & Cementing Additives Market Driver:
Rising Oil & Gas Exploration and Production Activities
Rising oil and gas production across major producing countries is a strong driver for the global well stimulation and cementing additives market, as higher output requires continuous drilling, completion, and well-maintenance activity. For instance, Saudi Arabia produces around 11.1 million barrels of crude oil per day, making it one of the world’s largest producers. Sustaining this level of output requires extensive drilling and remedial cementing work, directly supporting demand for cementing and stimulation additives.
Additionally, Canada produces about 5.7 million barrels per day, largely from oil sands and unconventional resources, where stimulation chemicals and specialty cementing additives are essential for well integrity and productivity.
Moreover, China produces roughly 5.2 million barrels per day of crude oil and continues to invest heavily in domestic oil and gas development to enhance energy security. These efforts involve complex wells that rely on high-performance additives. Likewise, Brazil produces around 4.3 million barrels per day, driven by offshore pre-salt fields that require advanced cementing additives to withstand high-pressure and temperature conditions.
Global Well Stimulation & Cementing Additives Market Trend:
Shift Toward High-Performance and Eco-Friendly Additives
This market is steadily shifting toward high-performance and eco-friendly formulations, driven by tighter regulations, environmental scrutiny, and operational efficiency needs. For instance, regulators in the United States have highlighted that more than 1,100 different chemicals are used in hydraulic fracturing fluids, increasing pressure on operators to reduce toxicity and improve chemical transparency. As a result, oil and gas companies are increasingly preferring additives that deliver the same or better downhole performance with lower environmental risk.
Additionally, high-performance additives are gaining traction because wells are becoming deeper, hotter, and more complex. These conditions require advanced polymers, dispersants, and fluid-loss additives that remain stable at high temperatures and pressures, while also minimizing formation damage. For reference, biodegradable surfactants and plant-based polymers are being adopted to replace conventional petroleum-derived chemicals in stimulation and cementing fluids.
Likewise, major chemical suppliers are aligning with this shift. Companies such as BASF, Clariant, Dow, Nouryon, and Ashland are developing low-toxicity, biodegradable, and high-efficiency oilfield additives designed to meet stricter environmental norms without compromising well integrity or productivity.
Global Well Stimulation & Cementing Additives Market Challenges:
Rising Raw Material and Chemical Costs Impeding Market Growth
Rising raw-material and chemical costs are squeezing the well-stimulation and cementing-additives market by pushing input prices, tightening supply, and eroding margins for specialty additive makers. For instance, ethylene oxide and related surfactant feedstocks saw a notable price uptick at the end of 2024, a 3.54% surge reported for December 2024, which raises costs for many stimulation surfactants and polymers.
Additionally, major European ethylene capacity is under stress, as Exxon announced closure plans for its Fife ethylene plant by February 2026, reducing regional feedstock availability and adding upward pressure on prices and logistics.
Moreover, governments are intervening to secure supply. The UK committed public funds to support the Grangemouth ethylene complex to protect domestic production and jobs, which signals tighter market fundamentals for petrochemical feedstock. Furthermore, elemental sulfur and acid supplies used in some chemical processes have been described as tight with premium pricing in recent market updates, further increasing costs for additives that rely on sulfur-derived inputs.
Global Well Stimulation & Cementing Additives Market (2026-32) Segmentation Analysis:
The Global Well Stimulation & Cementing Additives Market Report and Forecast 2026-2032 offers a detailed analysis of the market based on the following segments:
Based on Product Type
- Friction Reducers
- Crosslinkers
- Surfactants
- Dispersants
- Retarders
- Gas-Migration Control Additives
- Others (Base Fluids, Proppants, Gelling Agents, etc)
Friction reducers are one of the most critical additives used in well stimulation, accounting for around 37% market share, particularly in hydraulic fracturing operations. Their primary role is to reduce friction between fracturing fluids and the wellbore, allowing operators to pump fluids at very high rates while using lower pressure and energy. This improves operational efficiency and reduces wear on surface equipment.
Additionally, the U.S. Energy Information Administration (EIA) confirms that nearly all shale oil and gas production relies on hydraulic fracturing, especially in basins such as the Permian, Eagle Ford, and Marcellus. These operations require large volumes of water, often 10 to 20 million liters per well, to be pumped at high speeds, making friction reducers essential to control pressure losses. Additionally, data disclosed through FracFocus, supported by U.S. state regulators, show that friction reducers are among the most commonly reported chemical additives in fracturing fluids.
Based on Well Type
- Onshore Wells
- Offshore Wells
Onshore wells hold the largest market share of about 83% because most oil and gas activity worldwide takes place on land, where drilling volumes are much higher than offshore. For instance, the International Energy Agency (IEA) states that offshore fields contribute only about 30% of global oil production, meaning nearly 70% of output comes from onshore assets. This large onshore share directly translates into greater demand for stimulation and cementing additives.
Additionally, the U.S. Energy Information Administration (EIA) reports that almost all hydraulic fracturing activity globally occurs onshore, particularly in shale basins across North America. Hydraulic fracturing and associated cementing operations require large volumes of friction reducers, fluid-loss additives, dispersants, and cement modifiers. Moreover, onshore projects typically have shorter drilling cycles and lower development costs, allowing operators to drill more wells and perform repeated re-stimulation and remedial cementing. As a result, higher well counts, frequent interventions, and cost-driven drilling programs make onshore wells the primary consumers of well stimulation and cementing additives worldwide.
Global Well Stimulation & Cementing Additives (2026-32): Regional Projection
North America, especially the United States and Canada, dominates the global well stimulation & cementing additives industry, accounting for about 40% market share, and the cementing additives market because the region leads global oil and gas production growth, most of which is from onshore shale and tight formations that require extensive well stimulation and cementing work. For reference, the U.S. Energy Information Administration (EIA) reports that U.S. crude oil production has been rising steadily, with around 13.3–13.4 million barrels per day in 2023–24, driven by shale activity. Horizontal drilling and hydraulic fracturing technologies have been central to this growth, enabling access to tight oil and gas resources that were previously uneconomical to produce.
Additionally, the EIA estimates that about 64% of U.S. crude oil production in 2023 originated from tight oil (shale) resources, underscoring the importance of stimulation operations in these wells.
Moreover, hydraulic fracturing and cementing additives are essential for maintaining well integrity and enhancing recovery in these complex wellbores. Furthermore, North America’s advanced drilling infrastructure and technological leadership have made it a hub for high-volume well stimulation, which, in turn, drives demand for a wide range of additives. According to global energy analyses, North America accounts for a very large share of hydraulic fracturing activity worldwide, reflecting its central role in additive consumption.
Gain a Competitive Edge with Our Global Well Stimulation & Cementing Additives Market Report
- Global Well Stimulation & Cementing Additives Market Report by MarkNtel Advisors provides a detailed & thorough analysis of market size & share, growth rate, competitive landscape, and key players. This comprehensive analysis helps businesses gain a holistic understanding of the market dynamics & make informed decisions.
- This report also highlights current market trends & future projections, allowing businesses to identify emerging opportunities & potential challenges. By understanding market forecasts, companies can align their strategies & stay ahead of the competition.
- Global Well Stimulation & Cementing Additives Market Report aids in assessing & mitigating risks associated with entering or operating in the market. By understanding market dynamics, regulatory frameworks, and potential challenges, businesses can develop strategies to minimize risks & optimize their operations.
*Reports Delivery Format - Market research studies from MarkNtel Advisors are offered in PDF, Excel and PowerPoint formats. Within 24 hours of the payment being successfully received, the report will be sent to your email address.
Frequently Asked Questions
- Market Segmentation
- Introduction
- Product Definition
- Research Process
- Assumptions
- Executive Summary
- Global Well Stimulation & Cementing Additives Market Policies, Regulations, Product Standards
- REACH (EU) Compliance Overview
- OSPAR Offshore Chemical Notification Scheme
- GCC Environmental Standards and Local Approval Requirements
- U.S. EPA Offshore Chemical Management
- Asia-Pacific and Latin American Environmental Compliance Frameworks
- ESG Trends and Impact on Chemical Selection
- Global Well Stimulation Additives & Specialty Cementing Products Market Field Case Studies and Technical References
- Summary of Relevant SPE Papers and Field Trials in HTHP, High-Salinity, and Green Chemistry Contexts
- Performance Comparisons and Lessons Learned
- Case Highlights (e.g., North Sea acid stimulation, Middle East carbonate HTHP wells, Permian high-TDS shale stimulation)
- Global Well Stimulation & Cementing Additives Market Trends & Development
- Global Well Stimulation & Cementing Additives Market Dynamics
- Growth Drivers
- Challenges
- Global Well Stimulation & Cementing Additives Market Hotspot & Opportunities
- Global Well Stimulation & Cementing Additives Market Outlook, 2022-2032F
- Market Size & Analysis
- By Revenue (USD Million)
- By Volume (Thousand Tons)
- Market Share & Analysis
- By Well Type- (USD Million & Thousand Tons)
- Onshore Wells
- Offshore Wells
- By Product Type- (USD Million & Thousand Tons)
- Friction Reducers
- Crosslinkers
- Surfactants
- Dispersants
- Retarders
- Gas-Migration Control Additives
- Others (Base Fluids, Proppants, Gelling Agents, etc)
- By Sales Channel- (USD Million & Thousand Tons)
- Project-Based / Contractor-Led Sales
- Direct Supply to Operators
- Distributor & Chemical Supplier Channels
- By Application Type- (USD Million & Thousand Tons)
- High-temperature / high-pressure (HTHP) wells
- High-salinity reservoirs
- Offshore wells and logistics-constrained sites
- Green or environmentally compliant additive formulations
- By Region
- North America
- South America
- Europe
- Middle East & Africa
- Asia-Pacific
- By Company
- Competition Characteristics
- Market Share & Analysis
- Key Stakeholders & Sourcing Structure
- National Oil Companies (NOCs): e.g., Saudi Aramco, ADNOC, Petrobras, ONGC, CNPC
- International Oil Companies (IOCs): e.g., ExxonMobil, Shell, BP, Chevron, TotalEnergies
- Major Service Providers: Schlumberger, Halliburton, Baker Hughes, Weatherford, NOV, etc.
- Regional Subcontractors: Local stimulation service companies by region
- By Well Type- (USD Million & Thousand Tons)
- Market Size & Analysis
- North America Well Stimulation & Cementing Additives Market Outlook, 2022-2032F
- Market Size & Analysis
- By Revenue (USD Million)
- By Volume (Thousand Tons)
- Market Share & Analysis
- By Well Type- (USD Million & Thousand Tons)
- By Product Type- (USD Million & Thousand Tons)
- By Sales Channel- (USD Million & Thousand Tons)
- By Application- (USD Million & Thousand Tons)
- By Country
- The US
- Canada
- Mexico
- The US Well Stimulation & Cementing Additives Market Outlook, 2022-2032F
- Market Size & Analysis
- By Revenue (USD Million)
- By Volume (Thousand Tons)
- Market Share & Analysis
- By Well Type- (USD Million & Thousand Tons)
- By Product Type- (USD Million & Thousand Tons)
- By Sales Channel- (USD Million & Thousand Tons)
- By Application- (USD Million & Thousand Tons)
- Market Size & Analysis
- Canada Well Stimulation & Cementing Additives Market Outlook, 2022-2032F
- Market Size & Analysis
- By Revenue (USD Million)
- By Volume (Thousand Tons)
- Market Share & Analysis
- By Well Type- (USD Million & Thousand Tons)
- By Product Type- (USD Million & Thousand Tons)
- By Sales Channel- (USD Million & Thousand Tons)
- By Application- (USD Million & Thousand Tons)
- Market Size & Analysis
- Mexico Well Stimulation & Cementing Additives Market Outlook, 2022-2032F
- Market Size & Analysis
- By Revenue (USD Million)
- By Volume (Thousand Tons)
- Market Share & Analysis
- By Well Type- (USD Million & Thousand Tons)
- By Product Type- (USD Million & Thousand Tons)
- By Sales Channel- (USD Million & Thousand Tons)
- By Application- (USD Million & Thousand Tons)
- Market Size & Analysis
- Market Size & Analysis
- South America Well Stimulation & Cementing Additives Market Outlook, 2022-2032F
- Market Size & Analysis
- By Revenue (USD Million)
- By Volume (Thousand Tons)
- Market Share & Analysis
- By Well Type- (USD Million & Thousand Tons)
- By Product Type- (USD Million & Thousand Tons)
- By Sales Channel- (USD Million & Thousand Tons)
- By Application- (USD Million & Thousand Tons)
- By Country
- Brazil
- Argentina
- Colombia
- Venezuela
- Rest of South America
- Brazil Well Stimulation & Cementing Additives Market Outlook, 2022-2032F
- Market Size & Analysis
- By Revenue (USD Million)
- By Volume (Thousand Tons)
- Market Share & Analysis
- By Well Type- (USD Million & Thousand Tons)
- By Product Type- (USD Million & Thousand Tons)
- By Sales Channel- (USD Million & Thousand Tons)
- By Application- (USD Million & Thousand Tons)
- Market Size & Analysis
- Argentina Well Stimulation & Cementing Additives Market Outlook, 2022-2032F
- Market Size & Analysis
- By Revenue (USD Million)
- By Volume (Thousand Tons)
- Market Share & Analysis
- By Well Type- (USD Million & Thousand Tons)
- By Product Type- (USD Million & Thousand Tons)
- By Sales Channel- (USD Million & Thousand Tons)
- By Application- (USD Million & Thousand Tons)
- Market Size & Analysis
- Colombia Well Stimulation & Cementing Additives Market Outlook, 2022-2032F
- Market Size & Analysis
- By Revenue (USD Million)
- By Volume (Thousand Tons)
- Market Share & Analysis
- By Well Type- (USD Million & Thousand Tons)
- By Product Type- (USD Million & Thousand Tons)
- By Sales Channel- (USD Million & Thousand Tons)
- By Application- (USD Million & Thousand Tons)
- Market Size & Analysis
- Venezuela Well Stimulation & Cementing Additives Market Outlook, 2022-2032F
- Market Size & Analysis
- By Revenue (USD Million)
- By Volume (Thousand Tons)
- Market Share & Analysis
- By Well Type- (USD Million & Thousand Tons)
- By Product Type- (USD Million & Thousand Tons)
- By Sales Channel- (USD Million & Thousand Tons)
- By Application- (USD Million & Thousand Tons)
- Market Size & Analysis
- Market Size & Analysis
- Europe Well Stimulation & Cementing Additives Market Outlook, 2022-2032F
- Market Size & Analysis
- By Revenue (USD Million)
- By Volume (Thousand Tons)
- Market Share & Analysis
- By Well Type- (USD Million & Thousand Tons)
- By Product Type- (USD Million & Thousand Tons)
- By Sales Channel- (USD Million & Thousand Tons)
- By Application- (USD Million & Thousand Tons)
- By Country
- The UK
- Germany
- Russia
- Norway
- Italy
- Rest of Europe
- The UK Well Stimulation & Cementing Additives Market Outlook, 2022-2032F
- Market Size & Analysis
- By Revenue (USD Million)
- By Volume (Thousand Tons)
- Market Share & Analysis
- By Well Type- (USD Million & Thousand Tons)
- By Product Type- (USD Million & Thousand Tons)
- By Sales Channel- (USD Million & Thousand Tons)
- By Application- (USD Million & Thousand Tons)
- Market Size & Analysis
- Germany Well Stimulation & Cementing Additives Market Outlook, 2022-2032F
- Market Size & Analysis
- By Revenue (USD Million)
- By Volume (Thousand Tons)
- Market Share & Analysis
- By Well Type- (USD Million & Thousand Tons)
- By Product Type- (USD Million & Thousand Tons)
- By Sales Channel- (USD Million & Thousand Tons)
- By Application- (USD Million & Thousand Tons)
- Market Size & Analysis
- Russia Well Stimulation & Cementing Additives Market Outlook, 2022-2032F
- Market Size & Analysis
- By Revenue (USD Million)
- By Volume (Thousand Tons)
- Market Share & Analysis
- By Well Type- (USD Million & Thousand Tons)
- By Product Type- (USD Million & Thousand Tons)
- By Sales Channel- (USD Million & Thousand Tons)
- By Application- (USD Million & Thousand Tons)
- Market Size & Analysis
- Norway Well Stimulation & Cementing Additives Market Outlook, 2022-2032F
- Market Size & Analysis
- By Revenue (USD Million)
- By Volume (Thousand Tons)
- Market Share & Analysis
- By Well Type- (USD Million & Thousand Tons)
- By Product Type- (USD Million & Thousand Tons)
- By Sales Channel- (USD Million & Thousand Tons)
- By Application- (USD Million & Thousand Tons)
- Market Size & Analysis
- Italy Well Stimulation & Cementing Additives Market Outlook, 2022-2032F
- Market Size & Analysis
- By Revenue (USD Million)
- By Volume (Thousand Tons)
- Market Share & Analysis
- By Well Type- (USD Million & Thousand Tons)
- By Product Type- (USD Million & Thousand Tons)
- By Sales Channel- (USD Million & Thousand Tons)
- By Application- (USD Million & Thousand Tons)
- Market Size & Analysis
- Market Size & Analysis
- Middle East & Africa Well Stimulation & Cementing Additives Market Outlook, 2022-2032F
- Market Size & Analysis
- By Revenue (USD Million)
- By Volume (Thousand Tons)
- Market Share & Analysis
- By Well Type- (USD Million & Thousand Tons)
- By Product Type- (USD Million & Thousand Tons)
- By Sales Channel- (USD Million & Thousand Tons)
- By Application- (USD Million & Thousand Tons)
- By Country
- Saudi Arabia
- UAE
- Iraq
- Qatar
- Kuwait
- South Africa
- Nigeria
- Rest of Middle East & Africa
- Saudi Arabia Well Stimulation & Cementing Additives Market Outlook, 2022-2032F
- Market Size & Analysis
- By Revenue (USD Million)
- By Volume (Thousand Tons)
- Market Share & Analysis
- By Well Type- (USD Million & Thousand Tons)
- By Product Type- (USD Million & Thousand Tons)
- By Sales Channel- (USD Million & Thousand Tons)
- By Application- (USD Million & Thousand Tons)
- Market Size & Analysis
- UAE Well Stimulation & Cementing Additives Market Outlook, 2022-2032F
- Market Size & Analysis
- By Revenue (USD Million)
- By Volume (Thousand Tons)
- Market Share & Analysis
- By Well Type- (USD Million & Thousand Tons)
- By Product Type- (USD Million & Thousand Tons)
- By Sales Channel- (USD Million & Thousand Tons)
- By Application- (USD Million & Thousand Tons)
- Market Size & Analysis
- Iraq Well Stimulation & Cementing Additives Market Outlook, 2022-2032F
- Market Size & Analysis
- By Revenue (USD Million)
- By Volume (Thousand Tons)
- Market Share & Analysis
- By Well Type- (USD Million & Thousand Tons)
- By Product Type- (USD Million & Thousand Tons)
- By Sales Channel- (USD Million & Thousand Tons)
- By Application- (USD Million & Thousand Tons)
- Market Size & Analysis
- Qatar Well Stimulation & Cementing Additives Market Outlook, 2022-2032F
- Market Size & Analysis
- By Revenue (USD Million)
- By Volume (Thousand Tons)
- Market Share & Analysis
- By Well Type- (USD Million & Thousand Tons)
- By Product Type- (USD Million & Thousand Tons)
- By Sales Channel- (USD Million & Thousand Tons)
- By Application- (USD Million & Thousand Tons)
- Market Size & Analysis
- Kuwait Well Stimulation & Cementing Additives Market Outlook, 2022-2032F
- Market Size & Analysis
- By Revenue (USD Million)
- By Volume (Thousand Tons)
- Market Share & Analysis
- By Well Type- (USD Million & Thousand Tons)
- By Product Type- (USD Million & Thousand Tons)
- By Sales Channel- (USD Million & Thousand Tons)
- By Application- (USD Million & Thousand Tons)
- Market Size & Analysis
- Egypt Well Stimulation & Cementing Additives Market Outlook, 2022-2032F
- Market Size & Analysis
- By Revenue (USD Million)
- By Volume (Thousand Tons)
- Market Share & Analysis
- By Well Type- (USD Million & Thousand Tons)
- By Product Type- (USD Million & Thousand Tons)
- By Sales Channel- (USD Million & Thousand Tons)
- By Application- (USD Million & Thousand Tons)
- Market Size & Analysis
- Nigeria Well Stimulation & Cementing Additives Market Outlook, 2022-2032F
- Market Size & Analysis
- By Revenue (USD Million)
- By Volume (Thousand Tons)
- Market Share & Analysis
- By Well Type- (USD Million & Thousand Tons)
- By Product Type- (USD Million & Thousand Tons)
- By Sales Channel- (USD Million & Thousand Tons)
- By Application- (USD Million & Thousand Tons)
- Market Size & Analysis
- Market Size & Analysis
- Asia-Pacific Well Stimulation & Cementing Additives Market Outlook, 2022-2032F
- Market Size & Analysis
- By Revenue (USD Million)
- By Volume (Thousand Tons)
- Market Share & Analysis
- By Well Type- (USD Million & Thousand Tons)
- By Product Type- (USD Million & Thousand Tons)
- By Sales Channel- (USD Million & Thousand Tons)
- By Application- (USD Million & Thousand Tons)
- By Country
- China
- India
- Kazakhstan
- Indonesia
- Australia
- Rest of Asia Pacific
- China Well Stimulation & Cementing Additives Market Outlook, 2022-2032F
- Market Size & Analysis
- By Revenue (USD Million)
- By Volume (Thousand Tons)
- Market Share & Analysis
- By Well Type- (USD Million & Thousand Tons)
- By Product Type- (USD Million & Thousand Tons)
- By Sales Channel- (USD Million & Thousand Tons)
- By Application- (USD Million & Thousand Tons)
- Market Size & Analysis
- India Well Stimulation & Cementing Additives Market Outlook, 2022-2032F
- Market Size & Analysis
- By Revenue (USD Million)
- By Volume (Thousand Tons)
- Market Share & Analysis
- By Well Type- (USD Million & Thousand Tons)
- By Product Type- (USD Million & Thousand Tons)
- By Sales Channel- (USD Million & Thousand Tons)
- By Application- (USD Million & Thousand Tons)
- Market Size & Analysis
- Kazakhstan Well Stimulation & Cementing Additives Market Outlook, 2022-2032F
- Market Size & Analysis
- By Revenue (USD Million)
- By Volume (Thousand Tons)
- Market Share & Analysis
- By Well Type- (USD Million & Thousand Tons)
- By Product Type- (USD Million & Thousand Tons)
- By Sales Channel- (USD Million & Thousand Tons)
- By Application- (USD Million & Thousand Tons)
- Market Size & Analysis
- Indonesia Well Stimulation & Cementing Additives Market Outlook, 2022-2032F
- Market Size & Analysis
- By Revenue (USD Million)
- By Volume (Thousand Tons)
- Market Share & Analysis
- By Well Type- (USD Million & Thousand Tons)
- By Product Type- (USD Million & Thousand Tons)
- By Sales Channel- (USD Million & Thousand Tons)
- By Application- (USD Million & Thousand Tons)
- Market Size & Analysis
- Australia Well Stimulation & Cementing Additives Market Outlook, 2022-2032F
- Market Size & Analysis
- By Revenue (USD Million)
- By Volume (Thousand Tons)
- Market Share & Analysis
- By Well Type- (USD Million & Thousand Tons)
- By Product Type- (USD Million & Thousand Tons)
- By Sales Channel- (USD Million & Thousand Tons)
- By Application- (USD Million & Thousand Tons)
- Market Size & Analysis
- Market Size & Analysis
- Global Well Stimulation & Cementing Additives Market Key Strategic Imperatives for Success & Growth
- 18.Competitive Landscape
- Comparison of Competitor Products (Product Properties, Applications, and Technical Insights) & their Properties with the Competitors
- Evaluation of Competitor’s Target Markets Based on Their Products
- Evaluation of Target Markets (Product Vs Geography Mix)
- Identification of Off takers, Contractors and Customers (any other entity with the potential to purchase the target products) in the Finalized Geographies
- Competition Outlook
- Company Profiles
- Dow Chemical
- Business Description
- Product Portfolio
- Strategic Alliances or Partnerships
- Recent Developments
- Financial Details
- Others
- Schlumberger
- Business Description
- Product Portfolio
- Strategic Alliances or Partnerships
- Recent Developments
- Financial Details
- Others
- Halliburton
- Business Description
- Product Portfolio
- Strategic Alliances or Partnerships
- Recent Developments
- Financial Details
- Others
- Baker Hughes
- Business Description
- Product Portfolio
- Strategic Alliances or Partnerships
- Recent Developments
- Financial Details
- Others
- Weatherford International
- Business Description
- Product Portfolio
- Strategic Alliances or Partnerships
- Recent Developments
- Financial Details
- Others
- Clariant
- Business Description
- Product Portfolio
- Strategic Alliances or Partnerships
- Recent Developments
- Financial Details
- Others
- BASF SE
- Business Description
- Product Portfolio
- Strategic Alliances or Partnerships
- Recent Developments
- Financial Details
- Others
- Solvay
- Business Description
- Product Portfolio
- Strategic Alliances or Partnerships
- Recent Developments
- Financial Details
- Others
- Evonik Industries
- Business Description
- Product Portfolio
- Strategic Alliances or Partnerships
- Recent Developments
- Financial Details
- Others
- Arkema
- Business Description
- Product Portfolio
- Strategic Alliances or Partnerships
- Recent Developments
- Financial Details
- Others
- SNF Group
- Business Description
- Product Portfolio
- Strategic Alliances or Partnerships
- Recent Developments
- Financial Details
- Others
- Innospec Oilfield Services
- Business Description
- Product Portfolio
- Strategic Alliances or Partnerships
- Recent Developments
- Financial Details
- Others
- CES Energy Solutions
- Business Description
- Product Portfolio
- Strategic Alliances or Partnerships
- Recent Developments
- Financial Details
- Others
- Dorf Ketal
- Business Description
- Product Portfolio
- Strategic Alliances or Partnerships
- Recent Developments
- Financial Details
- Others
- Croda Energy Technologies
- Business Description
- Product Portfolio
- Strategic Alliances or Partnerships
- Recent Developments
- Financial Details
- Others
- Lubrizol
- Business Description
- Product Portfolio
- Strategic Alliances or Partnerships
- Recent Developments
- Financial Details
- Others
- Others
- Dow Chemical
- Company Profiles
- Disclaimer
MarkNtel Advisors follows a robust and iterative research methodology designed to ensure maximum accuracy and minimize deviation in market estimates and forecasts. Our approach combines both bottom-up and top-down techniques to effectively segment and quantify various aspects of the market. A consistent feature across all our research reports is data triangulation, which examines the market from three distinct perspectives to validate findings. Key components of our research process include:
1. Scope & Research Design At the outset, MarkNtel Advisors define the research objectives and formulate pertinent questions. This phase involves determining the type of research—qualitative or quantitative—and designing a methodology that outlines data collection methods, target demographics, and analytical tools. They also establish timelines and budgets to ensure the research aligns with client goals.
2. Sample Selection and Data Collection In this stage, the firm identifies the target audience and determines the appropriate sample size to ensure representativeness. They employ various sampling methods, such as random or stratified sampling, based on the research objectives. Data collection is carried out using tools like surveys, interviews, and observations, ensuring the gathered data is reliable and relevant.
3. Data Analysis and Validation Once data is collected, MarkNtel Advisors undertake a rigorous analysis process. This includes cleaning the data to remove inconsistencies, employing statistical software for quantitative analysis, and thematic analysis for qualitative data. Validation steps are taken to ensure the accuracy and reliability of the findings, minimizing biases and errors.

4. Data Forecast and FinalizationThe final phase involves forecasting future market trends based on the analyzed data. MarkNtel Advisors utilize predictive modeling and time series analysis to anticipate market behaviors. The insights are then compiled into comprehensive reports, featuring visual aids like charts and graphs, and include strategic recommendations to inform client decision-making
We offer flexible licensing options to cater to varying organizational needs. Choose the pricing pack that best suits your requirements:
Buy Now

