
Russia Specialty Fertilizers Market Research Report: Forecast (2026–2032)
Russia Specialty Fertilizers Market - By Product Type (Controlled Release Fertilizers, Specialty Nitrogen Fertilizers, Micronutrient Fertilizers, Compound Fertilizers, Organic Fert ... ilizers, Others), By Application Method (Soil Application, Foliar Application, Fertigation, Others), By Crop Type (Cereals & Grains, Oilseeds & Pulses, Fruits & Vegetables, Others), By Distribution Channel (Agro Dealers, Hypermarkets/Supermarkets, Specialty Stores, Online Retail, Others), By End-User (Commercial Agriculture, Horticulture & Floriculture, Organic Farms, Others), and others Read more
- Environment
- Nov 2025
- Pages 138
- Report Format: PDF, Excel, PPT
Russia Specialty Fertilizers Market
Projected 8.92% CAGR from 2026 to 2032
Study Period
2026-2032
Market Size (2025)
USD 1.21 Billion
Market Size (2032)
USD 2.20 Billion
Base Year
2025
Projected CAGR
8.92%
Leading Segments
USD 1.21 billion
Russia Specialty Fertilizers Market Size: Forecast (2026-2032)
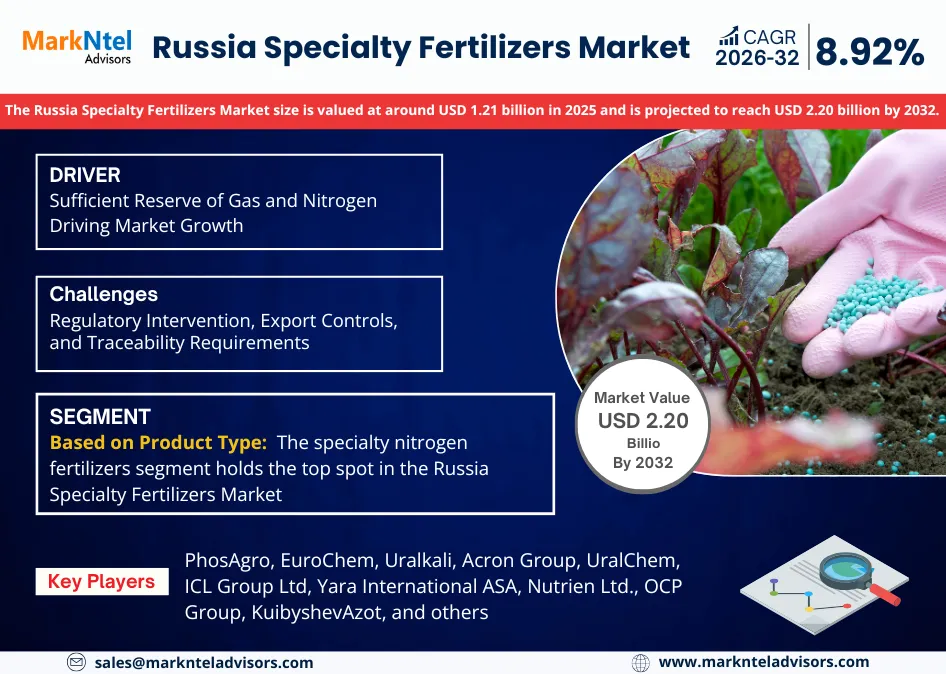
The Russia Specialty Fertilizers Market size is valued at around USD 1.21 billion in 2025 and is projected to reach USD 2.20 billion by 2032. Along with this, the market is estimated to grow at a CAGR of around 8.92% during the forecast period, i.e., 2026-32.
Russia Specialty Fertilizers Market Outlook:
Russia Specialty Fertilizer Market is growing steadily due to favorable government policies, abundant feedstock, and expanding export opportunities. In March 2025, the Russian government set a fertilizer export quota of approximately 20 million tons for June–November, comprising around 12.3 million tons of nitrogen and 7.6 million tons of complex fertilizers. These measures, alongside regulatory tariffs and quotas promoting domestic processing, highlight efforts to diversify export destinations while strengthening local resilience. Access to inexpensive natural gas and nitrogen feedstocks provides a cost advantage for producing complex fertilizers, encouraging innovation in high-value specialty lines. In the first five months of 2025, PhosAgro reported a 10% increase in exports, totaling about 4.3 million tons, including roughly 1 million tons to India.
Government-backed digitalization and traceability initiatives, such as pilot labeling schemes for mineral fertilizers launched in late 2025, are enhancing quality assurance and regulatory compliance. Meanwhile, Russian producers are targeting BRICS countries, Asia, and Latin America, tailoring specialized formulations to meet regional agronomic needs. These policies have stimulated investment in advanced fertilizer technologies, despite temporary constraints from regulatory measures.
Overall, the industry is transitioning from a bulk commodity focus toward a value-driven specialty fertilizer ecosystem characterized by higher margins, product innovation, and improved quality control. With strong state policy alignment, technical advancements, and expanding international demand, Russia’s specialty fertilizer sector is well-positioned for sustained long-term growth, supporting both domestic agricultural modernization and global market diversification.
Russia Specialty Fertilizers Market Recent Developments:
- August 2025: In the first half of 2025, Russia boosted its fertilizer exports to India by 20%, totaling 2.5 million tonnes. This volume accounted for roughly one-third (33%) of India’s overall fertilizer imports during the same period, reflecting Russia’s strengthened presence in the Indian agricultural input market and its growing role as a key supplier in global fertilizer trade.
Russia Specialty Fertilizers Market Scope:
| Category | Segments |
|---|---|
| By Product Type | Controlled Release Fertilizers, Specialty Nitrogen Fertilizers, Micronutrient Fertilizers, Compound Fertilizers, Organic Fertilizers, Others), |
| By Application Method | Soil Application, Foliar Application, Fertigation, Others), |
| By Crop Type | Cereals & Grains, Oilseeds & Pulses, Fruits & Vegetables, Others), |
| By Distribution Channel | Agro Dealers, Hypermarkets/Supermarkets, Specialty Stores, Online Retail, Others), |
| By End-User | Commercial Agriculture, Horticulture & Floriculture, Organic Farms, Others), and others |
Russia Specialty Fertilizers Market Drivers:
Sufficient Reserve of Gas and Nitrogen Driving Market Growth
One of the main factors propelling the Russia Specialty Fertilizers Market Growth is the feedstock advantage from domestic gas and nitrogen capacity. According to OPEC’s 2025 Annual Statistical Bulletin, Russia’s proven natural gas reserves stood at 1,654 trillion cubic feet (Tcf) in 2023–2024. Preliminary estimates indicate that dry natural gas production reached 23.2 Tcf in 2024, up 7% from 21.7 Tcf in 2023. This abundant and reliable gas supply underpins Russia’s position as a leading fertilizer producer, as natural gas is a primary feedstock for nitrogen-based fertilizers.
The Russian Government’s Energy Strategy 2035 emphasizes the expansion and modernization of gas infrastructure, ensuring consistent feedstock availability for domestic fertilizer plants even amid export challenges. This stability enables the growth of high-performance nitrogen-based specialty fertilizers, including urea ammonium nitrate (UAN) and slow-release nitrogen variants, while supporting competitive pricing in both domestic and international markets. By leveraging its substantial gas and nitrogen resources, Russia strengthens production efficiency, sustains market competitiveness, and fosters global expansion in the specialty fertilizer segment. The combination of abundant feedstock, infrastructure support, and strategic policy initiatives underpins the country’s leadership in nitrogen-based fertilizer production.
Export Diversification and Regional Trade Realignment
Export diversification and regional trade realignment are driving the Russia Specialty Fertilizer industry. Between January and October 2024, Russia exported around 3.4 million metric tonnes of fertilizers to India, representing 28% of the country’s total imports. Overall, Russian fertilizer exports reached USD13.9 billion in 2024, accounting for 16.6% of global fertilizer exports.
Government initiatives, including the “Strategy for the Development of the Chemical and Petrochemical Industry 2030,” support long-term trade relationships through export promotion programs, logistical infrastructure investments, and currency settlement agreements with BRICS nations. Leading producers like PhosAgro and Acron Group are establishing distribution hubs in China, Brazil, and India, offering tailored fertilizer formulations adapted to local soil and crop requirements. This strategic realignment not only mitigates risks associated with Western market restrictions but also strengthens Russia’s role as a reliable global supplier of specialty fertilizers. By expanding into high-demand emerging markets and optimizing distribution channels, Russian producers enhance export resilience, improve market penetration, and sustain long-term growth amid shifting global trade dynamics.
Russia Specialty Fertilizers Market Trends:
Reorientation to Higher Value Specialty and Formulated Products
The reorientation to higher value specialty and formulated products is the new trend that is surging the Russia Specialty Fertilizers Share in order to capture profits and meet changing market and governmental needs. In 2024, PhosAgro Group reported a notable 10.2% rise in production of complex NPK fertilizers, reaching 3.859 million tonnes, with its portfolio expanding to 58 distinct grades, including enhanced-efficiency and micronutrient-enriched formulations. This move reflects a strategic pivot toward higher-value, tailored fertilizer solutions that meet specific crop requirements while offering improved margins compared to traditional commodity products. Similarly, in Q3 2024, EuroChem Group inaugurated a 70,000 t/year water-soluble fertilizer facility in Russia, representing an investment of approximately USD81 million. The plant is designed to serve export markets in Asia, Latin America, and Central America, emphasizing the country’s shift toward value-added fertilizers.
Russian producers are increasingly focusing on specialty and formulated fertilizers rather than conventional urea or potash. By doing so, they can differentiate their offerings, enhance crop-specific nutrition, and create a more resilient product mix capable of withstanding pricing fluctuations and market volatility. Scaling these advanced fertilizer lines also strengthens Russia’s competitive position in global agricultural markets, meeting the growing demand for premium, high-performance products in advanced farming sectors.
Digitalisation and Traceability Gaining Momentum
Digitalisation and traceability are changing the landscape of Russia’s Specialty Fertilizer market as they facilitate the production of higher-value products, improving transparency, and strengthening regulatory compliance. In December 2024, the Russian government committed over USD37.32 million toward the digitalization of the agriculture and fisheries sectors, funding initiatives that integrate AI, IoT sensors, and satellite-based data collection. Building on this, in October 2025, the Ministry of Industry and Trade launched a pilot digital labeling program for consumer-pack fertilizers, including nitrates, potassium phosphates, and other specialty formulations, providing unique digital identifiers to track origin, composition, and quality.
These digital tools allow producers to develop premium fertilizers, such as micronutrient-enhanced blends and coated products, with verifiable provenance. By adopting traceability-enabled systems, manufacturers can strengthen export credibility, improve value creation, and enhance consumer confidence in the agri-input sector. Smart packaging and data-linked monitoring further support compliance, reduce counterfeiting risks, and facilitate access to high-margin domestic and international markets. Collectively, digitalization and traceability are establishing the foundation for a more sophisticated, value-added specialty fertilizer industry in Russia, reinforcing both competitiveness and sustainability.
Russia Specialty Fertilizers Market Challenges:
Regulatory Intervention, Export Controls, and Traceability Requirements
The regulatory interventions, export controls, and traceability requirements have emerged as significant challenges in the Russian Specialty Fertilizer Industry. Rules governing nitrogen, phosphate, and potash exports, coupled with mandatory compliance and reporting obligations, restrict producers’ operational flexibility and may slow the flow of international shipments. Export limitations designed to protect domestic supply can reduce access to lucrative overseas markets, impacting revenue potential.
Additionally, evolving traceability mandates require manufacturers to meticulously track product composition, origin, and distribution, raising both administrative and technological costs. Smaller producers, in particular, may find it difficult to adopt these systems efficiently, while delays in certification or reporting can disrupt supply chains and delivery schedules. Together, these regulatory and traceability pressures increase operational complexity, elevate compliance expenditures, and create potential barriers to market expansion, posing a significant challenge to Russia’s specialty fertilizer industry as it seeks to balance domestic needs with international demand.
Russia Specialty Fertilizers Market (2026-32) Segmentation Analysis:
The Russia Specialty Fertilizers Market Report and Forecast 2026-2032 offers a detailed analysis of the market based on the following segments:
Based on Product Type
- Controlled Release Fertilizers
- Specialty Nitrogen Fertilizers
- Micronutrient Fertilizers
- Compound Fertilizers
- Organic Fertilizers
- Others
The specialty nitrogen fertilizers segment holds the top spot in the Russia Specialty Fertilizers Market, with a market share of around 53% of the specialty fertilizer volume. This leadership is a reflection of Russia's extraordinary ability to produce nitrogen as well as the industry's transition toward higher-value nitrogen products like coated urea, stabilized urea, and complex nitrogen blends that fulfill particular agronomic demands and generate larger margins. The main cause is the structural feedstock advantage from scaled ammonia output and plentiful natural gas, which reduces production costs and enables companies to deploy capacity to value-added nitrogen lines.
Russia's integrated fossil fuel and chemical infrastructure, which enables large-scale urea and ammonia factories that enable downstream formulation, is the cause of the feedstock advantage. To service both local and foreign clients, EuroChem and Acron, for example, have announced capacity expansion and increased emphasis on formulated nitrogen portfolios.
Based on Application Method
- Soil Application
- Foliar Application
- Fertigation
- Others
Soil application dominates Russia’s Specialty Fertilizer Industry, accounting for about 65% of applications as the majority of specialist products are made for pre-sowing bands top dressing and broadcast integration, where nutrient interaction with the root zone is crucial. Because the majority of specialist products are made for pre-sowing bands top dressing and broadcast integration, where nutrient interaction with the root zone is crucial, soil application continues to be the most common method.
Large-scale cereal and oilseed cropping depends on soil-applied complex fertilizers for yield response and cost effectiveness as this happens mostly due to agronomic practices and crop mix. Furthermore, broadacre agriculture still favors soil-applied specialty, while foliar and fertigation techniques are confined in horticulture and high-value crops due to to the geographical limitations of irrigation-based fertigation infrastructure. For example, instead of fertigation systems, large supplies of potash and NPK are sent to regional distributors for soil treatment in the grain belt.
Leading Manufacturers of the Russia Specialty Fertilizers Market:
- PhosAgro
PhosAgro was founded in the early 2000s, is a vertically integrated phosphate manufacturer with its headquarters located in Moscow. The Apatit firm in the Murmansk area, which provides phosphate rock for downstream phosphate fertilizers and feed phosphates, is one of the mining and processing assets under the group's management. PhosAgro supplies both industrial and agricultural phosphates and specializes in phosphate-based products such as micronutrient boosted mixes and MAP DAP monoammonium phosphate grades.
- EuroChem
EuroChem Group was founded in the 2000s, has substantial production assets in Russia, but currently has its headquarters in Zug, Switzerland. The firm has invested in sophisticated NPK and specialized nitrogen lines, as well as global distribution networks, and it possesses extensive capabilities in nitrogen, phosphate, and potash. In order to provide NPK and coated products that meet agronomic requirements in various climates, it concentrates on integrated manufacturing from mineral extraction to chemical conversion.
- Uralkali
Uralkali, operating from its headquarters in Berezniki, Perm Krai, has mining and ore treatment assets across the Verkhnekamskoye deposit. The company's industrial roots date back to the Soviet period. The firm is the largest producer of potash in Russia and specializes in potassium chloride (KCl) and related potash products, which are essential ingredients in compound NPK fertilizers and custom formulations. Large-scale mining, effective ore treatment, and international potash logistics are Uralkali's areas of expertise.
Acron Group, UralChem, ICL Group Ltd., Yara International ASA, Nutrien Ltd., OCP Group, KuibyshevAzot, and others are the key players of the Russian Specialty Fertilizers Market.
Russia Specialty Fertilizers Market (2026-32): Regional Projection
The Russia Specialty Fertilizers Market is dominated by the Volga, Ural, and Siberian regions since they have the greatest mineral deposit production complexes and fertilizer manufacturing clusters that feed both local agriculture and exports. With significant factories and logistical infrastructure that facilitate downstream formulation and transportation, the Volga and Ural areas are centers for potash and nitrogen.
Phosphate and feedstock are supplied by Siberia and the Far East, which also facilitate export routes to Asia, boosting regionalized specialist manufacture. The root cause is a long-standing industrial concentration that combines port connections, chemical processing capabilities, and mineral resource endowments. For instance, large-scale potash and NPK formulation activity that serves important export markets is supported by Uralkali and EuroChem assets in the Perm Krai Volga and surrounding zones.
Gain a Competitive Edge with Our Russia Specialty Fertilizers Market Report
- Russia Specialty Fertilizers Market Report by MarkNtel Advisors provides a detailed & thorough analysis of market size & share, growth rate, competitive landscape, and key players. This comprehensive analysis helps businesses gain a holistic understanding of the market dynamics & make informed decisions.
- This report also highlights current market trends & future projections, allowing businesses to identify emerging opportunities & potential challenges. By understanding market forecasts, companies can align their strategies & stay ahead of the competition.
- Russia Specialty Fertilizers Market Report aids in assessing & mitigating risks associated with entering or operating in the market. By understanding market dynamics, regulatory frameworks, and potential challenges, businesses can develop strategies to minimize risks & optimize their operations.
*Reports Delivery Format - Market research studies from MarkNtel Advisors are offered in PDF, Excel and PowerPoint formats. Within 24 hours of the payment being successfully received, the report will be sent to your email address.
Frequently Asked Questions
- Market Segmentation
- Introduction
- Product Definition
- Research Process
- Assumptions
- Executive Summary
- Russia Specialty Fertilizers Market Policies, Regulations, and Product Standards
- Russia Specialty Fertilizers Market Supply Chain Analysis
- Russia Specialty Fertilizers Market Trends & Developments
- Russia Specialty Fertilizers Market Dynamics
- Growth Drivers
- Challenges
- Russia Specialty Fertilizers Market Hotspot & Opportunities
- Russia Specialty Fertilizers Market Outlook, 2022-2032
- Market Size & Outlook
- By Revenues (USD Million)
- By Volume (Million Tons)
- By Quantity Sold (Thousand Tons)
- Market Share & Outlook
- By Product Type – Market Size & Forecast 2022-2032, USD Million & Million Tons
- Controlled Release Fertilizers – Market Size & Forecast 2022-2032, USD Million & Million Tons
- Specialty Nitrogen Fertilizers– Market Size & Forecast 2022-2032, USD Million & Million Tons
- Micronutrient Fertilizers – Market Size & Forecast 2022-2032, USD Million & Million Tons
- Compound Fertilizers – Market Size & Forecast 2022-2032, USD Million & Million Tons
- Organic Fertilizers– Market Size & Forecast 2022-2032, USD Million & Million Tons
- Others – Market Size & Forecast 2022-2032, USD Million & Million Tons
- By Application Method – Market Size & Forecast 2022-2032, USD Million & Million Tons
- Soil Application – Market Size & Forecast 2022-2032, USD Million & Million Tons
- Foliar Application – Market Size & Forecast 2022-2032, USD Million & Million Tons
- Fertigation – Market Size & Forecast 2022-2032, USD Million & Million Tons
- Others – Market Size & Forecast 2022-2032, USD Million & Million Tons
- By Crop Type– Market Size & Forecast 2022-2032, USD Million & Million Tons
- Cereals & Grains – Market Size & Forecast 2022-2032, USD Million & Million Tons
- Oilseeds & Pulses – Market Size & Forecast 2022-2032, USD Million & Million Tons
- Fruits & Vegetables – Market Size & Forecast 2022-2032, USD Million & Million Tons
- Others – Market Size & Forecast 2022-2032, USD Million & Million Tons
- By Distribution Channel– Market Size & Forecast 2022-2032, USD Million & Million Tons
- Agro Dealers – Market Size & Forecast 2022-2032, USD Million & Million Tons
- Hypermarkets/Supermarkets– Market Size & Forecast 2022-2032, USD Million & Million Tons
- Specialty Stores – Market Size & Forecast 2022-2032, USD Million & Million Tons
- Online Retail – Market Size & Forecast 2022-2032, USD Million & Million Tons
- Others– Market Size & Forecast 2022-2032, USD Million & Million Tons
- By End-User– Market Size & Forecast 2022-2032, USD Million & Million Tons
- Commercial Agriculture– Market Size & Forecast 2022-2032, USD Million & Million Tons
- Horticulture & Floriculture– Market Size & Forecast 2022-2032, USD Million & Million Tons
- Organic Farms– Market Size & Forecast 2022-2032, USD Million & Million Tons
- Others – Market Size & Forecast 2022-2032, USD Million & Million Tons
- By Region
- Central Russia
- Southern Russia
- Volga Region
- Siberia
- Northwest
- Ural
- Far East
- Others
- By Company
- Company Revenue Shares
- Competitor Characteristics
- By Product Type – Market Size & Forecast 2022-2032, USD Million & Million Tons
- Market Size & Outlook
- Russia Controlled Release Fertilizers Market Outlook, 2022-2032
- Market Size & Outlook
- By Revenues (USD Million) – Market Size & Forecast 2022-2032, USD Million & Million Tons
- By Volume (Million Tons) – Market Size & Forecast 2022-2032, USD Million & Million Tons
- Market Share & Analysis
- By Application Mode – Market Size & Forecast 2022-2032, USD Million & Million Tons
- By Distribution Channel– Market Size & Forecast 2022-2032, USD Million & Million Tons
- By Region
- Market Size & Outlook
- Russia Specialty Nitrogen Fertilizers Market Outlook, 2022-2032
- Market Size & Outlook
- By Revenues (USD Million) – Market Size & Forecast 2022-2032, USD Million & Million Tons
- By Volume (Million Tons) – Market Size & Forecast 2022-2032, USD Million & Million Tons
- Market Share & Analysis
- By Application Mode – Market Size & Forecast 2022-2032, USD Million & Million Tons
- By Distribution Channel– Market Size & Forecast 2022-2032, USD Million & Million Tons
- By Region
- Market Size & Outlook
- Russia Micronutrient Fertilizers Market Outlook, 2022-2032
- Market Size & Outlook
- By Revenues (USD Million) – Market Size & Forecast 2022-2032, USD Million & Million Tons
- By Volume (Million Tons) – Market Size & Forecast 2022-2032, USD Million & Million Tons
- Market Share & Analysis
- By Application Mode – Market Size & Forecast 2022-2032, USD Million & Million Tons
- By Distribution Channel– Market Size & Forecast 2022-2032, USD Million & Million Tons
- By Region
- Market Size & Outlook
- Russia Compound Fertilizers Market Outlook, 2022-2032
- Market Size & Outlook
- By Revenues (USD Million) – Market Size & Forecast 2022-2032, USD Million & Million Tons
- By Volume (Million Tons) – Market Size & Forecast 2022-2032, USD Million & Million Tons
- Market Share & Analysis
- By Application Mode – Market Size & Forecast 2022-2032, USD Million & Million Tons
- By Distribution Channel– Market Size & Forecast 2022-2032, USD Million & Million Tons
- By Region
- Market Size & Outlook
- Russia Organic Fertilizers Market Outlook, 2022-2032
- Market Size & Outlook
- By Revenues (USD Million) – Market Size & Forecast 2022-2032, USD Million & Million Tons
- By Volume (Million Tons) – Market Size & Forecast 2022-2032, USD Million & Million Tons
- Market Share & Analysis
- By Application Mode – Market Size & Forecast 2022-2032, USD Million & Million Tons
- By Distribution Channel– Market Size & Forecast 2022-2032, USD Million & Million Tons
- By Region
- Market Size & Outlook
- Russia Specialty Fertilizers Market Key Strategic Imperatives for Success & Growth
- Competition Outlook
- Company Profiles
- PhosAgro
- Business Description
- Service Portfolio
- Strategic Alliances or Partnerships
- Recent Developments
- Financial Details
- Others
- EuroChem
- Business Description
- Service Portfolio
- Strategic Alliances or Partnerships
- Recent Developments
- Financial Details
- Others
- Uralkali
- Business Description
- Service Portfolio
- Strategic Alliances or Partnerships
- Recent Developments
- Financial Details
- Others
- Acron Group
- Business Description
- Service Portfolio
- Strategic Alliances or Partnerships
- Recent Developments
- Financial Details
- Others
- Uralchem
- Business Description
- Service Portfolio
- Strategic Alliances or Partnerships
- Recent Developments
- Financial Details
- Others
- ICL Group Ltd.
- Business Description
- Service Portfolio
- Strategic Alliances or Partnerships
- Recent Developments
- Financial Details
- Others
- Yara International ASA
- Business Description
- Service Portfolio
- Strategic Alliances or Partnerships
- Recent Developments
- Financial Details
- Others
- Nutrien Ltd.
- Business Description
- Service Portfolio
- Strategic Alliances or Partnerships
- Recent Developments
- Financial Details
- Others
- OCP Group
- Business Description
- Service Portfolio
- Strategic Alliances or Partnerships
- Recent Developments
- Financial Details
- Others
- KuibyshevAzot
- Business Description
- Service Portfolio
- Strategic Alliances or Partnerships
- Recent Developments
- Financial Details
- Others
- Others
- PhosAgro
- Company Profiles
- Disclaimer
MarkNtel Advisors follows a robust and iterative research methodology designed to ensure maximum accuracy and minimize deviation in market estimates and forecasts. Our approach combines both bottom-up and top-down techniques to effectively segment and quantify various aspects of the market. A consistent feature across all our research reports is data triangulation, which examines the market from three distinct perspectives to validate findings. Key components of our research process include:
1. Scope & Research Design At the outset, MarkNtel Advisors define the research objectives and formulate pertinent questions. This phase involves determining the type of research—qualitative or quantitative—and designing a methodology that outlines data collection methods, target demographics, and analytical tools. They also establish timelines and budgets to ensure the research aligns with client goals.
2. Sample Selection and Data Collection In this stage, the firm identifies the target audience and determines the appropriate sample size to ensure representativeness. They employ various sampling methods, such as random or stratified sampling, based on the research objectives. Data collection is carried out using tools like surveys, interviews, and observations, ensuring the gathered data is reliable and relevant.
3. Data Analysis and Validation Once data is collected, MarkNtel Advisors undertake a rigorous analysis process. This includes cleaning the data to remove inconsistencies, employing statistical software for quantitative analysis, and thematic analysis for qualitative data. Validation steps are taken to ensure the accuracy and reliability of the findings, minimizing biases and errors.

4. Data Forecast and FinalizationThe final phase involves forecasting future market trends based on the analyzed data. MarkNtel Advisors utilize predictive modeling and time series analysis to anticipate market behaviors. The insights are then compiled into comprehensive reports, featuring visual aids like charts and graphs, and include strategic recommendations to inform client decision-making
We offer flexible licensing options to cater to varying organizational needs. Choose the pricing pack that best suits your requirements:
Buy Now

