
Global Peg Esters Market Research Report: Forecast (2026-2032)
Peg Esters Market - By Product Type (Polysorbate 80, Ceteareth-20, Ceteareth-12, PEG-10 Phytosterol, Olive Oil PEG Esters, PEG-10 Rapeseed Sterol, PEG-100 Stearate, PEG-120 Methyl ... Glucose Dioleate, PEG-14M, PEG-150 Distearate, PEG-150 Pentaerythrityl Tetrastearate, PEG-18 Glyceryl Oleate Cocoate, PEG-20 Glyceryl Triisostearate, C12-20 Acid PEG-8 Ester, Glycereth-26, PEG-20 Stearate, PEG-200 Hydrogenated Glyceryl Palmate, PEG-3 Distearate, PEG-30 Dipolyhydroxystearate, PEG-4 Laurate, PEG-4 Rapeseedamide, PEG-40 Hydrogenated Castor Oil, Methoxy PEG-10, Methyl Gluceth-10, Methyl Gluceth-20, PEG-33 Castor Oil, PEG-35 Castor Oil, PEG-40 Stearate, PEG-45M, PEG-55 Propylene Glycol Oleate, PEG-6 Caprylic/Capric Glycerides, PEG-60 Almond Glycerides, PEG-60 Hydrogenated Castor Oil, PEG-8 Isostearate, PEG-8 Laurate, Polysorbate 20, Polysorbate 60, Steareth-12 Stearate, Steareth-21, Trideceth-10), By End User (Personal care, Skin care, Face care, Body care, Hair care, Sun care, Make-up, Make-up remover, Anti-aging creams, Moisturizers, Cleansers/Cleaning oils, Fragrance products, Cosmetics, Household & Homecare, Household cleaning products, Home & personal hygiene products, Food & Beverage, Health & Medical, Pharmaceuticals, Drug creams / medical formulations, Industrial & Manufacturing, Processing aids, Metalworking lubricants, Fiber treatment lubricants, Coatings, Paints & inks, Adhesives, Paper & tissue products, Water-soluble packaging, Textiles (softeners, treatments), Other Applications), and others Read more
- Chemicals
- Dec 2025
- Pages 198
- Report Format: PDF, Excel, PPT
Global Peg Esters Market
Projected 4.86% CAGR from 2026 to 2032
Study Period
2026-2032
Market Size (2026)
2.58 Million Tons
Market Size (2032)
3.43 Million Tons
Largest Region
Asia–Pacific
Projected CAGR
4.86%
Leading Segments
By End User: Personal care
Global Peg Esters Market Report Key Takeaways:
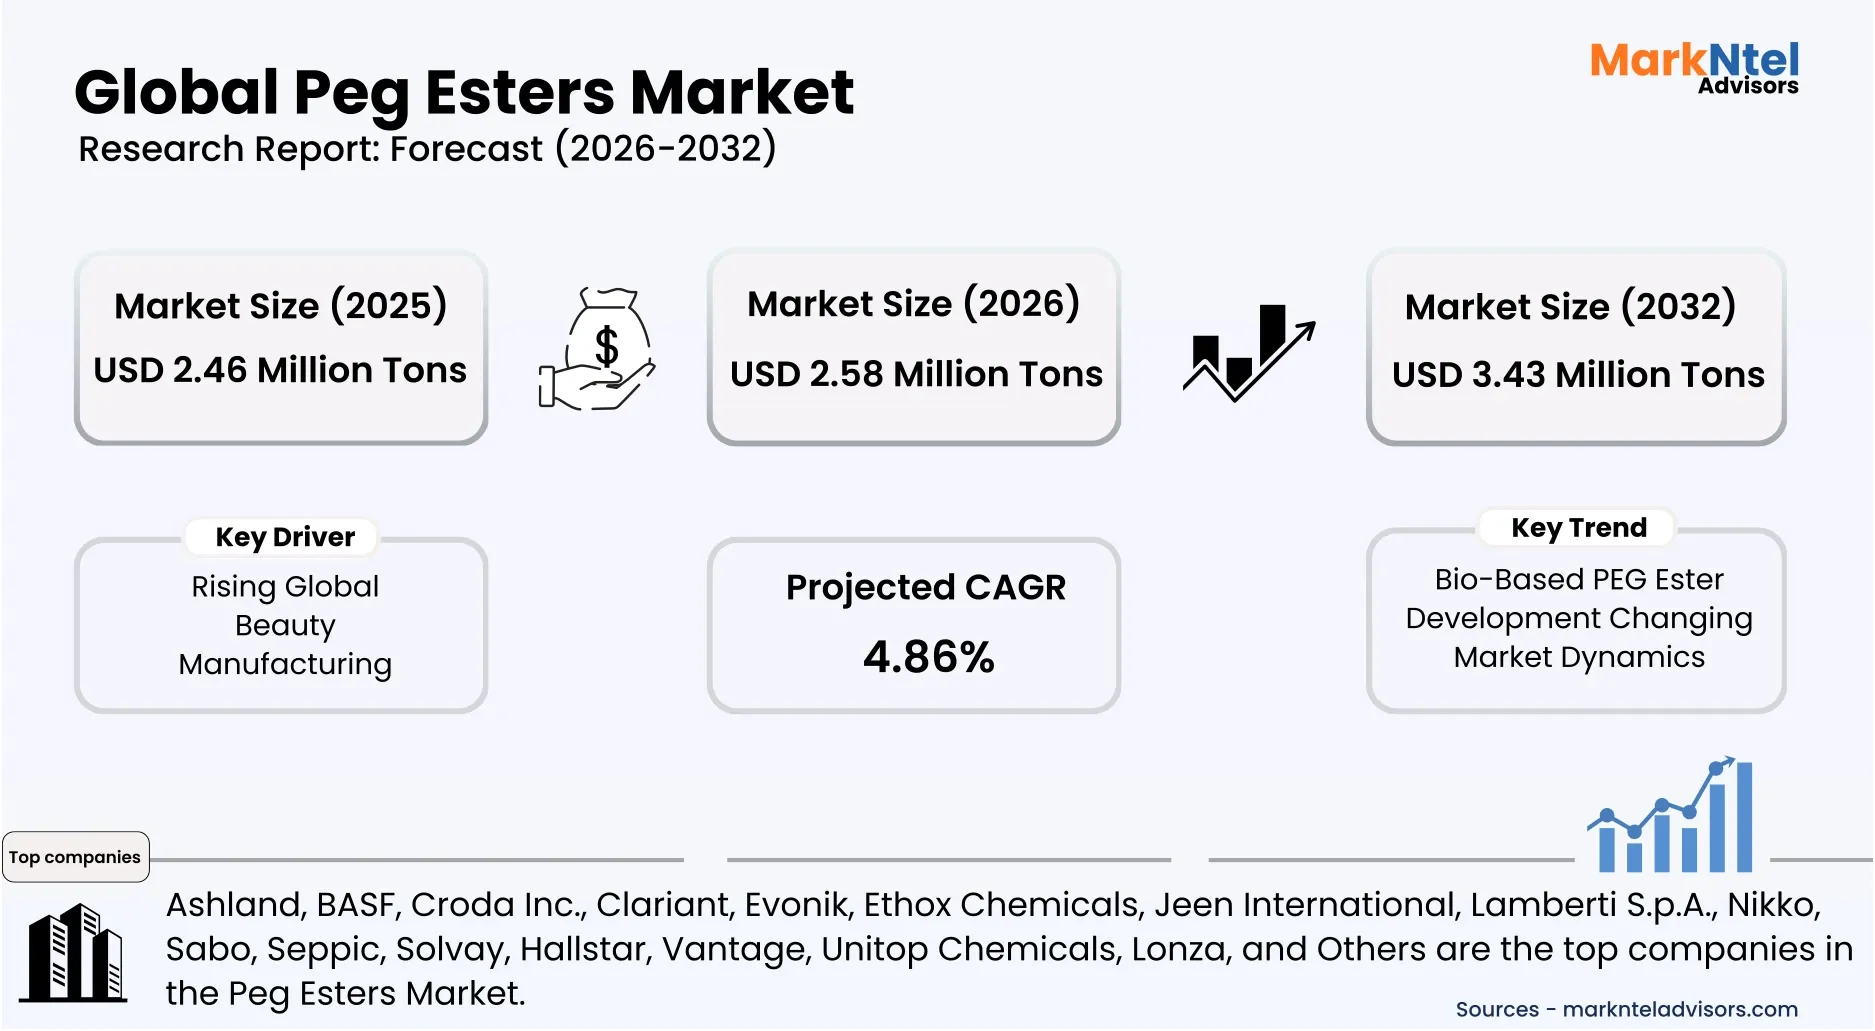
- Market size is valued at around 2.46 million tons in 2025 and is projected to grow 2.58 million tons in 2026 to 3.43 million tons by 2032. The estimated CAGR from 2026 to 2032 is around 4.86%, indicating strong growth.
- Asia Pacific, led by China, dominates the Global PEG Esters Market by accounting for about 46% market share in 2026.
- By Product Type, PEG-40 Hydrogenated Castor Oil represented a significant share of about 33% in the Global Peg Esters Market in 2026. Whereas, Polysorbate 20 & Polysorbate 60 are among the fastest growing products and are expected to grow significantly during 2026-32.
- By End User, the Personal Care segment represented a major share of nearly 32% in the Global Peg Esters Market in 2026.
- Leading Peg Esters companies are Ashland, BASF, Croda Inc., Clariant, Evonik, Ethox Chemicals, Jeen International, Lamberti S.p.A., Nikko, Sabo, Seppic, Solvay, Hallstar, Vantage, Unitop Chemicals, Lonza, and others.
Market Insights & Analysis: Global Peg Esters Market (2026-32):
The Global Peg Esters Market size is valued at around 2.46 million tons in 2025 and is projected to grow 2.58 million tons in 2026 to 3.43 million tons by 2032. Along with this, the market is estimated to grow at a CAGR of around 4.86% during the forecast period, i.e., 2026-32.
The Global PEG Esters Market is witnessing steady momentum as personal care, pharmaceuticals, and food-grade emulsifiers increasingly rely on mild, multifunctional surfactants. For instance, the U.S. FDA continues to classify several PEG ester derivatives as safe for use in food additives and topical pharmaceuticals, supporting their long-term industrial relevance.
Additionally, demand growth aligns with the expansion of cosmetic manufacturing. For reference, L’Oréal reported USD44.47 billion in sales in 2023, reflecting the scale of global beauty production that heavily depends on PEG-based emulsifiers and solubilizers in creams, lotions, and cleansers.
Similarly, innovation within specialty chemicals is strengthening PEG ester adoption. Evonik’s announcement in 2024 to commercialize randomized PEG (rPEG) lipids for drug-delivery systems shows how PEG-based materials are moving into advanced pharma applications. Likewise, Croda’s recent expansion of its drug-delivery excipient capacity reinforces the shift toward high-purity PEG derivatives demanded in regulated markets.
Moreover, regulatory pressures are also shaping market transitions. For reference, California’s Department of Toxic Substances Control (DTSC) continues to highlight concerns such as 1,4-dioxane residues in ethoxylated surfactants, pushing companies to develop cleaner PEG ester grades through purification and process optimization.
Overall, the PEG esters market is evolving from commodity emulsifiers toward high-value, compliance-driven, and innovation-led applications. Companies with capabilities in purity control, specialty formulations, and pharmaceutical-grade PEG technologies are positioned to gain the most as global end-use sectors expand.
Global Peg Esters Market Scope:
| Category | Segments |
|---|---|
| By Product Type | Polysorbate 80, Ceteareth-20, Ceteareth-12, PEG-10 Phytosterol, Olive Oil PEG Esters, PEG-10 Rapeseed Sterol, PEG-100 Stearate, PEG-120 Methyl Glucose Dioleate, PEG-14M, PEG-150 Distearate, PEG-150 Pentaerythrityl Tetrastearate, PEG-18 Glyceryl Oleate Cocoate, PEG-20 Glyceryl Triisostearate, C12-20 Acid PEG-8 Ester, Glycereth-26, PEG-20 Stearate, PEG-200 Hydrogenated Glyceryl Palmate, PEG-3 Distearate, PEG-30 Dipolyhydroxystearate, PEG-4 Laurate, PEG-4 Rapeseedamide, PEG-40 Hydrogenated Castor Oil, Methoxy PEG-10, Methyl Gluceth-10, Methyl Gluceth-20, PEG-33 Castor Oil, PEG-35 Castor Oil, PEG-40 Stearate, PEG-45M, PEG-55 Propylene Glycol Oleate, PEG-6 Caprylic/Capric Glycerides, PEG-60 Almond Glycerides, PEG-60 Hydrogenated Castor Oil, PEG-8 Isostearate, PEG-8 Laurate, Polysorbate 20, Polysorbate 60, Steareth-12 Stearate, Steareth-21, Trideceth-10), and others |
| By End User | (Personal care, Skin care, Face care, Body care, Hair care, Sun care, Make-up, Make-up remover, Anti-aging creams, Moisturizers, Cleansers/Cleaning oils, Fragrance products, Cosmetics, Household & Homecare, Household cleaning products, Home & personal hygiene products, Food & Beverage, Health & Medical, Pharmaceuticals, Drug creams / medical formulations, Industrial & Manufacturing, Processing aids, Metalworking lubricants, Fiber treatment lubricants, Coatings, Paints & inks, Adhesives, Paper & tissue products, Water-soluble packaging, Textiles (softeners, treatments), Other Applications), and others |
Global Peg Esters Market Driver:
Rising Global Beauty Manufacturing
Rising global beauty manufacturing is one of the strongest drivers of the PEG Esters Market because cosmetic and skin-care formulators rely heavily on PEG esters for emulsification, solubilization, and product stability. The scale of global beauty production shows how strongly this demand is growing.
According to the Japan Cosmetic Industry Association (JCIA), based on official Japanese government production statistics, the total domestic shipment value of cosmetics in Japan in 2023 was about USD9.3 billion, which represented a 2.9 % increase compared to the previous year. This shipment value reflects the scale of cosmetics production by Japanese manufacturers. In India, the Ministry of Commerce reported USD737.7 thousand in cosmetics exports, showing rapid industry expansion supported by new manufacturing investments. The United States also remains a major production base, with the USITC reporting USD6.1 billion in cosmetic exports in 2023.
Moreover, regulatory systems support this growth, as the EU CosIng database and the U.S. FDA Inactive Ingredients Database list PEG esters as approved cosmetic excipients, enabling widespread, large-volume use. Together, these expanding manufacturing ecosystems directly increase global demand for PEG esters every year.
Global Peg Esters Market Trend:
Bio-Based PEG Ester Development Changing Market Dynamics
A major technological trend reshaping the global PEG esters industry is the shift toward bio-based production inputs, especially bio-ethylene derived from renewable sources. Traditional PEG esters use ethylene oxide made from fossil fuels. In contrast, manufacturers and chemical producers are increasingly using bio-attributed ethylene from plant-based ethanol, reducing reliance on fossil feedstocks and cutting greenhouse gas emissions.
For instance, Brazilian petrochemical companies Braskem and Oxiteno have partnered to supply bio-attributed ethylene certified by International Sustainability and Carbon Certification (ISCC) to create more sustainable chemical solutions. This bio-ethylene can serve as the foundational building block for ethoxylated products, including PEG esters used in personal care, pharmaceuticals, and industrial formulations.
Braskem’s investments show real scale, as the company has expanded its bio-based ethylene plant in Brazil by about 30% to reach around 260,000 metric tons per year, using sugarcane-derived ethanol as feedstock. This expansion reflects broader industry demand for renewable carbon content in chemicals and polymers, and it supports downstream bio-based surfactants and emulsifiers.
Global Peg Esters Market Challenges:
Stricter Regulatory Pressure on Ethoxylated Ingredients
Stricter regulatory pressure on ethoxylated ingredients has become one of the most serious challenges for the global PEG esters market. PEG esters are produced through ethoxylation, a process that may leave trace levels of ethylene oxide (EO) and 1,4-dioxane, both classified as hazardous impurities.
Regulatory bodies have tightened controls on these substances, directly increasing compliance costs for manufacturers. For instance, the European Chemicals Agency (ECHA) regulates EO-derived ingredients under REACH, requiring suppliers to ensure extremely low impurity levels and provide detailed safety documentation for cosmetic and industrial use.
Similarly, the U.S. Food and Drug Administration (FDA) monitors 1,4-dioxane in personal-care products, while New York State has implemented one of the strictest laws globally, limiting 1,4-dioxane to 2 ppm in cosmetics and 1 ppm in household cleaning products, with even lower thresholds scheduled. These rules force producers of PEG esters to adopt additional purification steps, raising manufacturing costs and slowing product approvals.
Additionally, the regulatory tightening encourages cosmetic and household brands to shift toward PEG-free or naturally derived emulsifiers, reducing long-term demand for PEG esters. As more countries consider impurity-based restrictions, regulatory compliance remains a defining and resource-intensive challenge for this market.
Global Peg Esters Market (2026-32) Segmentation Analysis:
The Global Peg Esters Market Report and Forecast 2026-2032 offers a detailed analysis of the market based on the following segments:
Based on Product Type
- Polysorbate 80
- Ceteareth-20
- Ceteareth-12
- PEG-10 Phytosterol
- Olive Oil PEG Esters
- PEG-10 Rapeseed Sterol
- PEG-100 Stearate
- PEG-120 Methyl Glucose Dioleate
- PEG-14M
- PEG-150 Distearate
- PEG-150 Pentaerythrityl Tetrastearate
- PEG-18 Glyceryl Oleate Cocoate
- PEG-20 Glyceryl Triisostearate
- C12-20 Acid PEG-8 Ester
- Glycereth-26
- PEG-20 Stearate
- PEG-200 Hydrogenated Glyceryl Palmate
- PEG-3 Distearate
- PEG-30 Dipolyhydroxystearate
- PEG-4 Laurate
- PEG-4 Rapeseedamide
- PEG-40 Hydrogenated Castor Oil
- Methoxy PEG-10
- Methyl Gluceth-10
- Methyl Gluceth-20
- PEG-33 Castor Oil
- PEG-35 Castor Oil
- PEG-40 Stearate
- PEG-45M
- PEG-55 Propylene Glycol Oleate
- PEG-6 Caprylic/Capric Glycerides
- PEG-60 Almond Glycerides
- PEG-60 Hydrogenated Castor Oil
- PEG-8 Isostearate
- PEG-8 Laurate
- Polysorbate 20
- Polysorbate 60
- Steareth-12 Stearate
- Steareth-21
- Trideceth-10
PEG-40 Hydrogenated Castor Oil (PEG-40 HCO) holds a strong position in the Global PEG Esters Market by holding a market share of about 33%, because it is one of the most widely used solubilizers and emulsifiers in personal care, household, and pharmaceutical formulations. Its dominance is closely linked to the fast-growing beauty and skin-care manufacturing base across Asia, Europe, and North America, where companies increasingly need safe, stable, and multifunctional emulsifiers for lotions, serums, cleansing oils, and fragrances.
Additionally, the ingredient benefits from strong manufacturing capacity in leading chemical-producing countries. For instance, Achilles Chemical Co. Ltd. in China alone reports a production capacity of about 2,000 tons per month, equivalent to nearly 24,000 tons annually, specifically for PEG-40 Hydrogenated Castor Oil. This level of large-scale output ensures steady global availability and strengthens its leadership in this market.
Apart from that, the Polysorbate 20 & Polysorbate 60 are among the fastest major growing products and expected to grow significantly during the forecast period.
Based on End User
- Personal care
- Skin care
- Face care
- Body care
- Hair care
- Sun care
- Make-up
- Make-up remover
- Anti-aging creams
- Moisturizers
- Cleansers/Cleaning oils
- Fragrance products
- Cosmetics
- Household & Homecare
- Household cleaning products
- Home & personal hygiene products
- Food & Beverage
- Health & Medical
- Pharmaceuticals
- Drug creams / medical formulations
- Industrial & Manufacturing
- Processing aids
- Metalworking lubricants
- Fiber treatment lubricants
- Coatings
- Paints & inks
- Adhesives
- Paper & tissue products
- Water-soluble packaging
- Textiles (softeners, treatments)
- Other Applications
The personal care sector dominates this market with a market share of around 32%, because it combines the largest manufacturing base, the highest formulation intensity, and strong regulatory acceptance across major economies. For instance, PEG esters such as PEG-40 Hydrogenated Castor Oil, PEG-20 Stearate, and Polysorbates are essential emulsifiers and solubilizers used in lotions, serums, shampoos, fragrances, and cleansing oils. Their dominance is reinforced by the scale of global beauty production.
Additionally, the European Union exported about USD12.89 billion worth of beauty and skin-care products in 2023, reflecting the region’s heavy reliance on emulsifier systems like PEG esters. Similarly, South Korea exported USD6.53 billion of the same category, showing its strong cosmetic manufacturing ecosystem and continuous demand for PEG-based functional ingredients.
Moreover, connectivity between regulation and usage further strengthens this dominance. The EU CosIng database formally lists PEG-40 Hydrogenated Castor Oil and several other PEG esters as approved cosmetic ingredients, enabling seamless formulation across the continent. Likewise, the U.S. FDA Inactive Ingredients Database includes PEG-type excipients for topical and dermatological products, supporting their adoption in personal care domain.
However, the pharmaceuticals segment is also set to grow significantly in this market during 2026-32.
Global Peg Esters Market (2026-32): Regional Projection
Asia–Pacific holds the largest market share of about 46%, primarily because it is the largest manufacturing hub for personal care, pharmaceuticals, and fatty-acid-based chemicals, all of which are major consumers of PEG esters. As per the UN Comtrade, China alone exported over USD2.07 billion worth of beauty and personal care products in 2023, the highest globally, while Japan and South Korea together contributed more than USD9.7 billion, reflecting the region’s massive formulation base that relies heavily on PEG-based emulsifiers. Additionally,
India’s pharmaceutical industry, ranked 3rd in global volume output by the Government of India, drives strong demand for PEG esters used in drug delivery, solubilizers, and topical formulations.
The region also benefits from abundant raw materials. For instance, Indonesia and Malaysia supply over 80% of the world’s palm oil (USDA 2024), a key source of fatty acids required to manufacture PEG esters. Additionally, China is among the world’s largest producers of ethylene oxide, the primary PEG precursor, enabling cost-efficient downstream production. Therefore, Asia–Pacific maintains a structurally dominant position in PEG ester production and usage.
Gain a Competitive Edge with Our Global Peg Esters Market Report
- Global Peg Esters Market Report by MarkNtel Advisors provides a detailed & thorough analysis of market size & share, growth rate, competitive landscape, and key players. This comprehensive analysis helps businesses gain a holistic understanding of the market dynamics & make informed decisions.
- This report also highlights current market trends & future projections, allowing businesses to identify emerging opportunities & potential challenges. By understanding market forecasts, companies can align their strategies & stay ahead of the competition.
- Global Peg Esters Market Report aids in assessing & mitigating risks associated with entering or operating in the market. By understanding market dynamics, regulatory frameworks, and potential challenges, businesses can develop strategies to minimize risks & optimize their operations.
*Reports Delivery Format - Market research studies from MarkNtel Advisors are offered in PDF, Excel and PowerPoint formats. Within 24 hours of the payment being successfully received, the report will be sent to your email address.
Frequently Asked Questions
- Market Segmentation
- Introduction
- Market Definition
- Research Process
- Assumption
- Executive Summary
- Global PEG Esters Market Trends & Development
- Global PEG Esters Market Dynamics
- Growth Drivers
- Challenges
- Global PEG Esters Market Hotspot & Opportunities
- Global PEG Esters Market Regulation & Policy
- Global PEG Esters Market Outlook, 2022-2032F
- Market Size & Analysis
- By Quantity Sold (Thousand Tons)
- Market Segmentation & Analysis
- By Product Type
- Polysorbate 80
- By Quantity Sold in Tons
- Quantity Sold by End Users Vs Region
- Food & Beverage
- North America
- South America
- Western Europe
- Eastern Europe
- APAC (excl. China)
- China
- Middle East & Africa
- Personal Care
- North America
- South America
- Western Europe
- Eastern Europe
- APAC (excl. China)
- China
- Middle East & Africa
- Pharmaceuticals
- North America
- South America
- Western Europe
- Eastern Europe
- APAC (excl. China)
- China
- Middle East & Africa
- Others
- Food & Beverage
- Market Share of Leading Companies
- BASF
- Croda
- Evonik
- Clariant
- Lonza
- PCC
- Others
- Ceteareth-20
- By Quantity Sold in Tons
- Quantity Sold by End Users Vs Region
- Home & Personal Care
- North America
- South America
- Western Europe
- Eastern Europe
- APAC (excl. China)
- China
- Middle East & Africa
- Pharmaceuticals
- North America
- South America
- Western Europe
- Eastern Europe
- APAC (excl. China)
- China
- Middle East & Africa
- Industrial
- North America
- South America
- Western Europe
- Eastern Europe
- APAC (excl. China)
- China
- Middle East & Africa
- Others
- Home & Personal Care
- Market Share of Leading Companies
- Abitec
- BASF
- Croda
- Clariant
- Sabo
- Vantage
- Oxiteno
- PCC EXOL
- Others
- Ceteareth-12
- By Quantity Sold in Tons
- Quantity Sold by End Users Vs Region
- Personal Care
- North America
- South America
- Western Europe
- Eastern Europe
- APAC (excl. China)
- China
- Middle East & Africa
- Base Oils
- North America
- South America
- Western Europe
- Eastern Europe
- APAC (excl. China)
- China
- Middle East & Africa
- Textiles
- North America
- South America
- Western Europe
- Eastern Europe
- APAC (excl. China)
- China
- Middle East & Africa
- Processing Aids
- North America
- South America
- Western Europe
- Eastern Europe
- APAC (excl. China)
- China
- Middle East & Africa
- Others
- Personal Care
- Market Share of Leading Companies
- BASF
- Croda
- Sabo
- Universal PreservAChem
- Others
- PEG-10 Phytosterol
- By Quantity Sold in Tons
- Quantity Sold by End Users Vs Region
- Make Up
- North America
- South America
- Western Europe
- Eastern Europe
- APAC (excl. China)
- China
- Middle East & Africa
- Skin Care
- North America
- South America
- Western Europe
- Eastern Europe
- APAC (excl. China)
- China
- Middle East & Africa
- Others
- North America
- South America
- Western Europe
- Eastern Europe
- APAC (excl. China)
- China
- Middle East & Africa
- Others
- Make Up
- Market Share of Leading Companies
- Nikko Chemicals
- Others
- Olive Oil PEG Esters
- By Quantity Sold in Tons
- Quantity Sold by End Users Vs Region
- Body Care
- North America
- South America
- Western Europe
- Eastern Europe
- APAC (excl. China)
- China
- Middle East & Africa
- Skin Care
- North America
- South America
- Western Europe
- Eastern Europe
- APAC (excl. China)
- China
- Middle East & Africa
- Fragrance
- North America
- South America
- Western Europe
- Eastern Europe
- APAC (excl. China)
- China
- Middle East & Africa
- Others
- Body Care
- Market Share of Leading Companies
- Hallstar
- Essential Ingredients
- B.C. Cosmetic and Food
- Others
- PEG-10 Rapeseed Sterol
- By Quantity Sold in Tons
- Quantity Sold by End Users Vs Region
- Make Up
- North America
- South America
- Western Europe
- Eastern Europe
- APAC (excl. China)
- China
- Middle East & Africa
- Skin Care
- North America
- South America
- Western Europe
- Eastern Europe
- APAC (excl. China)
- China
- Middle East & Africa
- Others
- Make Up
- Market Share of Leading Companies
- BASF
- Others
- PEG-100 Stearate
- By Quantity Sold in Tons
- Quantity Sold by End Users Vs Region
- Skin Care
- North America
- South America
- Western Europe
- Eastern Europe
- APAC (excl. China)
- China
- Middle East & Africa
- Make Up
- North America
- South America
- Western Europe
- Eastern Europe
- APAC (excl. China)
- China
- Middle East & Africa
- Sun Care
- North America
- South America
- Western Europe
- Eastern Europe
- APAC (excl. China)
- China
- Middle East & Africa
- Hair Care
- North America
- South America
- Western Europe
- Eastern Europe
- APAC (excl. China)
- China
- Middle East & Africa
- Others
- Skin Care
- Market Share of Leading Companies
- Croda, Inc.
- Lamberti S.p.A
- Sabo SPA
- Seppic
- Vantage
- Spak Orgochem
- Others
- PEG-120 Methyl Glucose Dioleate
- By Quantity Sold in Tons
- Quantity Sold by End Users Vs Region
- Body Care
- North America
- South America
- Western Europe
- Eastern Europe
- APAC (excl. China)
- China
- Middle East & Africa
- Hair Care
- North America
- South America
- Western Europe
- Eastern Europe
- APAC (excl. China)
- China
- Middle East & Africa
- Others
- Body Care
- Market Share of Leading Companies
- Evonik
- Lubrizol
- Guangzhou Tinci Materials etc.
- PEG-14M
- By Quantity Sold in Tons
- Quantity Sold by End Users Vs Region
- Personal Care
- North America
- South America
- Western Europe
- Eastern Europe
- APAC (excl. China)
- China
- Middle East & Africa
- Paper Tissue
- North America
- South America
- Western Europe
- Eastern Europe
- APAC (excl. China)
- China
- Middle East & Africa
- Water Soluble Packaging
- North America
- South America
- Western Europe
- Eastern Europe
- APAC (excl. China)
- China
- Middle East & Africa
- Others
- Personal Care
- Market Share of Leading Companies
- Dow
- Meisei Chemical Works
- Sumitomo Seika Chemicals
- Sino Lion
- Reachin
- AQIA
- Others
- PEG-150 Distearate
- By Quantity Sold in Tons
- Quantity Sold by End Users Vs Region
- Personal Care
- North America
- South America
- Western Europe
- Eastern Europe
- APAC (excl. China)
- China
- Middle East & Africa
- Softener for Textiles & Metalworking
- North America
- South America
- Western Europe
- Eastern Europe
- APAC (excl. China)
- China
- Middle East & Africa
- Pharmaceuticals
- North America
- South America
- Western Europe
- Eastern Europe
- APAC (excl. China)
- China
- Middle East & Africa
- Others
- Personal Care
- Market Share of Leading Companies
- BASF
- Evonik
- Rita Corporation
- Vantage
- Solvay
- Stepan
- PEG-150 Pentaerythrityl Tetrastearate
- By Quantity Sold in Tons
- Quantity Sold by End Users Vs Region
- Hair Care
- North America
- South America
- Western Europe
- Eastern Europe
- APAC (excl. China)
- China
- Middle East & Africa
- Body Care
- North America
- South America
- Western Europe
- Eastern Europe
- APAC (excl. China)
- China
- Middle East & Africa
- Face Care
- North America
- South America
- Western Europe
- Eastern Europe
- APAC (excl. China)
- China
- Middle East & Africa
- Others
- Hair Care
- Market Share of Leading Companies
- Croda
- Hytop
- Others
- PEG-18 Glyceryl Oleate Cocoate
- By Quantity Sold in Tons
- Quantity Sold by End Users Vs Region
- Body Care
- North America
- South America
- Western Europe
- Eastern Europe
- APAC (excl. China)
- China
- Middle East & Africa
- Hair Care
- North America
- South America
- Western Europe
- Eastern Europe
- APAC (excl. China)
- China
- Middle East & Africa
- Others
- Body Care
- Market Share of Leading Companies
- Evonik
- A&E Connock
- Others
- PEG-20 Glyceryl Triisostearate
- By Quantity Sold in Tons
- Quantity Sold by End Users Vs Region
- Make Up Remover
- North America
- South America
- Western Europe
- Eastern Europe
- APAC (excl. China)
- China
- Middle East & Africa
- Others
- Make Up Remover
- Market Share of Leading Companies
- Croda
- Nikko
- Nihon Emulsion
- Others
- C12-20 Acid PEG-8 Ester
- By Quantity Sold in Tons
- Quantity Sold by End Users Vs Region
- Anti-Aging Creams
- North America
- South America
- Western Europe
- Eastern Europe
- APAC (excl. China)
- China
- Middle East & Africa
- Face Masks
- North America
- South America
- Western Europe
- Eastern Europe
- APAC (excl. China)
- China
- Middle East & Africa
- Moisturizers
- North America
- South America
- Western Europe
- Eastern Europe
- APAC (excl. China)
- China
- Middle East & Africa
- Pharmaceuticals
- North America
- South America
- Western Europe
- Eastern Europe
- APAC (excl. China)
- China
- Middle East & Africa
- Others
- Anti-Aging Creams
- Market Share of Leading Companies
- Vevy
- Res Pharma
- Kinetik
- Others
- Glycereth-26
- By Quantity Sold in Tons
- Quantity Sold by End Users Vs Region
- Pharmaceuticals
- North America
- South America
- Western Europe
- Eastern Europe
- APAC (excl. China)
- China
- Middle East & Africa
- Personal Care
- North America
- South America
- Western Europe
- Eastern Europe
- APAC (excl. China)
- China
- Middle East & Africa
- Pigment
- North America
- South America
- Western Europe
- Eastern Europe
- APAC (excl. China)
- China
- Middle East & Africa
- Adhesives
- North America
- South America
- Western Europe
- Eastern Europe
- APAC (excl. China)
- China
- Middle East & Africa
- Others
- Pharmaceuticals
- Market Share of Leading Companies
- Croda
- Ethox
- BASF
- Clariant
- Vantage
- Lonza
- Others
- PEG-20 Stearate
- By Quantity Sold in Tons
- Quantity Sold by End Users Vs Region
- Personal Care
- North America
- South America
- Western Europe
- Eastern Europe
- APAC (excl. China)
- China
- Middle East & Africa
- Pharmaceuticals
- North America
- South America
- Western Europe
- Eastern Europe
- APAC (excl. China)
- China
- Middle East & Africa
- Textiles
- North America
- South America
- Western Europe
- Eastern Europe
- APAC (excl. China)
- China
- Middle East & Africa
- Others
- Personal Care
- Market Share of Leading Companies
- Croda
- Jeen International
- Seppic
- Stearinerie Dubois
- Vantage
- Erca Wilmar
- Others
- PEG-200 Hydrogenated Glyceryl Palmate
- By Quantity Sold in Tons
- Quantity Sold by End Users Vs Region
- Body Care
- North America
- South America
- Western Europe
- Eastern Europe
- APAC (excl. China)
- China
- Middle East & Africa
- Hair Care
- North America
- South America
- Western Europe
- Eastern Europe
- APAC (excl. China)
- China
- Middle East & Africa
- Make Up
- North America
- South America
- Western Europe
- Eastern Europe
- APAC (excl. China)
- China
- Middle East & Africa
- Fragrance
- North America
- South America
- Western Europe
- Eastern Europe
- APAC (excl. China)
- China
- Middle East & Africa
- Others
- Body Care
- Market Share of Leading Companies
- Evonik
- Others
- PEG-3 Distearate
- By Quantity Sold in Tons
- Quantity Sold by End Users Vs Region
- Make Up
- North America
- South America
- Western Europe
- Eastern Europe
- APAC (excl. China)
- China
- Middle East & Africa
- Skin Care
- North America
- South America
- Western Europe
- Eastern Europe
- APAC (excl. China)
- China
- Middle East & Africa
- Others
- Make Up
- Market Share of Leading Companies
- BASF
- Clariant
- Nikko
- Others
- PEG-30 Dipolyhydroxystearate
- By Quantity Sold in Tons
- Quantity Sold by End Users Vs Region
- Make Up
- North America
- South America
- Western Europe
- Eastern Europe
- APAC (excl. China)
- China
- Middle East & Africa
- Sun Care
- North America
- South America
- Western Europe
- Eastern Europe
- APAC (excl. China)
- China
- Middle East & Africa
- Skin care
- North America
- South America
- Western Europe
- Eastern Europe
- APAC (excl. China)
- China
- Middle East & Africa
- Hair Care
- North America
- South America
- Western Europe
- Eastern Europe
- APAC (excl. China)
- China
- Middle East & Africa
- Others
- Make Up
- Market Share of Leading Companies
- BASF
- Croda
- Seppic
- Sabo
- Erca Wilmar
- Others
- PEG-4 Laurate
- By Quantity Sold in Tons
- Quantity Sold by End Users Vs Region
- Personal Care
- North America
- South America
- Western Europe
- Eastern Europe
- APAC (excl. China)
- China
- Middle East & Africa
- Pharmaceuticals
- North America
- South America
- Western Europe
- Eastern Europe
- APAC (excl. China)
- China
- Middle East & Africa
- Metal Working & Fiber Treatment Lubricants
- North America
- South America
- Western Europe
- Eastern Europe
- APAC (excl. China)
- China
- Middle East & Africa
- Others
- Personal Care
- Market Share of Leading Companies
- Jeen International
- Protameen Chemicals
- Stearinerie Dubois
- PCC Chemax
- Croda
- Lonza
- Others
- PEG-4 Rapeseedamide
- By Quantity Sold in Tons
- Quantity Sold by End Users Vs Region
- Personal Care
- North America
- South America
- Western Europe
- Eastern Europe
- APAC (excl. China)
- China
- Middle East & Africa
- Pharmaceuticals
- North America
- South America
- Western Europe
- Eastern Europe
- APAC (excl. China)
- China
- Middle East & Africa
- Metal Working & Fiber Treatment Lubricants
- North America
- South America
- Western Europe
- Eastern Europe
- APAC (excl. China)
- China
- Middle East & Africa
- Others
- Personal Care
- Market Share of Leading Companies
- Kao
- PCC
- Solvay
- Eleco
- Others
- PEG-40 Hydrogenated Castor Oil
- Quantity Sold by End Users Vs Region
- Household
- North America
- South America
- Western Europe
- Eastern Europe
- APAC (excl. China)
- China
- Middle East & Africa
- Personal Care
- North America
- South America
- Western Europe
- Eastern Europe
- APAC (excl. China)
- China
- Middle East & Africa
- Metal Working
- North America
- South America
- Western Europe
- Eastern Europe
- APAC (excl. China)
- China
- Middle East & Africa
- Pharmaceuticals
- North America
- South America
- Western Europe
- Eastern Europe
- APAC (excl. China)
- China
- Middle East & Africa
- Others
- Household
- Market Share of Leading Companies
- Ashaland
- BASF
- Croda
- Clariant
- Evonik
- Ethox
- Jeen
- Lamberti
- Nihin
- Nikko
- Sabo
- Seppic
- Solvay
- Hallstar
- Vantage
- Unitop etc.
- Others
- Quantity Sold by End Users Vs Region
- Methoxy PEG-10
- Quantity Sold by End Users Vs Region
- Pharmaceuticals
- North America
- South America
- Western Europe
- Eastern Europe
- APAC (excl. China)
- China
- Middle East & Africa
- Pharmaceuticals
- Market Share of Leading Companies
- Dow Chemicals
- Du Pont
- Others
- Quantity Sold by End Users Vs Region
- Methyl Gluceth-10
- Quantity Sold by End Users Vs Region
- Personal Care
- North America
- South America
- Western Europe
- Eastern Europe
- APAC (excl. China)
- China
- Middle East & Africa
- Pharmaceuticals
- North America
- South America
- Western Europe
- Eastern Europe
- APAC (excl. China)
- China
- Middle East & Africa
- Others
- Personal Care
- Market Share of Leading Companies
- Lonza
- Ethox
- Others
- Quantity Sold by End Users Vs Region
- Methyl Gluceth-20
- Quantity Sold by End Users Vs Region
- Hair Care
- North America
- South America
- Western Europe
- Eastern Europe
- APAC (excl. China)
- China
- Middle East & Africa
- Personal Care
- North America
- South America
- Western Europe
- Eastern Europe
- APAC (excl. China)
- China
- Middle East & Africa
- Pharmaceuticals
- North America
- South America
- Western Europe
- Eastern Europe
- APAC (excl. China)
- China
- Middle East & Africa
- Others
- Hair Care
- Market Share of Leading Companies
- Lonza
- Ethox
- Others
- Quantity Sold by End Users Vs Region
- PEG-33 Castor Oil
- Quantity Sold by End Users Vs Region
- Anti Aging Creams
- North America
- South America
- Western Europe
- Eastern Europe
- APAC (excl. China)
- China
- Middle East & Africa
- Face Masks
- North America
- South America
- Western Europe
- Eastern Europe
- APAC (excl. China)
- China
- Middle East & Africa
- Moisturisers
- North America
- South America
- Western Europe
- Eastern Europe
- APAC (excl. China)
- China
- Middle East & Africa
- Pharmaceuticals (Creams)
- North America
- South America
- Western Europe
- Eastern Europe
- APAC (excl. China)
- China
- Middle East & Africa
- Others
- Anti Aging Creams
- Market Share of Leading Companies
- Gattefosse
- Mosselman SA
- AkzoNobel
- Solvay
- Others
- Quantity Sold by End Users Vs Region
- PEG-35 Castor Oil
- Quantity Sold by End Users Vs Region
- Personal Care
- North America
- South America
- Western Europe
- Eastern Europe
- APAC (excl. China)
- China
- Middle East & Africa
- Pharmaceuticals
- North America
- South America
- Western Europe
- Eastern Europe
- APAC (excl. China)
- China
- Middle East & Africa
- Others
- Personal Care
- Market Share of Leading Companies
- BASF
- Croda
- SEPPIC
- Others
- Quantity Sold by End Users Vs Region
- PEG-40 Stearate
- Quantity Sold by End Users Vs Region
- Home & Personal Care
- North America
- South America
- Western Europe
- Eastern Europe
- APAC (excl. China)
- China
- Middle East & Africa
- Pharmaceuticals
- North America
- South America
- Western Europe
- Eastern Europe
- APAC (excl. China)
- China
- Middle East & Africa
- Industrial
- North America
- South America
- Western Europe
- Eastern Europe
- APAC (excl. China)
- China
- Middle East & Africa
- Others
- Home & Personal Care
- Market Share of Leading Companies
- BASF
- Croda
- Evonik
- Lonza
- Nikko Chemicals
- Rita Corporation
- Sabo SPA
- SEPPIC
- Others
- Quantity Sold by End Users Vs Region
- PEG-45M
- Quantity Sold by End Users Vs Region
- Personal Care
- North America
- South America
- Western Europe
- Eastern Europe
- APAC (excl. China)
- China
- Middle East & Africa
- Pharmaceuticals
- North America
- South America
- Western Europe
- Eastern Europe
- APAC (excl. China)
- China
- Middle East & Africa
- Others
- Personal Care
- Market Share of Leading Companies
- Dow Chemicals
- DuPont
- Others
- Quantity Sold by End Users Vs Region
- PEG-55 Propylene Glycol Oleate
- Quantity Sold by End Users Vs Region
- Hair Care
- North America
- South America
- Western Europe
- Eastern Europe
- APAC (excl. China)
- China
- Middle East & Africa
- Body Care
- North America
- South America
- Western Europe
- Eastern Europe
- APAC (excl. China)
- China
- Middle East & Africa
- Others
- Hair Care
- Market Share of Leading Companies
- Evonik
- Others
- Quantity Sold by End Users Vs Region
- PEG-6 Caprylic/Capric Glycerides
- Quantity Sold by End Users Vs Region
- Personal Care
- North America
- South America
- Western Europe
- Eastern Europe
- APAC (excl. China)
- China
- Middle East & Africa
- Pharmaceuticals
- North America
- South America
- Western Europe
- Eastern Europe
- APAC (excl. China)
- China
- Middle East & Africa
- Others
- Personal Care
- Market Share of Leading Companies
- Croda
- Evonik
- Lubrizol
- Others
- Quantity Sold by End Users Vs Region
- PEG-60 Almond Glycerides
- Quantity Sold by End Users Vs Region
- Personal Care
- North America
- South America
- Western Europe
- Eastern Europe
- APAC (excl. China)
- China
- Middle East & Africa
- Pharmaceuticals
- North America
- South America
- Western Europe
- Eastern Europe
- APAC (excl. China)
- China
- Middle East & Africa
- Others
- Personal Care
- Market Share of Leading Companies
- Croda
- Others
- Quantity Sold by End Users Vs Region
- PEG-60 Hydrogenated Castor Oil
- Quantity Sold by End Users Vs Region
- Personal Care
- North America
- South America
- Western Europe
- Eastern Europe
- APAC (excl. China)
- China
- Middle East & Africa
- Pharmaceuticals
- North America
- South America
- Western Europe
- Eastern Europe
- APAC (excl. China)
- China
- Middle East & Africa
- Others
- Personal Care
- Market Share of Leading Companies
- BASF
- Clariant
- Evonik
- Croda
- Sabo
- SEPPIC
- Vantage etc.
- Others
- Quantity Sold by End Users Vs Region
- PEG-8 Isostearate
- Quantity Sold by End Users Vs Region
- Cleansers/Cleaning Oils
- North America
- South America
- Western Europe
- Eastern Europe
- APAC (excl. China)
- China
- Middle East & Africa
- Others
- Cleansers/Cleaning Oils
- Market Share of Leading Companies
- Ethox
- Nihon
- Others
- Quantity Sold by End Users Vs Region
- PEG-8 Laurate
- Quantity Sold by End Users Vs Region
- Industrial
- North America
- South America
- Western Europe
- Eastern Europe
- APAC (excl. China)
- China
- Middle East & Africa
- Personal Care
- North America
- South America
- Western Europe
- Eastern Europe
- APAC (excl. China)
- China
- Middle East & Africa
- Pharmaceuticals
- North America
- South America
- Western Europe
- Eastern Europe
- APAC (excl. China)
- China
- Middle East & Africa
- Others
- Industrial
- Market Share of Leading Companies
- Croda
- Ethox
- Jeen
- Lonza
- Stearinerie Dubois Fils
- Hallstar
- Others
- Quantity Sold by End Users Vs Region
- Polysorbate 20
- Quantity Sold by End Users Vs Region
- Personal Care
- North America
- South America
- Western Europe
- Eastern Europe
- APAC (excl. China)
- China
- Middle East & Africa
- Industrial
- North America
- South America
- Western Europe
- Eastern Europe
- APAC (excl. China)
- China
- Middle East & Africa
- Pharmaceuticals
- North America
- South America
- Western Europe
- Eastern Europe
- APAC (excl. China)
- China
- Middle East & Africa
- Others
- Personal Care
- Market Share of Leading Companies
- BASF
- Croda
- Evonik
- Lonza
- Solvay
- Ethox
- Mohini
- Spak
- Others
- Quantity Sold by End Users Vs Region
- Polysorbate 60
- Quantity Sold by End Users Vs Region
- Personal Care
- North America
- South America
- Western Europe
- Eastern Europe
- APAC (excl. China)
- China
- Middle East & Africa
- Food
- North America
- South America
- Western Europe
- Eastern Europe
- APAC (excl. China)
- China
- Middle East & Africa
- Pharmaceuticals
- North America
- South America
- Western Europe
- Eastern Europe
- APAC (excl. China)
- China
- Middle East & Africa
- Lubricants
- North America
- South America
- Western Europe
- Eastern Europe
- APAC (excl. China)
- China
- Middle East & Africa
- Coatings
- North America
- South America
- Western Europe
- Eastern Europe
- APAC (excl. China)
- China
- Middle East & Africa
- Textiles
- North America
- South America
- Western Europe
- Eastern Europe
- APAC (excl. China)
- China
- Middle East & Africa
- Others
- Personal Care
- Market Share of Leading Companies
- BASF
- Croda
- Evonik
- Lonza
- Solvay
- Ethox
- Mohini
- Spak
- Others
- Quantity Sold by End Users Vs Region
- Steareth-12 Stearate
- Quantity Sold by End Users Vs Region
- Skin Care
- North America
- South America
- Western Europe
- Eastern Europe
- APAC (excl. China)
- China
- Middle East & Africa
- Others
- Skin Care
- Market Share of Leading Companies
- Nihon
- Others
- Quantity Sold by End Users Vs Region
- Steareth-21
- Quantity Sold by End Users Vs Region
- Personal Care
- North America
- South America
- Western Europe
- Eastern Europe
- APAC (excl. China)
- China
- Middle East & Africa
- Household
- North America
- South America
- Western Europe
- Eastern Europe
- APAC (excl. China)
- China
- Middle East & Africa
- Pharmaceuticals
- North America
- South America
- Western Europe
- Eastern Europe
- APAC (excl. China)
- China
- Middle East & Africa
- Others
- Personal Care
- Market Share of Leading Companies
- Ashland
- BASF
- Croda
- Evonik
- Protameen Chemicals
- Rita Corporation
- Vantage
- Zschimmer & Schwarz
- Others
- Quantity Sold by End Users Vs Region
- Trideceth-10
- By Quantity Sold in Tons
- Quantity Sold by End Users Vs Region
- Personal Care
- North America
- South America
- Western Europe
- Eastern Europe
- APAC (excl. China)
- China
- Middle East & Africa
- Household
- North America
- South America
- Western Europe
- Eastern Europe
- APAC (excl. China)
- China
- Middle East & Africa
- Industrial
- North America
- South America
- Western Europe
- Eastern Europe
- APAC (excl. China)
- China
- Middle East & Africa
- Others
- Personal Care
- By Company
- Jeen International
- Sasol
- Solvay
- Toho
- Others
- Polysorbate 80
- By Product Type
- Market Size & Analysis
- Global PEG Esters Market Pricing Analysis (USD/kg), 2022-2032
- Minimum & Maximum Price of Each Product (USD/Kg)
- Polysorbate 80
- Ceteareth-20
- Ceteareth-12
- PEG-10 Phytosterol
- Olive Oil PEG Esters
- PEG-10 Rapeseed Sterol
- PEG-100 Stearate
- PEG-120 Methyl Glucose Dioleate
- PEG-14M
- PEG-150 Distearate
- PEG-150 Pentaerythrityl Tetrastearate
- PEG-18 Glyceryl Oleate Cocoate
- PEG-20 Glyceryl Triisostearate
- C12-20 Acid PEG-8 Ester
- Glycereth-26
- PEG-20 Stearate
- PEG-200 Hydrogenated Glyceryl Palmate
- PEG-3 Distearate
- PEG-30 Dipolyhydroxystearate
- PEG-4 Laurate
- PEG-4 Rapeseedamide
- PEG-40 Hydrogenated Castor Oil
- Methoxy PEG-10
- Methyl Gluceth-10
- Methyl Gluceth-20
- PEG-33 Castor Oil
- PEG-35 Castor Oil
- PEG-40 Stearate
- PEG-45M
- PEG-55 Propylene Glycol Oleate
- PEG-6 Caprylic/Capric Glycerides
- PEG-60 Almond Glycerides
- PEG-60 Hydrogenated Castor Oil
- PEG-8 Isostearate
- PEG-8 Laurate
- Polysorbate 20
- Polysorbate 60
- Steareth-12 Stearate
- Steareth-21
- Trideceth-10
- Minimum & Maximum Price of Each Product (USD/Kg)
- Disclaimer
MarkNtel Advisors follows a robust and iterative research methodology designed to ensure maximum accuracy and minimize deviation in market estimates and forecasts. Our approach combines both bottom-up and top-down techniques to effectively segment and quantify various aspects of the market. A consistent feature across all our research reports is data triangulation, which examines the market from three distinct perspectives to validate findings. Key components of our research process include:
1. Scope & Research Design At the outset, MarkNtel Advisors define the research objectives and formulate pertinent questions. This phase involves determining the type of research—qualitative or quantitative—and designing a methodology that outlines data collection methods, target demographics, and analytical tools. They also establish timelines and budgets to ensure the research aligns with client goals.
2. Sample Selection and Data Collection In this stage, the firm identifies the target audience and determines the appropriate sample size to ensure representativeness. They employ various sampling methods, such as random or stratified sampling, based on the research objectives. Data collection is carried out using tools like surveys, interviews, and observations, ensuring the gathered data is reliable and relevant.
3. Data Analysis and Validation Once data is collected, MarkNtel Advisors undertake a rigorous analysis process. This includes cleaning the data to remove inconsistencies, employing statistical software for quantitative analysis, and thematic analysis for qualitative data. Validation steps are taken to ensure the accuracy and reliability of the findings, minimizing biases and errors.

4. Data Forecast and FinalizationThe final phase involves forecasting future market trends based on the analyzed data. MarkNtel Advisors utilize predictive modeling and time series analysis to anticipate market behaviors. The insights are then compiled into comprehensive reports, featuring visual aids like charts and graphs, and include strategic recommendations to inform client decision-making
We offer flexible licensing options to cater to varying organizational needs. Choose the pricing pack that best suits your requirements:
Buy Now

