
Asia-Pacific Graphite Market Research Report: Forecast (2026-2032)
Asia-Pacific Graphite Market - By Type (Natural Graphite, Lump (Vein) Graphite, Amorphous Graphite, Synthetic Graphite),, By Form (Flake Additives, Powder Graphite, Expandable Flak ... es, Micronized Graphite, Pellets, Film & Sheet), By Distribution Channel (Direct Sales, Distributors, Online, Retail), By Application (Batteries / Energy Storage, Refractories & Metallurgy, Foundry, Lubricants & Industrial Uses, Electronics & Consumer Devices, Building & Construction Materials, Medical & Diagnostics, Defense & Aerospace), By End User (Automotive & EV Sector, Aerospace, Energy Storage Systems & Power Utilities, Steel & Metallurgy, Electronics, Industrial Manufacturing, Construction & Infrastructure, Healthcare, Others), and others Read more
- Chemicals
- Jan 2026
- Pages 165
- Report Format: PDF, Excel, PPT
Asia-Pacific Graphite Market
Projected 8.42% CAGR from 2026 to 2032
Study Period
2026-2032
Market Size (2025)
USD 5.87 Billion
Market Size (2032)
USD 10.34 Billion
Base Year
2025
Projected CAGR
8.42%
Leading Segments
By Type: Synthetic Graphite
Asia-Pacific Graphite Market Report Key Takeaways:
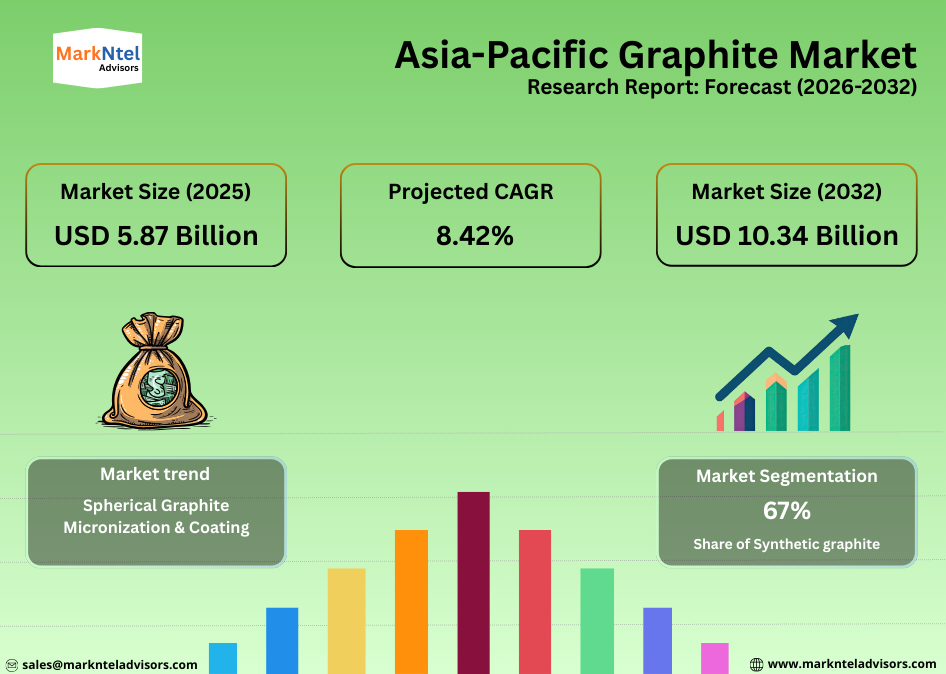
- Market size was valued at around USD5.87 billion in 2025 and is projected to reach USD10.34 billion by 2032. The estimated CAGR from 2026 to 2032 is around 8.42%, indicating strong growth.
- By Country, China is dominating this market by holding around 78% market share in 2025.
- By Type, the synthetic graphite represented a significant share of about 67% in the Asia-Pacific Graphite Market in 2025.
- By End-User, the Automotive and EV sector represented a significant share of about 44% in the Asia-Pacific Graphite Market in 2025.
- Leading Graphite companies in Asia-Pacific are Tokai Carbon Co., Ltd., Toyo Tanso Co., Ltd., China Carbon Graphite Group, Qingdao Haida Graphite Co., Ltd., Nippon Carbon Co., Ltd., Graphite India Limited, Tirupati Graphite, Bogala Graphite Lanka PLC, Syrah Resources, Vietnam Graphite JSC, Shanshan Technology, SGL Carbon SE, HEG Limited, Imerys Group, Jiangxi Zichen Technology Co., Ltd., and Others.
Market Insights & Analysis: Asia-Pacific Graphite Market (2026-32):
The Asia-Pacific Graphite Market size was valued at around USD5.87 billion in 2025 and is projected to reach USD10.34 billion by 2032. Along with this, the market is estimated to grow at a CAGR of around 8.42% during the forecast period, i.e., 2026-32.
The Asia-Pacific graphite market is fundamentally shaped by the scale and expansion of multiple downstream industries, with batteries, energy, metallurgy, electronics, refractories, and chemicals forming its demand backbone. The automotive and battery sector remains the dominant growth pillar. For instance, lithium-ion batteries used in electric vehicles contain around 95–99% graphite in the anode by weight, making graphite demand closely tied to EV and battery manufacturing. This relationship is critical because the Asia-Pacific hosts the world’s largest battery manufacturing base, led by China, Japan, and South Korea, as highlighted by the International Energy Agency.
Moreover, the energy and utilities sector is emerging as a large-volume driver across advanced Asia-Pacific economies such as Japan and South Korea, where battery storage is being scaled to support renewable integration and grid resilience. For instance, Japan has prioritized stationary battery deployment under its Green Transformation (GX) and renewable-integration policies, with the government supporting large grid-scale and commercial battery storage projects to stabilize solar and offshore wind generation, as outlined by the Ministry of Economy, Trade, and Industry. These deployments directly increase demand for lithium-ion batteries and, in turn, battery-grade graphite anodes.
Similarly, South Korea has been an early adopter of grid-connected energy storage systems, driven by renewable expansion and power-system flexibility needs. According to the Ministry of Trade, Industry and Energy, battery energy storage remains central to national power-market reforms and renewable-energy balancing strategies. As lithium-ion chemistry dominates new installations in both countries, graphite demand rises proportionally due to its dominant role in battery anodes.
In metallurgy, graphite demand remains structurally strong. Asia-Pacific accounts for over 70% of global crude steel output, sustaining large consumption of graphite electrodes in electric arc furnaces, as per the World Steel Association. Additionally, electronics and semiconductor manufacturing across China, Taiwan, South Korea, and Japan drives demand for ultra-high-purity graphite used in thermal management, wafers, and precision components. Refractories, chemicals, and emerging healthcare applications further add steady, value-oriented demand.
Overall, the Asia-Pacific graphite market outlook reflects broad-based end-use expansion, combining high-growth battery demand with resilient industrial and technology-driven consumption, reinforcing the region’s global leadership in graphite production and processing.
Asia-Pacific Graphite Market Recent Developments:
- 2025: HEG Limited board approved an approximately USD80 million plan to expand graphite electrode production by 15,000 tons per year (TPA) to 115,000 TPA, boosting capacity over 30 months to meet rising demand. The company is also advancing a separate 20,000 TPA graphite anode manufacturing facility in India.
- 2025: Graphite India Limited approved approximately USD72 million investment to expand graphite electrode capacity by 25,000 TPA, raising total output to 105,000 TPA over 36 months, strengthening Asia-Pacific supply for steelmaking and EV-driven graphite demand.
Asia-Pacific Graphite Market Scope:
| Category | Segments |
|---|---|
| By Type | Natural Graphite, Lump (Vein) Graphite, Amorphous Graphite, Synthetic Graphite |
| By Form | Flake Additives, Powder Graphite, Expandable Flakes, Micronized Graphite, Pellets, Film & Sheet |
| By Distribution Channel | Direct Sales, Distributors, Online, Retail |
| By Application | Batteries / Energy Storage, Refractories & Metallurgy, Foundry, Lubricants & Industrial Uses, Electronics & Consumer Devices, Building & Construction Materials, Medical & Diagnostics, Defense & Aerospace |
| By End User | Automotive & EV Sector, Aerospace, Energy Storage Systems & Power Utilities, Steel & Metallurgy, Electronics, Industrial Manufacturing, Construction & Infrastructure, Healthcare, Others), and others |
Asia-Pacific Graphite Market Driver:
Rapid Expansion of Stationary Energy Storage Systems
The rapid expansion of stationary battery energy storage systems (ESS) has become a critical driver of the Asia-Pacific graphite market because lithium-ion batteries dominate new storage deployments and graphite remains the primary anode material in these batteries. As countries across the region scale up solar and wind capacity, grid operators increasingly rely on battery storage to manage intermittency, frequency regulation, and peak demand, directly translating into higher lithium-ion cell production and rising graphite consumption.
China has led this shift at scale. By the end of 2024, the country’s cumulative battery storage capacity reached approximately 62 GW / 141 GWh, after adding 37 GW (91 GWh) in 2024 alone, largely from utility-scale projects. This rapid build-out significantly expands demand for graphite anodes because each lithium-ion storage system contains a large volume of graphite relative to other battery materials.
Meanwhile, India is gradually transitioning from a storage mix dominated by pumped hydro, with 4.86 GW installed as of December 2024, toward greater adoption of battery-based systems, further increasing regional graphite demand, thus contributing to the market growth.
Asia-Pacific Graphite Market Trend:
Spherical Graphite Micronization & Coating
Spherical graphite micronization and coating is a critical technology trend in Asia-Pacific because it directly improves lithium-ion battery anode performance. Micronization and spheronization convert flake graphite into uniform spherical particles (typically 10–20 μm), which pack more efficiently and increase tap density, allowing batteries to store more energy per unit volume. Additionally, carbon coating reduces surface defects, improving first-cycle coulombic efficiency and extending battery cycle life, key requirements for EV batteries.
Another advantage is faster charging performance, as spherical and coated particles reduce lithium-ion diffusion resistance. Likewise, coated spherical graphite shows better thermal stability and lower degradation under high-current operation, supporting long-range and fast-charging EVs.
Moreover, China remains the dominant processing hub, with major producers such as BTR New Material Group, Shanshan Technology, and Putailai (PLT) operating large-scale spherical graphite and coating lines. Similarly, Japan’s Tokai Carbon supplies high-purity, coated graphite for advanced battery applications.
Asia-Pacific Graphite Market Challenges:
Export Controls and Policy Risk
Export controls have emerged as a major constraint on growth in the Asia-Pacific graphite market because they directly affect supply availability, pricing stability, and investment confidence. In October 2023, China announced that exporters must obtain special license for certain graphite products, including spherical graphite and high-purity synthetic graphite, with the rules taking effect in December 2023. This policy shift is critical because China dominates upstream graphite supply, and it also controls most battery-grade processing capacity.
As a result, requirements increase lead times and administrative uncertainty for overseas buyers, complicating procurement for EV battery, energy-storage, and steel producers across the Asia-Pacific. In response, manufacturers have faced short-term price volatility and supply-chain bottlenecks, while new projects outside China require higher capital investment and longer development timelines.
Moreover, these controls influence strategic decisions. Governments and companies in Japan, South Korea, and India are accelerating local anode and processing investments to reduce exposure to policy risk, but such diversification takes years. As a result, export controls do not just disrupt current trade flows; they reshape investment patterns, raise costs, and slow near-term market expansion, making policy risk a persistent challenge for the Asia-Pacific graphite market.
Asia-Pacific Graphite Market (2026-32) Segmentation Analysis:
The Asia-Pacific Graphite Market Report and Forecast 2026-2032 offers a detailed analysis of the market based on the following segments:
Based on Type:
- Natural Graphite
- Lump (Vein) Graphite
- Amorphous Graphite
- Synthetic Graphite
Synthetic graphite dominates the Asia-Pacific Graphite Market with a market share of about 67% because the region concentrates both large-scale production capacity and the highest downstream demand for performance-critical applications. For reference, synthetic graphite is indispensable for graphite electrodes used in electric-arc-furnace (EAF) steelmaking.
For instance, in India, long-established electrode producers such as Graphite India Limited and HEG Limited, anchoring large synthetic graphite demand from electric-arc-furnace steelmaking. Leveraging this base, both companies are now investing in approximately 20,000 tons per year (TPA) synthetic graphite anode plants, directly linking steel-driven synthetic expertise with India’s emerging EV battery supply chain.
Similarly, Japan strengthens regional dominance through technology-led producers such as Toyo Tanso Co., Ltd. and Nippon Carbon Co., Ltd., which supply high-purity synthetic graphite for semiconductors and specialty industries where natural graphite cannot meet performance thresholds.
Meanwhile, South Korea is scaling battery-focused synthetic capacity via POSCO-linked plants, starting at about 8,000 TPA and expanding toward nearly 18,000 TPA, tightly aligned with domestic lithium-ion cell manufacturers. Together, these country-level capacities connect industrial demand, technology requirements, and localized supply, reinforcing synthetic graphite’s regional dominance.
Based on the End-User
- Automotive & EV Sector
- Aerospace
- Energy Storage Systems & Power Utilities
- Steel & Metallurgy
- Electronics
- Industrial Manufacturing
- Construction & Infrastructure
- Healthcare
- Others
The automotive and EV sector dominates this market, accounting for a market share of about 44% because the region concentrates vehicle manufacturing, battery production, and raw-material processing in one integrated ecosystem, contributing to the rising demand for graphite. As per the International Organization of Motor Vehicle Manufacturers (OICA), China produced over 30 million motor vehicles in 2024, while Japan produced 9 million, India manufactured over 6 million, and South Korea about 4 million vehicles, which together accounted for a substantial share of global automotive output. This scale provides the industrial base for rapid electrification.
Moreover, China alone accounts for more than 70% of global EV production. Each lithium-ion battery uses graphite as its exclusive commercial anode material, making graphite consumption directly proportional to EV output. As EV penetration in China approached around half of new car sales in 2024, anode material demand accelerated accordingly. These factors are contributing to the dominance of the automotive and EV sector in this market.
Asia-Pacific Graphite Market (2026-32): Regional Projection
China holds the largest market share of about 78% in the Asia-Pacific graphite market through a tightly linked chain of resource ownership, industrial scale, downstream integration, and state policy support. According to the U.S. Geological Survey (USGS), China produces approximately 77% of global natural graphite, giving it unmatched control over upstream supply and price formation across the region. Additionally, over 90% of battery-grade spherical graphite used in lithium-ion anodes is processed in China, concentrating high-value purification, coating, and shaping activities domestically.
Moreover, according to the International Energy Agency (IEA) reports that China accounted for over 70% of global electric-vehicle production in 2024, anchoring graphite demand close to battery gigafactories and reducing logistics, energy, and conversion costs. In addition, China’s steel and metallurgy sector, the world’s largest, sustains heavy consumption of synthetic graphite electrodes, ensuring stable non-battery demand. This industrial control is reinforced by policy; export controls introduced in 2023–2024 on certain graphite products underscore graphite’s designation as a strategic material and further strengthen China’s leverage over regional supply chains.
Gain a Competitive Edge with Our Asia-Pacific Graphite Market Report
- Asia-Pacific Graphite Market Report by MarkNtel Advisors provides a detailed & thorough analysis of market size & share, growth rate, competitive landscape, and key players. This comprehensive analysis helps businesses gain a holistic understanding of the market dynamics & make informed decisions.
- This report also highlights current market trends & future projections, allowing businesses to identify emerging opportunities & potential challenges. By understanding market forecasts, companies can align their strategies & stay ahead of the competition.
- Asia-Pacific Graphite Market Report aids in assessing & mitigating risks associated with entering or operating in the market. By understanding market dynamics, regulatory frameworks, and potential challenges, businesses can develop strategies to minimize risks & optimize their operations.
*Reports Delivery Format - Market research studies from MarkNtel Advisors are offered in PDF, Excel and PowerPoint formats. Within 24 hours of the payment being successfully received, the report will be sent to your email address.
Frequently Asked Questions
- Market Segmentation
- Introduction
- Product Definition
- Research Process
- Assumptions
- Executive Summary
- Asia-Pacific Graphite Market Regulations, Policies & Standards
- Asia-Pacific Graphite Market Trends & Developments
- Asia-Pacific Graphite Market Supply Chain Analysis
- Asia-Pacific Graphite Market Supply Production Capabilities
- Asia-Pacific Graphite Market Imports/Exports
- Asia-Pacific Graphite Market Dynamics
- Growth Drivers
- Challenges
- Asia-Pacific Graphite Market Hotspots & Opportunities
- Asia-Pacific Graphite Market Pricing Analysis
- Asia-Pacific Graphite Market Outlook, 2022-2032F
- Market Size & Analysis
- By Revenue (USD Million)
- By Quantity Sold (Thousand Tons)
- Market Share & Analysis
- By Type- (Thousand Tons)
- Natural Graphite
- Lump (Vein) Graphite
- Amorphous Graphite
- Synthetic Graphite
- By Form- (Thousand Tons)
- Flake Additives
- Powder Graphite
- Expandable Flakes
- Micronized Graphite
- Pellets
- Film & Sheet
- By Distribution Channel- (Thousand Tons)
- Direct Sales
- Distributors
- Online
- Retail
- By Application- (Thousand Tons)
- Batteries / Energy Storage
- Refractories & Metallurgy
- Foundry
- Lubricants & Industrial Uses
- Electronics & Consumer Devices
- Building & Construction Materials
- Medical & Diagnostics
- Defense & Aerospace
- By End User- (Thousand Tons)
- Automotive & EV Sector
- Aerospace
- Energy Storage Systems & Power Utilities
- Steel & Metallurgy
- Electronics
- Industrial Manufacturing
- Construction & Infrastructure
- Healthcare
- Others
- By Country
- China
- Japan
- South Korea
- India
- Vietnam
- Indonesia
- Malaysia
- Thailand
- Australia
- Sri Lanka
- Rest of Asia-Pacific
- By Competitors
- Competition Characteristics
- Market Share & Analysis
- By Type- (Thousand Tons)
- Market Size & Analysis
- China Graphite Market Outlook, 2022-2032F
- Market Size & Analysis
- By Revenue (USD Million)
- By Quantity Sold (Thousand Tons)
- Market Share & Analysis
- By Type- (Thousand Tons)
- By Form- (Thousand Tons)
- By Distribution Channel- (Thousand Tons)
- By Application- (Thousand Tons)
- By End User- (Thousand Tons)
- Market Size & Analysis
- Japan Graphite Market Outlook, 2022-2032F
- Market Size & Analysis
- By Revenue (USD Million)
- By Quantity Sold (Thousand Tons)
- Market Share & Analysis
- By Type- (Thousand Tons)
- By Form- (Thousand Tons)
- By Distribution Channel- (Thousand Tons)
- By Application- (Thousand Tons)
- By End User- (Thousand Tons)
- Market Size & Analysis
- South Korea Graphite Market Outlook, 2022-2032F
- Market Size & Analysis
- By Revenue (USD Million)
- By Quantity Sold (Thousand Tons)
- Market Share & Analysis
- By Type- (Thousand Tons)
- By Form- (Thousand Tons)
- By Distribution Channel- (Thousand Tons)
- By Application- (Thousand Tons)
- By End User- (Thousand Tons)
- Market Size & Analysis
- Vietnam Graphite Market Outlook, 2022-2032F
- Market Size & Analysis
- By Revenue (USD Million)
- By Quantity Sold (Thousand Tons)
- Market Share & Analysis
- By Type- (Thousand Tons)
- By Form- (Thousand Tons)
- By Distribution Channel- (Thousand Tons)
- By Application- (Thousand Tons)
- By End User- (Thousand Tons)
- Market Size & Analysis
- Indonesia Graphite Market Outlook, 2022-2032F
- Market Size & Analysis
- By Revenue (USD Million)
- By Quantity Sold (Thousand Tons)
- Market Share & Analysis
- By Type- (Thousand Tons)
- By Form- (Thousand Tons)
- By Distribution Channel- (Thousand Tons)
- By Application- (Thousand Tons)
- By End User- (Thousand Tons)
- Market Size & Analysis
- Malaysia Graphite Market Outlook, 2022-2032F
- Market Size & Analysis
- By Revenue (USD Million)
- By Quantity Sold (Thousand Tons)
- Market Share & Analysis
- By Type- (Thousand Tons)
- By Form- (Thousand Tons)
- By Distribution Channel- (Thousand Tons)
- By Application- (Thousand Tons)
- By End User- (Thousand Tons)
- Market Size & Analysis
- Thailand Graphite Market Outlook, 2022-2032F
- Market Size & Analysis
- By Revenue (USD Million)
- By Quantity Sold (Thousand Tons)
- Market Share & Analysis
- By Type- (Thousand Tons)
- By Form- (Thousand Tons)
- By Distribution Channel- (Thousand Tons)
- By Application- (Thousand Tons)
- By End User- (Thousand Tons)
- Market Size & Analysis
- Australia Graphite Market Outlook, 2022-2032F
- Market Size & Analysis
- By Revenue (USD Million)
- By Quantity Sold (Thousand Tons)
- Market Share & Analysis
- By Type- (Thousand Tons)
- By Form- (Thousand Tons)
- By Distribution Channel- (Thousand Tons)
- By Application- (Thousand Tons)
- By End User- (Thousand Tons)
- Market Size & Analysis
- Sri Lanka Graphite Market Outlook, 2022-2032F
- Market Size & Analysis
- By Revenue (USD Million)
- By Quantity Sold (Thousand Tons)
- Market Share & Analysis
- By Type- (Thousand Tons)
- By Form- (Thousand Tons)
- By Distribution Channel- (Thousand Tons)
- By Application- (Thousand Tons)
- By End User- (Thousand Tons)
- Market Size & Analysis
- Asia-Pacific Graphite Market Key Strategic Imperatives for Growth & Success
- Competitive Outlook
- Company Profiles
- Tokai Carbon Co., Ltd.
- Business Description
- Product Portfolio
- Strategic Alliances or Partnerships
- Recent Developments
- Financial Details
- Others
- Toyo Tanso Co., Ltd.
- Business Description
- Product Portfolio
- Strategic Alliances or Partnerships
- Recent Developments
- Financial Details
- Others
- China Carbon Graphite Group
- Business Description
- Product Portfolio
- Strategic Alliances or Partnerships
- Recent Developments
- Financial Details
- Others
- Qingdao Haida Graphite Co., Ltd.
- Business Description
- Product Portfolio
- Strategic Alliances or Partnerships
- Recent Developments
- Financial Details
- Others
- Nippon Carbon Co., Ltd.
- Business Description
- Product Portfolio
- Strategic Alliances or Partnerships
- Recent Developments
- Financial Details
- Others
- Graphite India Limited
- Business Description
- Product Portfolio
- Strategic Alliances or Partnerships
- Recent Developments
- Financial Details
- Others
- Tirupati Graphite
- Business Description
- Product Portfolio
- Strategic Alliances or Partnerships
- Recent Developments
- Financial Details
- Others
- Bogala Graphite Lanka PLC
- Business Description
- Product Portfolio
- Strategic Alliances or Partnerships
- Recent Developments
- Financial Details
- Others
- Syrah Resources
- Business Description
- Product Portfolio
- Strategic Alliances or Partnerships
- Recent Developments
- Financial Details
- Others
- Vietnam Graphite JSC
- Business Description
- Product Portfolio
- Strategic Alliances or Partnerships
- Recent Developments
- Financial Details
- Others
- Shanshan Technology
- Business Description
- Product Portfolio
- Strategic Alliances or Partnerships
- Recent Developments
- Financial Details
- Others
- SGL Carbon SE
- Business Description
- Product Portfolio
- Strategic Alliances or Partnerships
- Recent Developments
- Financial Details
- Others
- HEG Limited
- Business Description
- Product Portfolio
- Strategic Alliances or Partnerships
- Recent Developments
- Financial Details
- Others
- Imerys Group
- Business Description
- Product Portfolio
- Strategic Alliances or Partnerships
- Recent Developments
- Financial Details
- Others
- Jiangxi Zichen Technology Co., Ltd
- Business Description
- Product Portfolio
- Strategic Alliances or Partnerships
- Recent Developments
- Financial Details
- Others
- Others
- Tokai Carbon Co., Ltd.
- Company Profiles
- Disclaimer
MarkNtel Advisors follows a robust and iterative research methodology designed to ensure maximum accuracy and minimize deviation in market estimates and forecasts. Our approach combines both bottom-up and top-down techniques to effectively segment and quantify various aspects of the market. A consistent feature across all our research reports is data triangulation, which examines the market from three distinct perspectives to validate findings. Key components of our research process include:
1. Scope & Research Design At the outset, MarkNtel Advisors define the research objectives and formulate pertinent questions. This phase involves determining the type of research—qualitative or quantitative—and designing a methodology that outlines data collection methods, target demographics, and analytical tools. They also establish timelines and budgets to ensure the research aligns with client goals.
2. Sample Selection and Data Collection In this stage, the firm identifies the target audience and determines the appropriate sample size to ensure representativeness. They employ various sampling methods, such as random or stratified sampling, based on the research objectives. Data collection is carried out using tools like surveys, interviews, and observations, ensuring the gathered data is reliable and relevant.
3. Data Analysis and Validation Once data is collected, MarkNtel Advisors undertake a rigorous analysis process. This includes cleaning the data to remove inconsistencies, employing statistical software for quantitative analysis, and thematic analysis for qualitative data. Validation steps are taken to ensure the accuracy and reliability of the findings, minimizing biases and errors.

4. Data Forecast and FinalizationThe final phase involves forecasting future market trends based on the analyzed data. MarkNtel Advisors utilize predictive modeling and time series analysis to anticipate market behaviors. The insights are then compiled into comprehensive reports, featuring visual aids like charts and graphs, and include strategic recommendations to inform client decision-making
We offer flexible licensing options to cater to varying organizational needs. Choose the pricing pack that best suits your requirements:
Buy Now

