Asia-Pacific Ethylene Market Research Report: Forecast (2026-2032)
By Application (High-Density Polyethylene (HDPE), Low-Density Polyethylene (LDPE), Linear Low-Density Polyethylene (LLDPE), Ethylene Oxide (EO), Ethylbenzene (EB), Vinyl Acetate Mo ... nomer (VAM), Ethylene Dichloride (EDC), Others), By Feedstock (Naphtha, Natural Gas (Ethane-Based Feedstock), Others), By End-User Industry (Chemicals, Packaging, Building & Construction, Automotive, Textile, Food & Beverages, Personal Care & Cosmetics, Healthcare & Medical, Others), and others Read more
- Chemicals
- Jun 2026
- Pages 220
- Report Format: PDF, Excel, PPT
Asia-Pacific Ethylene Market
Projected 2.38% CAGR from 2026 to 2032
Study Period
2026-2032
Market Size (2026)
USD 66 Billion
Market Size (2032)
USD 76 Billion
Base Year
2025
Projected CAGR
2.38%
Leading Segments
By Application: High-Density Polyethylene (HDPE)
Asia Pacific Ethylene Market Key Takeaways
- Asia Pacific Ethylene market size was valued at USD 62 billion in 2025 and is projected to grow from USD 66 billion in 2026 to USD 76 billion by 2032.
- The industry is projected to reflect sustained growth at a steady CAGR of 2.38% during 2026-2032.
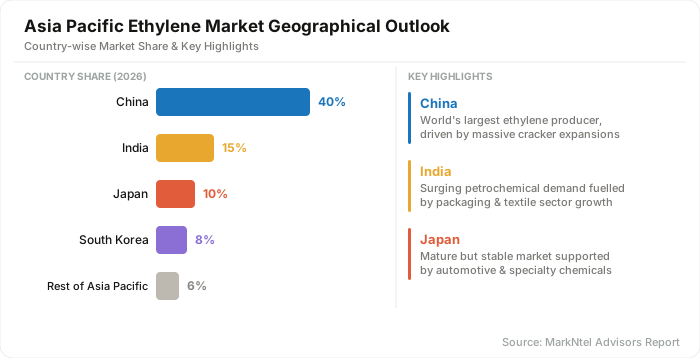
- China holds the largest share of about 40% in 2026.
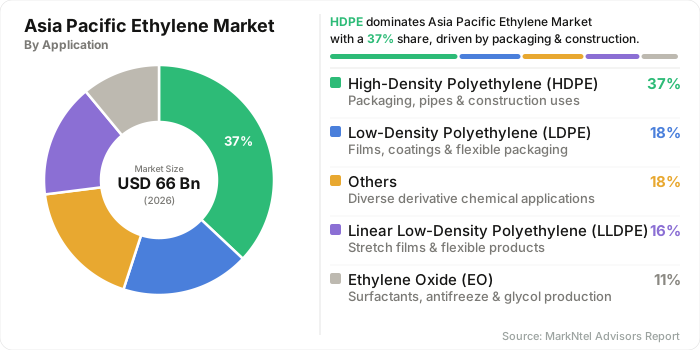
- By application, High-density polyethylene holds a significant share of about 37% in 2026.
- By end user, packaging seized a significant share of about 38% in 2026.
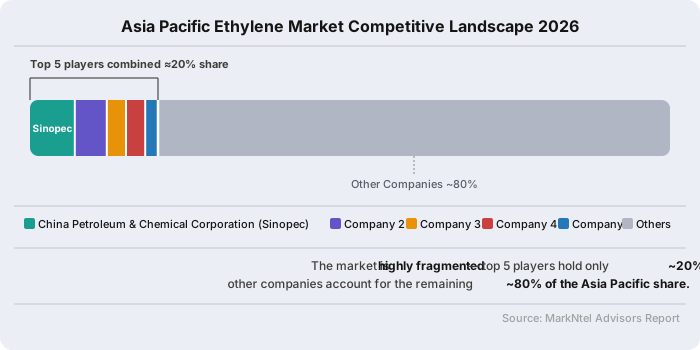
- The industry is highly fragmented. However, the top five players collectively account for nearly 20% share.
Asia Pacific Ethylene Market Size and Outlook
The Asia Pacific Ethylene market size was valued at USD 62 billion in 2025 and is projected to grow from USD 66 billion in 2026 to USD 76 billion by 2032. Along with this, the market is estimated to grow at a CAGR of around 2.38% during the forecast period, i.e., 2026-32, supported by rapid industrialization, expanding petrochemical investments, and rising demand from packaging, automotive, construction, and consumer goods industries.
Ethylene serves as a key raw material for polyethylene, ethylene glycol, and other downstream chemicals that are widely used across manufacturing value chains. Growing urban populations, increasing disposable incomes, and expanding infrastructure projects across China, India, Indonesia, Vietnam, and other Southeast Asian countries continue to strengthen demand for ethylene-based products.
A significant trend shaping the market is the increasing shift toward feedstock diversification and cost-efficient production. In 2025, Chinese petrochemical companies, including Wanhua Chemical, Satellite Chemical, and Sanjiang Fine Chemical, invested in more than USD 16 billion in ethane crackers, storage facilities, and logistics infrastructure to secure long-term feedstock supplies and improve production economics.
This investment reflects the region's strategic focus on enhancing competitiveness while meeting rising domestic demand for petrochemical products. Similarly, Thailand's PTT Global Chemical announced plans to import 400,000 metric tons of U.S. ethane annually beginning in 2029, supported by new terminal and storage infrastructure, highlighting continued efforts to strengthen future ethylene production capabilities.
The market is also benefiting from growing demand for flexible packaging, lightweight automotive materials, electric vehicle components, consumer electronics, and modern construction materials. At the same time, governments and industry participants are increasingly investing in energy-efficient technologies, emissions-reduction initiatives, and sustainable petrochemical production processes to comply with evolving environmental regulations.
Supported by ongoing capacity additions, technological advancements, and downstream industrial expansion, the Asia Pacific ethylene market is expected to play a central role in global petrochemical growth over the coming decade while continuing to attract substantial domestic and international investment.
Asia Pacific Ethylene Market Key Indicators
- Polyethylene production is one of the strongest indicators of ethylene demand because over 63% of global ethylene consumption is used to manufacture HDPE, LDPE, and LLDPE. These polymers are widely used in packaging, construction materials, consumer goods, and industrial applications. Any increase in polyethylene production directly translates into higher ethylene consumption. Capacity expansions across China, India, and Southeast Asia continue to support polyethylene output growth, making production statistics a leading indicator of market performance.
- Ethylene production capacity reflects the supply potential of the market and serves as a direct measure of industry expansion. China remains the dominant producer in the Asia-Pacific. According to industry and Reuters-reported data, China operated more than 54 million metric tons per year of ethylene capacity in 2025 and plans substantial additions through 2028. Rising capacity indicates confidence in future demand from packaging, automotive, and construction sectors while also influencing regional trade balances and investment activity.
- New petrochemical investments indicate future ethylene supply growth. Reuters reported that Chinese companies plan to add at least 7.7 million metric tons per year of new ethane-processing capacity between 2024 and 2026. These projects include crackers, storage facilities, and downstream polymer units. Such investments improve domestic production capabilities, reduce import dependence, and support growing demand from packaging and industrial sectors. Tracking announced projects provides an early indication of future market expansion and competitive positioning.
Asia Pacific Ethylene Market Scope:
| Category | Segments |
|---|---|
| By Application | High-Density Polyethylene (HDPE), Low-Density Polyethylene (LDPE), Linear Low-Density Polyethylene (LLDPE), Ethylene Oxide (EO), Ethylbenzene (EB), Vinyl Acetate Monomer (VAM), Ethylene Dichloride (EDC), Others |
| By Feedstock | Naphtha, Natural Gas (Ethane-Based Feedstock), Others |
| By End-User Industry | Chemicals, Packaging, Building & Construction, Automotive, Textile, Food & Beverages, Personal Care & Cosmetics, Healthcare & Medical, Others |
Asia Pacific Ethylene Market Growth Drivers
Growing Packaging Sector Supporting Asia Pacific Ethylene Market Growth
The packaging industry is a major growth driver for the Asia Pacific ethylene industry because ethylene is the primary feedstock used to manufacture polyethylene (PE), the world's most widely used packaging plastic. According to the International Energy Agency (IEA), increasing demand for plastics, particularly packaging materials, continues to be a key contributor to petrochemical consumption growth worldwide. The IEA further notes that petrochemicals are expected to account for a growing share of global oil demand as demand for plastic products expands.
In Asia, packaging remains the dominant end-use sector for polyethylene. Industry analysis based on regional consumption data indicates that packaging accounts for approximately 60% of polyethylene demand in Asia, highlighting the direct relationship between packaging growth and ethylene consumption.
Looking ahead, China, India, Indonesia, and Vietnam continue to expand petrochemical and packaging manufacturing capacity to meet rising consumer demand. The IEA reported that China alone added ethylene and propylene capacity between 2019 and 2024, equivalent to the combined existing capacity of Europe, Japan, and South Korea, creating a strong foundation for future packaging production growth.
As packaging remains the largest consumer of polyethylene, rising demand for packaged goods, e-commerce shipments, and consumer products will continue to increase ethylene consumption across the Asia Pacific. Sustained investments in packaging and petrochemical infrastructure are expected to strengthen long-term market growth for ethylene.
Recent Trends
Shift from Naphtha to Ethane Reshaping the Ethylene Industry
A notable trend in the Asia Pacific ethylene industry is the increasing shift from naphtha to ethane as a feedstock for ethylene production. Ethane offers a significant cost advantage because it is derived from natural gas and generally produces higher ethylene yields than naphtha.
Amid weak petrochemical margins and global oversupply, producers across Asia are modifying crackers to process more ethane and improve competitiveness. In 2025, China's SP Chemicals plans to increase ethane utilization at its Jiangsu complex from 75% to 90%, while several producers in China, Japan, and South Korea are investing in feedstock-flexible facilities.
The trend is supported by growing U.S. ethane availability. According to the U.S. Energy Information Administration (EIA), China imported a record 492,000 barrels per day of U.S. ethane in 2024, accounting for nearly half of total U.S. ethane exports. China's ethane imports were expected to reach 6.3–8.2 million metric tons in 2025, supported by more than USD 16 billion of investments in ethane crackers, storage facilities, and logistics infrastructure.
The transition toward ethane is lowering production costs and improving operating efficiency across Asia Pacific. Continued investments in import infrastructure and ethane-based cracking capacity are expected to strengthen regional ethylene production and support long-term market growth
Asia Pacific Ethylene Market Opportunities and Challenges
Environmental Regulations Creating Opportunities for Sustainable Ethylene Technologies
Environmental regulations and carbon emission targets have become a significant challenge for the Asia Pacific ethylene industry because ethylene production is highly energy-intensive and generates substantial greenhouse gas emissions. Governments across the region are tightening climate policies to achieve long-term decarbonization goals.
For instance, in 2025, Shell and China National Offshore Oil Corporation (CNOOC) announced the expansion of their petrochemical complex in Guangdong, China, with plans to incorporate advanced energy-efficiency technologies and lower-carbon manufacturing processes to align with China's carbon neutrality target of 2060. Such requirements increase capital expenditure for ethylene producers, who must invest in cleaner technologies, emissions monitoring systems, and energy-efficient operations while maintaining profitability.
However, these regulatory pressures are also creating opportunities for technological innovation. In 2025, Asian petrochemical producers continued investing in ethane-based cracking facilities to improve production economics and reduce emissions intensity compared with conventional naphtha-based processes. For example, several Chinese companies expanded ethane-cracking projects supported by rising U.S. ethane imports. Simultaneously, the industry is exploring carbon capture and storage (CCS), electrified steam crackers, and chemical recycling technologies as part of broader decarbonization efforts identified by the International Energy Agency (IEA).
According to the International Energy Agency (IEA), electrification and carbon capture could significantly reduce emissions from petrochemical manufacturing in the coming decades. As sustainability becomes a competitive differentiator, companies adopting low-carbon production methods are expected to gain regulatory advantages and attract investment.
Consequently, while stricter environmental regulations raise operating and compliance costs, they are simultaneously driving modernization and sustainable innovation across the Asia Pacific ethylene industry.
Segmentation Insights
High-Density Polyethylene Emerges as the Largest Application Segment in the Asia Pacific Ethylene Market
High-Density Polyethylene accounts for approximately 37% of the Asia Pacific ethylene industry revenue, making it the largest application segment. Its dominance is driven by extensive usage across packaging, construction, agriculture, infrastructure, and consumer goods industries. HDPE offers high strength, chemical resistance, durability, and moisture protection, making it a preferred material for bottles, containers, caps, industrial packaging, water pipes, gas distribution pipes, and geomembranes.
The rapid expansion of e-commerce, food and beverage packaging, and consumer goods manufacturing across China, India, Indonesia, and other Southeast Asian countries has significantly increased demand for HDPE-based packaging products. In addition, large-scale investments in infrastructure and urban development projects are supporting the consumption of HDPE pipes and construction materials. The material is also widely used in agricultural irrigation systems and industrial applications due to its long service life and cost-effectiveness.
With continued growth in packaging demand, infrastructure spending, and industrial production across the Asia Pacific, HDPE is expected to maintain its leading position and remain a key driver of ethylene consumption throughout the forecast period. Based on the application, the scope has been segmented into
- High-Density Polyethylene (HDPE)
- Low-Density Polyethylene (LDPE)
- Linear Low-Density Polyethylene (LLDPE)
- Ethylene Oxide (EO)
- Ethylbenzene (EB)
- Vinyl Acetate Monomer (VAM)
- Ethylene Dichloride (EDC)
- Others
Packaging Emerges as the Leading End-User Segment in the Asia Pacific Ethylene Market
Packaging accounts for approximately 38% of the Asia Pacific ethylene industry, making it the largest revenue-generating end-user segment. This dominance is primarily driven by the extensive use of ethylene-derived polyethylene materials, including HDPE, LDPE, and LLDPE, in flexible packaging, rigid containers, bottles, films, pouches, caps, and protective packaging solutions. The rapid growth of e-commerce, organized retail, and food delivery services across China, India, Indonesia, Vietnam, and other emerging Asian economies has significantly increased the demand for packaging materials.
Additionally, rising disposable incomes, changing consumer lifestyles, and growing consumption of packaged foods, beverages, personal care products, and pharmaceuticals have accelerated the need for high-performance packaging. The food and beverage industry remains a major consumer of polyethylene packaging due to its durability, moisture resistance, and cost-effectiveness. Furthermore, increasing demand for sustainable and lightweight packaging solutions is encouraging manufacturers to expand polyethylene production capacities.
As consumer spending, urbanization, and online retail penetration continue to rise across the region, the packaging sector is expected to remain the primary driver of ethylene demand throughout the forecast period. Based on the end-user, the scope has been classified into
- Chemicals
- Packaging
- Building & Construction
- Automotive
- Textile
- Food & Beverages
- Personal Care & Cosmetics
- Healthcare & Medical
- Others
Asia Pacific Ethylene Market Geographical Outlook
China accounts for approximately 40% of Asia Pacific ethylene demand, making it the largest market in the region. This dominance is primarily driven by the country's vast manufacturing base and rapid industrialization. China is the world's largest producer and consumer of polyethylene, ethylene glycol, and other ethylene derivatives, which are extensively used in packaging films, pipes, insulation materials, automotive components, and household products.
The country's booming e-commerce sector and growing middle-class population continue to increase demand for packaged foods, beverages, and consumer products, thereby boosting polyethylene consumption. In addition, China has significantly expanded its domestic ethylene production capacity through investments in integrated refining and petrochemical complexes, reducing reliance on imports while supporting downstream manufacturing growth.
Government initiatives aimed at strengthening industrial self-sufficiency and advancing high-value chemical production have further accelerated capacity additions. As infrastructure development, urbanization, and consumer spending continue to rise, China is expected to remain the primary growth engine for the Asia Pacific ethylene market over the coming years.
Asia Pacific Ethylene Market Competitive Analysis
The Asia Pacific ethylene market is highly fragmented, with competition among major integrated petrochemical producers and regional manufacturers. The top five players Sinopec, PetroChina, Reliance Industries Limited, Indian Oil Corporation Limited, and Mitsubishi Chemical Corporation collectively account for approximately 20% of the market. The remaining share is distributed among numerous regional producers, creating a competitive market landscape.
Key Players in the Asia Pacific Ethylene Market
- Sinopec
- PetroChina
- Reliance Industries Limited
- Indian Oil Corporation Limited
- Mitsubishi Chemical Corporation
- LG Chem
- Lotte Chemical
- Hanwha TotalEnergies Petrochemical
- SK Geo Centric
- Yeochun NCC
- LyondellBasell Industries N.V.
- Dow Inc.
- Formosa Plastics Corporation
- Chandra Asri Pacific Tbk
- Haldia Petrochemicals Limited
- Others
Asia Pacific Ethylene Industry News and Recent Developments
November 2025: Indonesia Launches USD 4 Billion Ethylene Complex
Indonesia inaugurated a USD 4 billion petrochemical facility developed by Lotte Chemical. The project includes a naphtha cracker capable of producing 1 million metric tons of ethylene annually, marking the country's first major cracker addition in nearly three decades and strengthening Southeast Asia's ethylene supply base.
Impact Analysis: The new Lotte Chemical complex significantly enhances Indonesia’s domestic ethylene production capacity, reducing dependence on imports and improving supply security across Southeast Asia. The addition of 1 million tons of annual ethylene capacity is expected to support growth in polyethylene, packaging, automotive, and consumer goods industries while strengthening Indonesia’s position as a regional petrochemical manufacturing hub.
September 2025: Sinopec Launches Xinjiang Ethylene Expansion Project
China Petroleum & Chemical Corporation (Sinopec) commenced construction of an upgraded refining and petrochemical complex in Xinjiang. The project includes a new 800,000-ton-per-year ethylene cracker and is expected to be completed by 2029. The expansion will strengthen domestic ethylene supply and support downstream plastics and chemical manufacturing.
Impact Analysis: Sinopec’s Xinjiang expansion will increase China’s ethylene production capacity and support rising demand from downstream plastics, packaging, and industrial sectors. The 800,000-ton-per-year cracker will improve feedstock integration and operational efficiency while reinforcing China’s self-sufficiency in petrochemicals. The project is also expected to intensify regional competition and contribute to long-term market growth across Asia Pacific.
Frequently Asked Questions
- Market Segmentation
- Introduction
- Product Definition
- Research Process
- Assumptions
- Executive Summary
- Asia Pacific Ethylene Market Policies, Regulations, and Product Standards
- Asia Pacific Ethylene Production (Thousand Tons) Trend 2022-2032
- Asia Pacific Ethylene Production (Thousand Tons) Trend
- Company-wise Production Plants and Statistics
- Installed Production Capacity
- Actual Production
- Planned Production Target
- Asia Pacific Ethylene Pricing Analysis 2022-2032
- Asia Pacific Ethylene Pricing Trend (USD/Tons) 2022-2032
- Asia Pacific Ethylene Pricing Trend (USD/Tons) By Country 2022-2032
- China
- India
- Japan
- South Korea
- Southeast Asia
- Australia & New Zealand
- Rest of Asia-Pacific
- Asia Pacific Ethylene Pricing Trend (USD/Tons) By Application 2022-2032
- High-Density Polyethylene (HDPE)
- Low-Density Polyethylene (LDPE)
- Linear Low-Density Polyethylene (LLDPE)
- Ethylene Oxide (EO)
- Ethylbenzene (EB)
- Vinyl Acetate Monomer (VAM)
- Ethylene Dichloride (EDC)
- Others
- Asia Pacific Ethylene Market Trends & Developments
- Asia Pacific Ethylene Market Dynamics
- Growth Factors
- Challenges
- Asia Pacific Ethylene Market Hotspot & Opportunities
- Asia Pacific Ethylene Market Outlook, 2022-2032F
- Market Size & Outlook
- By Revenues (USD Million)
- By Quantity Sold (Thousand Tons)
- Market Share & Analysis
- By Application- Market Size & Forecast 2022-2032, USD Million & Thousand Tons
- High-Density Polyethylene (HDPE)
- Low-Density Polyethylene (LDPE)
- Linear Low-Density Polyethylene (LLDPE)
- Ethylene Oxide (EO)
- Ethylbenzene (EB)
- Vinyl Acetate Monomer (VAM)
- Ethylene Dichloride (EDC)
- Others
- By Feedstock- Market Size & Forecast 2022-2032, USD Million & Thousand Tons
- Naphtha
- Natural Gas (Ethane-Based Feedstock)
- Others
- By End-User Industry- Market Size & Forecast 2022-2032, USD Million & Thousand Tons
- Chemicals
- Packaging
- Building & Construction
- Automotive
- Textile
- Food & Beverages
- Personal Care & Cosmetics
- Healthcare & Medical
- Others
- By Country
- China
- India
- Japan
- South Korea
- Southeast Asia
- Australia & New Zealand
- Rest of Asia-Pacific
- By Company
- Competition Characteristics
- Market Share & Analysis
- By Application- Market Size & Forecast 2022-2032, USD Million & Thousand Tons
- Market Size & Outlook
- China Ethylene Market Outlook, 2022-2032F
- Market Size & Outlook
- By Revenues (USD Million)
- By Quantity Sold (Thousand Tons)
- Market Share & Analysis
- By Application- Market Size & Forecast 2022-2032, USD Million & Thousand Tons
- By Feedstock- Market Size & Forecast 2022-2032, USD Million & Thousand Tons
- By End-User Industry- Market Size & Forecast 2022-2032, USD Million & Thousand Tons
- Market Size & Outlook
- India Ethylene Market Outlook, 2022-2032F
- Market Size & Outlook
- By Revenues (USD Million)
- By Quantity Sold (Thousand Tons)
- Market Share & Analysis
- By Application- Market Size & Forecast 2022-2032, USD Million & Thousand Tons
- By Feedstock- Market Size & Forecast 2022-2032, USD Million & Thousand Tons
- By End-User Industry- Market Size & Forecast 2022-2032, USD Million & Thousand Tons
- Market Size & Outlook
- Japan Ethylene Market Outlook, 2022-2032F
- Market Size & Outlook
- By Revenues (USD Million)
- By Quantity Sold (Thousand Tons)
- Market Share & Analysis
- By Application- Market Size & Forecast 2022-2032, USD Million & Thousand Tons
- By Feedstock- Market Size & Forecast 2022-2032, USD Million & Thousand Tons
- By End-User Industry- Market Size & Forecast 2022-2032, USD Million & Thousand Tons
- Market Size & Outlook
- South Korea Ethylene Market Outlook, 2022-2032F
- Market Size & Outlook
- By Revenues (USD Million)
- By Quantity Sold (Thousand Tons)
- Market Share & Analysis
- By Application- Market Size & Forecast 2022-2032, USD Million & Thousand Tons
- By Feedstock- Market Size & Forecast 2022-2032, USD Million & Thousand Tons
- By End-User Industry- Market Size & Forecast 2022-2032, USD Million & Thousand Tons
- Market Size & Outlook
- Vietnam Ethylene Market Outlook, 2022-2032F
- Market Size & Outlook
- By Revenues (USD Million)
- By Quantity Sold (Thousand Tons)
- Market Share & Analysis
- By Application- Market Size & Forecast 2022-2032, USD Million & Thousand Tons
- By Feedstock- Market Size & Forecast 2022-2032, USD Million & Thousand Tons
- By End-User Industry- Market Size & Forecast 2022-2032, USD Million & Thousand Tons
- Market Size & Outlook
- Thailand Ethylene Market Outlook, 2022-2032F
- Market Size & Outlook
- By Revenues (USD Million)
- By Quantity Sold (Thousand Tons)
- Market Share & Analysis
- By Application- Market Size & Forecast 2022-2032, USD Million & Thousand Tons
- By Feedstock- Market Size & Forecast 2022-2032, USD Million & Thousand Tons
- By End-User Industry- Market Size & Forecast 2022-2032, USD Million & Thousand Tons
- Market Size & Outlook
- Indonesia Ethylene Market Outlook, 2022-2032F
- Market Size & Outlook
- By Revenues (USD Million)
- By Quantity Sold (Thousand Tons)
- Market Share & Analysis
- By Application- Market Size & Forecast 2022-2032, USD Million & Thousand Tons
- By Feedstock- Market Size & Forecast 2022-2032, USD Million & Thousand Tons
- By End-User Industry- Market Size & Forecast 2022-2032, USD Million & Thousand Tons
- Market Size & Outlook
- Australia & New Zealand Ethylene Market Outlook, 2022-2032F
- Market Size & Outlook
- By Revenues (USD Million)
- By Quantity Sold (Thousand Tons)
- Market Share & Analysis
- By Application- Market Size & Forecast 2022-2032, USD Million & Thousand Tons
- By Feedstock- Market Size & Forecast 2022-2032, USD Million & Thousand Tons
- By End-User Industry- Market Size & Forecast 2022-2032, USD Million & Thousand Tons
- Market Size & Outlook
- Asia Pacific Ethylene Market Key Strategic Imperatives for Success & Growth
- Competitive Outlook
- Company Profiles
- Sinopec
- Business Description
- Product Portfolio
- Collaborations & Alliances
- Recent Developments
- Financial Details
- Others
- PetroChina
- Business Description
- Product Portfolio
- Collaborations & Alliances
- Recent Developments
- Financial Details
- Others
- Reliance Industries Limited
- Business Description
- Product Portfolio
- Collaborations & Alliances
- Recent Developments
- Financial Details
- Others
- Indian Oil Corporation Limited
- Business Description
- Product Portfolio
- Collaborations & Alliances
- Recent Developments
- Financial Details
- Others
- Mitsubishi Chemical Corporation
- Business Description
- Product Portfolio
- Collaborations & Alliances
- Recent Developments
- Financial Details
- Others
- LG Chem
- Business Description
- Product Portfolio
- Collaborations & Alliances
- Recent Developments
- Financial Details
- Others
- Lotte Chemical
- Business Description
- Product Portfolio
- Collaborations & Alliances
- Recent Developments
- Financial Details
- Others
- Hanwha TotalEnergies Petrochemical
- Business Description
- Product Portfolio
- Collaborations & Alliances
- Recent Developments
- Financial Details
- Others
- SK Geo Centric
- Business Description
- Product Portfolio
- Collaborations & Alliances
- Recent Developments
- Financial Details
- Others
- Yeochun NCC
- Business Description
- Product Portfolio
- Collaborations & Alliances
- Recent Developments
- Financial Details
- Others
- LyondellBasell Industries N.V.
- Business Description
- Product Portfolio
- Collaborations & Alliances
- Recent Developments
- Financial Details
- Others
- Dow Inc.
- Business Description
- Product Portfolio
- Collaborations & Alliances
- Recent Developments
- Financial Details
- Others
- Formosa Plastics Corporation
- Business Description
- Product Portfolio
- Collaborations & Alliances
- Recent Developments
- Financial Details
- Others
- Chandra Asri Pacific Tbk
- Business Description
- Product Portfolio
- Collaborations & Alliances
- Recent Developments
- Financial Details
- Others
- Haldia Petrochemicals Limited
- Business Description
- Product Portfolio
- Collaborations & Alliances
- Recent Developments
- Financial Details
- Others
- Sinopec
- Company Profiles
- Disclaimer
MarkNtel Advisors follows a robust and iterative research methodology designed to ensure maximum accuracy and minimize deviation in market estimates and forecasts. Our approach combines both bottom-up and top-down techniques to effectively segment and quantify various aspects of the market. A consistent feature across all our research reports is data triangulation, which examines the market from three distinct perspectives to validate findings. Key components of our research process include:
1. Scope & Research Design At the outset, MarkNtel Advisors define the research objectives and formulate pertinent questions. This phase involves determining the type of research—qualitative or quantitative—and designing a methodology that outlines data collection methods, target demographics, and analytical tools. They also establish timelines and budgets to ensure the research aligns with client goals.
2. Sample Selection and Data Collection In this stage, the firm identifies the target audience and determines the appropriate sample size to ensure representativeness. They employ various sampling methods, such as random or stratified sampling, based on the research objectives. Data collection is carried out using tools like surveys, interviews, and observations, ensuring the gathered data is reliable and relevant.
3. Data Analysis and Validation Once data is collected, MarkNtel Advisors undertake a rigorous analysis process. This includes cleaning the data to remove inconsistencies, employing statistical software for quantitative analysis, and thematic analysis for qualitative data. Validation steps are taken to ensure the accuracy and reliability of the findings, minimizing biases and errors.

4. Data Forecast and FinalizationThe final phase involves forecasting future market trends based on the analyzed data. MarkNtel Advisors utilize predictive modeling and time series analysis to anticipate market behaviors. The insights are then compiled into comprehensive reports, featuring visual aids like charts and graphs, and include strategic recommendations to inform client decision-making
We offer flexible licensing options to cater to varying organizational needs. Choose the pricing pack that best suits your requirements:
Buy Now Inquire Before Buying
 Request Customization
 Talk to our Consultant