Global Flavored and Functional Water Hydration Market Analysis, 2020
By Product Type (Flavoured and Functional ), By Distribution Channel (Supermarkets /Hypermarkets, Specialty Stores, Convenience stores, Online Retail, Others), By Ingredient Type (...Vitamins and Minerals, Botanical Extracts, Amino Acids, Others), By Region (North America, South America, Europe, Middle East and Africa, Asia-Pacific), By Country (United States, Canada, Mexico, Brazil, Argentina, Germany, Italy, France, Spain, Russia, United Kingdom, Saudi Arabia, UAE, South Africa, China, India, Japan, South Korea, Australia), By Company Read more
- Food & Beverages
- Jan 2020
- Pages 195
- Report Format: PDF, Excel, PPT
To shift the consumer preference from carbonated drinks and high sugar beverage is driving the growth of Flavored and Functional Water Hydration market. Moreover, the consumers these days prefer a no-calories and sugar-free functional water. Functional water contains vitamins, minerals, herbs, and fruits and vegetables, the benefits of which are driving the demand for the flavored and functional water hydration since the recent years.
| Report Coverage | Details |
| Study Period | Historical Data: 2015-19 |
| Base Year: 2019 | |
| Forecast Period: 2020-25 | |
| Regions Covered | North America |
| Europe | |
| Asia-Pacific | |
| South America | |
| Middle East & Africa | |
| Unit Denominations | USD Million/Billion |
Moreover, increasing pollution, rapid urbanization, industrialization, and improving economic conditions having enhanced consumer purchasing power. Moreover, rising prevalence of obesity and sugar concerns has boosted the demand for flavored and functional bottled water in the market.
According to the MarkNtel Advisors’ research report titled “Global Flavored and Functional Water Hydration Market Analysis, 2020”, the CAGR of the market is expected to be around 8.4% and is expected to reach USD 44.28 billion during 2020-25. The consumers have become more conscious about the harmful effects of the single-use plastics. Manufacturers are opting for biodegradable packaging methods to further attract the consumers in purchasing their products.
Minerals and Vitamins Led the Segment of Flavored and Functional Water Hydration
With the rising preference of consumers for about importance of vitamins, minerals, botanical extracts, and amino acids. Consumers are increasingly shifting their preference toward nutritional water rather than carbonated drinks.
Based on the distribution channel, grocery and departmental stores accounted for the largest market share in the sales of the functional water. Flavored and functional water is available in specialty stores that offer healthy food and beverage. The sales through online distribution is witnessing a huge growth and is expected to witness a surge in demand.
The US, Germany, France, Italy, and Japan are the leading markets in the Flavored and Functional Water Hydration market, largely due to the urban population in these countries is getting more concerned about their appearance and staying fit. The emerging countries in South America, Middle East region, and Asia-Pacific are showing a considerable growth and are expected to grow further during 2020-25.
According to the MarkNtel Advisors, the major leading players are Nestle, Danon, Kraft Foods, Coca-Cola, New York Spring Water, Pepsico, Hint, Herbal Water, Talking Rain Beverage, and Sunny Delight among others.
Frequently Asked Questions
1. Introduction
1.1. Product Definition
1.2. Research Process
1.3. Assumptions
1.4. Market Segmentation
2. Executive Summary
3. Experts Verbatim-What our experts say?
4. Global Flavoured and Functional Water Hydration Market Voice of Customer
4.1. Brand Awareness
4.2. End User Expectations
4.3. Key Factors Impacting Vendor Selection
4.4. Key Issues Encountered
4.5. Vendor’s Receptiveness to Address Key Customer Issues
4.6. Future Requirements
5. Global Flavoured and Functional Water Hydration Market Analysis, 2015- 2025F
5.1. Market Size & Analysis
5.1.1. By Revenues
5.2. Market Share & Analysis
5.2.1. By Product Type
5.2.1.1. Flavoured
5.2.1.2. Functional
5.2.2. By Ingredient Type
5.2.2.1. Vitamins and Minerals
5.2.2.2. Botanical Extracts
5.2.2.3. Amino Acids
5.2.2.4. Others
5.2.3. By Distribution Channel
5.2.3.1. Supermarkets/Hypermarkets
5.2.3.2. Specialty Stores
5.2.3.3. Connivence stores
5.2.3.4. Online Retail
5.2.3.5. Others
5.2.4. By Region
5.2.4.1. North America
5.2.4.2. South America
5.2.4.3. Europe
5.2.4.4. Middle East and Africa
5.2.4.5. Asia-Pacific
5.2.5. By Company
5.2.5.1. Revenue Shares
5.2.5.2. Strategic Factorial Indexing
5.2.5.3. Competitor Placement in MarkNtel Quadrant
6. North America Flavoured and Functional Water Hydration Market Analysis, 2015- 2025F
6.1. Market Size & Analysis
6.1.1. By Revenues
6.2. Market Share & Analysis
6.2.1. By Product Type
6.2.2. By Ingredient Type
6.2.3. By Distribution Channel
6.2.4. By Country
6.2.4.1. United States
6.2.4.2. Canada
6.2.4.3. Mexico
6.3. United States Flavoured and Functional Water Hydration Market Analysis, 2015- 2025F
6.3.1. Market Size & Analysis
6.3.1.1. By Revenues
6.3.2. Market Share & Analysis
6.3.2.1. By Product Type
6.3.2.2. By Ingredient Type
6.3.2.3. By Distribution Channel
6.4. Canada Flavoured and Functional Water Hydration Market Analysis, 2015- 2025F
6.4.1. Market Size & Analysis
6.4.1.1. By Revenues
6.4.2. Market Share & Analysis
6.4.2.1. By Product Type
6.4.2.2. By Ingredient Type
6.4.2.3. By Distribution Channel
6.5. Mexico Flavoured and Functional Water Hydration Market Analysis, 2015- 2025F
6.5.1. Market Size & Analysis
6.5.1.1. By Revenues
6.5.2. Market Share & Analysis
6.5.2.1. By Product Type
6.5.2.2. By Ingredient Type
6.5.2.3. By Distribution Channel
7. South America Flavoured and Functional Water Hydration Market Analysis, 2015-2025F
7.1. Market Size & Analysis
7.1.1. By Revenues
7.2. Market Share & Analysis
7.2.1. By Product Type
7.2.2. By Ingredient Type
7.2.3. By Distribution Channel
7.2.4. By Country
7.2.4.1. Brazil
7.2.4.2. Argentina
7.3. Brazil Flavoured and Functional Water Hydration Market Analysis, 2015- 2025F
7.3.1. Market Size & Analysis
7.3.1.1. By Revenues
7.3.2. Market Share & Analysis
7.3.2.1. By Product Type
7.3.2.2. By Ingredient Type
7.3.2.3. By Distribution Channel
7.4. Argentina Flavoured and Functional Water Hydration Market Analysis, 2015- 2025F
7.4.1. Market Size & Analysis
7.4.1.1. By Revenues
7.4.2. Market Share & Analysis
7.4.2.1. By Product Type
7.4.2.2. By Ingredient Type
7.4.2.3. By Distribution Channel
8. Europe Flavoured and Functional Water Hydration Market Analysis, 2015-2025F
8.1. Market Size & Analysis
8.1.1. By Revenues
8.2. Market Share & Analysis
8.2.1. By Demographic Consumption
8.2.2. By Ingredient Type
8.2.3. By Application
8.2.4. By Distribution Channel
8.2.5. By Country
8.2.5.1. Germany
8.2.5.2. France
8.2.5.3. Italy
8.2.5.4. Spain
8.2.5.5. Russia
8.2.5.6. United Kingdom
8.3. Germany Flavoured and Functional Water Hydration Market Analysis, 2015- 2025F
8.3.1. Market Size & Analysis
8.3.1.1. By Revenues
8.3.2. Market Share & Analysis
8.3.2.1. By Product Type
8.3.2.2. By Ingredient Type
8.3.2.3. By Distribution Channel
8.4. France Flavoured and Functional Water Hydration Market Analysis, 2015- 2025F
8.4.1. Market Size & Analysis
8.4.1.1. By Revenues
8.4.2. Market Share & Analysis
8.4.2.1. By Product Type
8.4.2.2. By Ingredient Type
8.4.2.3. By Distribution Channel
8.5. Italy Flavoured and Functional Water Hydration Market Analysis, 2015- 2025F
8.5.1. Market Size & Analysis
8.5.1.1. By Revenues
8.5.2. Market Share & Analysis
8.5.2.1. By Product Type
8.5.2.2. By Ingredient Type
8.5.2.3. By Distribution Channel
8.6. Spain Flavoured and Functional Water Hydration Market Analysis, 2015- 2025F
8.6.1. Market Size & Analysis
8.6.1.1. By Revenues
8.6.2. Market Share & Analysis
8.6.2.1. By Product Type
8.6.2.2. By Ingredient Type
8.6.2.3. By Distribution Channel
8.7. United Kingdom Flavoured and Functional Water Hydration Market Analysis, 2015- 2025F
8.7.1. Market Size & Analysis
8.7.1.1. By Revenues
8.7.2. Market Share & Analysis
8.7.2.1. By Product Type
8.7.2.2. By Ingredient Type
8.7.2.3. By Distribution Channel
8.8. United Kingdom Flavoured and Functional Water Hydration Market Analysis, 2015- 2025F
8.8.1. Market Size & Analysis
8.8.1.1. By Revenues
8.8.2. Market Share & Analysis
8.8.2.1. By Product Type
8.8.2.2. By Ingredient Type
8.8.2.3. By Distribution Channel
9. Middle East and Africa Flavoured and Functional Water Hydration Market Analysis, 2015-2025F
9.1. Market Size & Analysis
9.1.1. By Revenues
9.2. Market Share & Analysis
9.2.1. By Product Type
9.2.2. By Ingredient Type
9.2.3. By Distribution Channel
9.2.4. By Country
9.2.4.1. Saudi Arabia
9.2.4.2. UAE
9.2.4.3. South Africa
9.3. Saudi Arabia Flavoured and Functional Water Hydration Market Analysis, 2015- 2025F
9.3.1. Market Size & Analysis
9.3.1.1. By Revenues
9.3.2. Market Share & Analysis
9.3.2.1. By Product Type
9.3.2.2. By Ingredient Type
9.3.2.3. By Distribution Channel
9.4. UAE Flavoured and Functional Water Hydration Market Analysis, 2015- 2025F
9.4.1. Market Size & Analysis
9.4.1.1. By Revenues
9.4.2. Market Share & Analysis
9.4.2.1. By Product Type
9.4.2.2. By Ingredient Type
9.4.2.3. By Distribution Channel
9.5. South Africa Flavoured and Functional Water Hydration Market Analysis, 2015- 2025F
9.5.1. Market Size & Analysis
9.5.1.1. By Revenues
9.5.2. Market Share & Analysis
9.5.2.1. By Product Type
9.5.2.2. By Ingredient Type
9.5.2.3. By Distribution Channel
10. Asia-Pacific Flavoured and Functional Water Hydration Market Analysis, 2015-2025F
10.1.Market Size & Analysis
10.1.1. By Revenues
10.2.Market Share & Analysis
10.2.1. By Product Type
10.2.2. By Ingredient Type
10.2.3. By Distribution Channel
10.2.4. By Country
10.2.4.1. China
10.2.4.2. India
10.2.4.3. Japan
10.2.4.4. South Korea
10.2.4.5. Australia
10.3.China Flavoured and Functional Water Hydration Market Analysis, 2015- 2025F
10.3.1. Market Size & Analysis
10.3.1.1. By Revenues
10.3.2. Market Share & Analysis
10.3.2.1. By Product Type
10.3.2.2. By Ingredient Type
10.3.2.3. By Distribution Channel
10.4.India Flavoured and Functional Water Hydration Market Analysis, 2015- 2025F
10.4.1. Market Size & Analysis
10.4.1.1. By Revenues
10.4.2. Market Share & Analysis
10.4.2.1. By Product Type
10.4.2.2. By Ingredient Type
10.4.2.3. By Distribution Channel
10.5.Japan Flavoured and Functional Water Hydration Market Analysis, 2015- 2025F
10.5.1. Market Size & Analysis
10.5.1.1. By Revenues
10.5.2. Market Share & Analysis
10.5.2.1. By Product Type
10.5.2.2. By Ingredient Type
10.5.2.3. By Distribution Channel
10.6.South Korea Flavoured and Functional Water Hydration Market Analysis, 2015- 2025F
10.6.1. Market Size & Analysis
10.6.1.1. By Revenues
10.6.2. Market Share & Analysis
10.6.2.1. By Product Type
10.6.2.2. By Ingredient Type
10.6.2.3. By Distribution Channel
10.7.South Korea Flavoured and Functional Water Hydration Market Analysis, 2015- 2025F
10.7.1. Market Size & Analysis
10.7.1.1. By Revenues
10.7.2. Market Share & Analysis
10.7.2.1. By Product Type
10.7.2.2. By Ingredient Type
10.7.2.3. By Distribution Channel
11. Global Flavoured and Functional Water Hydration Market Policies, Regulations, Product and Services Standards
12. Global Flavoured and Functional Water Hydration Market Trends & Insights
13. Global Flavoured and Functional Water Hydration Market Dynamics
13.1.Growth Drivers
13.2.Challenges
13.3.Impact Analysis
14. Global Flavoured and Functional Water Hydration Market Hotspot & Opportunities
15. Global Flavoured and Functional Water Hydration Market Key Strategic Imperatives for Success & Growth
16. Global Flavoured and Functional Water Hydration Market Competition Outlook
16.1. Competition Matrix
16.1.1. Product Portfolio
16.1.2. Brand Specialization
16.1.3. Target Markets
16.1.4. Target End Users
16.1.5. Research & Development
16.1.6. Strategic Alliances
16.1.7. Strategic Initiatives
16.2. Company Profiles (Business Description, Product and Services Segments, Business Segments, Financials, Strategic Alliances/ Partnerships, Future Plans)
16.2.1. Nestle
16.2.2. Danone
16.2.3. Kraft Foods
16.2.4. Coca-Cola
16.2.5. New York Spring Water
16.2.6. Pepsico
16.2.7. Hint
16.2.8. Herbal Water
16.2.9. Talking Rain Beverage
16.2.10. Sunny Delight
17. Disclaimer
MarkNtel Advisors follows a robust and iterative research methodology designed to ensure maximum accuracy and minimize deviation in market estimates and forecasts. Our approach combines both bottom-up and top-down techniques to effectively segment and quantify various aspects of the market. A consistent feature across all our research reports is data triangulation, which examines the market from three distinct perspectives to validate findings. Key components of our research process include:
1. Scope & Research Design At the outset, MarkNtel Advisors define the research objectives and formulate pertinent questions. This phase involves determining the type of research—qualitative or quantitative—and designing a methodology that outlines data collection methods, target demographics, and analytical tools. They also establish timelines and budgets to ensure the research aligns with client goals.
2. Sample Selection and Data Collection In this stage, the firm identifies the target audience and determines the appropriate sample size to ensure representativeness. They employ various sampling methods, such as random or stratified sampling, based on the research objectives. Data collection is carried out using tools like surveys, interviews, and observations, ensuring the gathered data is reliable and relevant.
3. Data Analysis and Validation Once data is collected, MarkNtel Advisors undertake a rigorous analysis process. This includes cleaning the data to remove inconsistencies, employing statistical software for quantitative analysis, and thematic analysis for qualitative data. Validation steps are taken to ensure the accuracy and reliability of the findings, minimizing biases and errors.
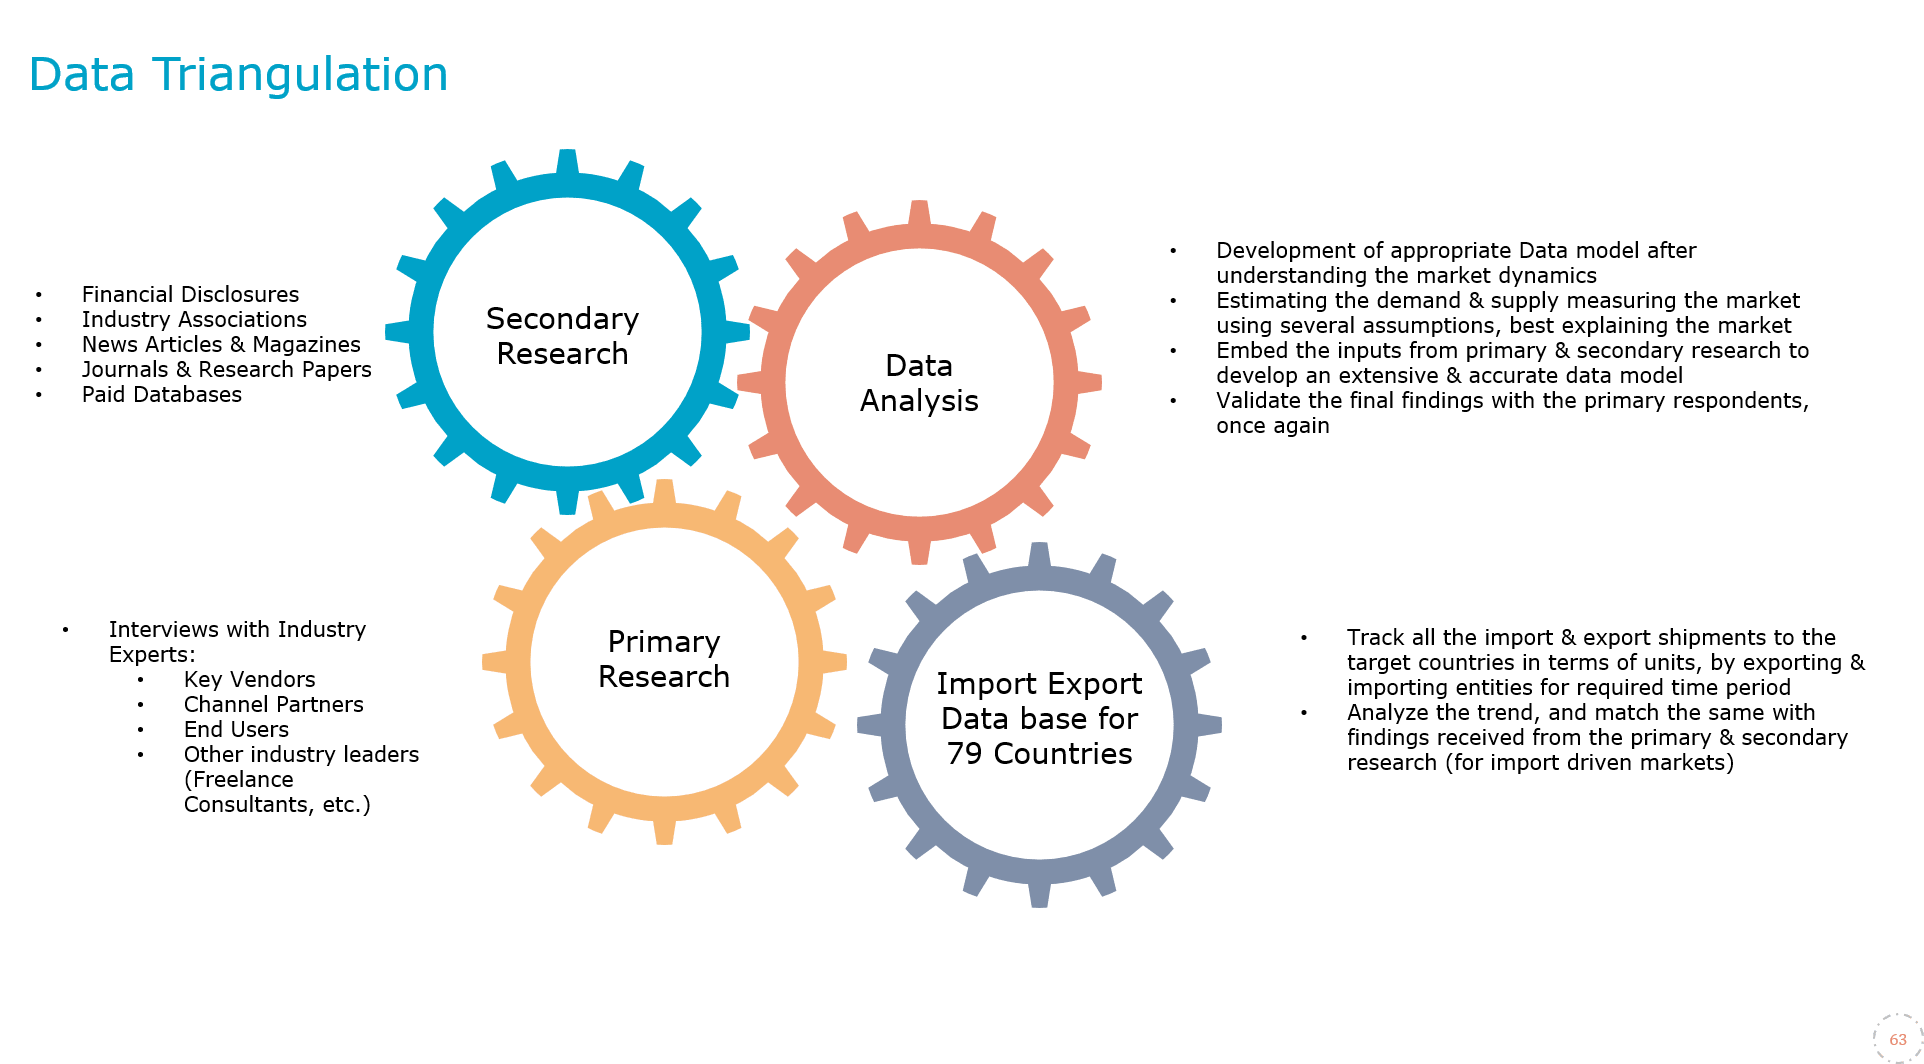
4. Data Forecast and FinalizationThe final phase involves forecasting future market trends based on the analyzed data. MarkNtel Advisors utilize predictive modeling and time series analysis to anticipate market behaviors. The insights are then compiled into comprehensive reports, featuring visual aids like charts and graphs, and include strategic recommendations to inform client decision-making

