
Global Commercial Satellite Imagery Market Research Report Forecast (2026-2032)
Commercial Satellite Imagery Market - By Type (Optical Imagery, Synthetic Aperture Radar (SAR) Imagery, Hyperspectral Imagery, Multispectral Imagery, Others), By Resolution (Very H ... igh Resolution (≤0.5 m), High Resolution (0.5–1 m), Medium Resolution (1–10 m), Low Resolution (>10 m), By Deployment Model (Single Satellite Systems, Satellite Constellations), By Orbit (Low Earth Orbit (LEO), Medium Earth Orbit (MEO), Geostationary Orbit (GEO), By Application Type (Mapping & Cartography, Change Detection & Monitoring, Surveillance & Reconnaissance, Asset & Infrastructure Monitoring, Crop Health & Yield Monitoring, Emissions & Environmental Monitoring, Maritime Domain Awareness), By End User (Government & Defense, Agriculture & Forestry, Energy & Natural Resources, Construction & Infrastructure, Environmental Monitoring & Disaster Management, Transportation & Logistics, Insurance & Finance, Others), and others Read more
- Aerospace & Defense
- Mar 2026
- Pages 450
- Report Format: PDF, Excel, PPT
Global Commercial Satellite Imagery Market
Projected 13.88% CAGR from 2026 to 2032
Study Period
2026-2032
Market Size (2026)
USD 7.01 Billion
Market Size (2032)
USD 15.29 Billion
Largest Region
North America
Projected CAGR
13.88%
Leading Segments
By Type: Optical Imagery
Global Commercial Satellite Imagery Market Report Key Takeaways:
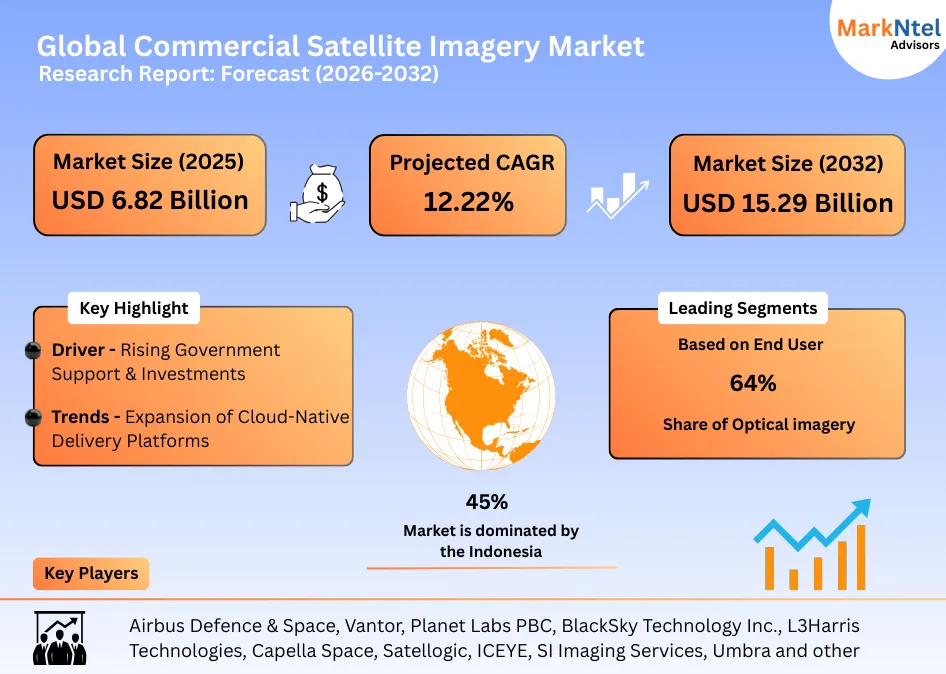
- Market size was valued at around USD 6.82 billion in 2025 and is projected to grow from USD 7.01 billion in 2026 to USD 15.29 billion by 2032. The estimated CAGR from 2026 to 2032 is around 13.88%, indicating strong growth.
- By Region, North America leads the Commercial Satellite Imagery Market by holding a market share of about 45%.
- By Type, the optical imagery segment represented a significant market share of about 64% in the Global Commercial Satellite Imagery Market in 2026.
- By End User, the government & defense segment represented a major share of the Global Commercial Satellite Imagery Market, around 48% in 2026.
- Leading Commercial Satellite Imagery companies are Airbus Defence & Space, Vantor, Planet Labs PBC, BlackSky Technology Inc., L3Harris Technologies, Capella Space, Satellogic, ICEYE, SI Imaging Services, Umbra, Muon Space, Earth-i, European Space Imaging, Galileo Group, LiveEO, GHGSat, Synspective, Deimos Imaging, and others.
Market Insights & Analysis: Global Commercial Satellite Imagery Market (2026-32):
The Global Commercial Satellite Imagery Market size was valued at around USD 6.82 billion in 2025 and is projected to grow from USD 7.01 billion in 2026 to USD 15.29 billion by 2032. Along with this, the market is estimated to grow at a CAGR of around 13.88% during the forecast period, i.e., 2026-32.
The Global Commercial Satellite Imagery Market is gaining momentum as Earth-observation data becomes essential across economic and public-sector activities. For instance, civil agencies increasingly procure commercial data to complement public satellites. Under its Commercial Satellite Data Acquisition (CSDA) program, the National Aeronautics and Space Administration has purchased commercial imagery for climate research, coastal change, and disaster monitoring, demonstrating institutional reliance on private operators.
For reference, Europe continues to stimulate downstream commercial use through open-data ecosystems. The European Space Agency reports that the Copernicus program supports hundreds of thousands of users worldwide, many of whom integrate free public data with higher-resolution commercial imagery for applications such as urban development and environmental compliance. This hybrid usage model is expanding the addressable market for private imagery providers.
Commercial adoption is also accelerating across key end-use industries. For instance, agriculture and forestry operators increasingly use frequent optical imagery to monitor crop stress and land-use change across millions of hectares globally, improving yield forecasting and resource planning. For reference, the insurance sector is scaling satellite-based damage assessment after floods, wildfires, and hurricanes, enabling faster claims validation and loss estimation without physical site inspections.
Similarly, energy and infrastructure operators rely on satellite imagery to monitor pipelines, power corridors, ports, and transport networks, while logistics companies use imagery to assess congestion and infrastructure readiness at major trade hubs.
Overall, expanding institutional adoption, hybrid public–commercial data use, and growing reliance across agriculture, infrastructure, insurance, and environmental monitoring are strengthening the long-term outlook for the global commercial satellite imagery market.
Global Commercial Satellite Imagery Market Recent Developments:
- June 2025: BlackSky announced plans to expand its satellite constellation with new multispectral, broad-area collection satellites called AROS. These will enhance high-cadence Earth observation for large-area digital mapping, change detection, and AI-driven geospatial applications, supporting commercial and government users with faster, wide-area imaging capabilities.
- November 2025: ICEYE launched five new Synthetic Aperture Radar (SAR) satellites into orbit, expanding its commercial constellation and supporting customer missions. These new satellites enhance global Earth observation imaging capacity, providing high-resolution SAR imagery in all weather and lighting conditions to commercial and governmental users around the world.
Global Commercial Satellite Imagery Market Scope:
| Category | Segments |
|---|---|
| By Type | Optical Imagery, Synthetic Aperture Radar (SAR) Imagery, Hyperspectral Imagery, Multispectral Imagery, Others, |
| By Resolution | Very High Resolution (≤0.5 m), High Resolution (0.5–1 m), Medium Resolution (1–10 m), Low Resolution (>10 m, |
| By Deployment Model | Single Satellite Systems, Satellite Constellations, |
| By Orbit | Low Earth Orbit (LEO), Medium Earth Orbit (MEO), Geostationary Orbit (GEO, |
| By Application Type | Mapping & Cartography, Change Detection & Monitoring, Surveillance & Reconnaissance, Asset & Infrastructure Monitoring, Crop Health & Yield Monitoring, Emissions & Environmental Monitoring, Maritime Domain Awareness, |
| By End User | Government & Defense, Agriculture & Forestry, Energy & Natural Resources, Construction & Infrastructure, Environmental Monitoring & Disaster Management, Transportation & Logistics, Insurance & Finance, Others), and others |
Global Commercial Satellite Imagery Market Driver:
Rising Government Support & Investments
Rising government investment and policy support are driving growth in this market by giving firms dependable revenue and direct funding for satellites and services. For instance, the U.S. National Geospatial-Intelligence Agency awarded a five-year Commercial GEOINT Access Portal contract worth roughly USD 359 million in 2024, illustrating a large, multi-year government procurement that underwrites imagery services.
Additionally, different national governments also provide targeted R&D funding to strengthen domestic capabilities. For instance, Finland granted approximately USD47.2 million to ICEYE in 2025 to scale SAR satellite production and sensors. Similarly, Asia-Pacific public–private initiatives are also expanding capacity, as an Indian EO public–private partnership involves a consortium investing about USD145 million to build a 12-satellite constellation.
These government contracts, grants, and PPPs shorten financing risk, enable faster constellation deployment, and encourage firms to invest in higher-resolution sensors, cloud delivery, and analytics. Consequently, public investment both guarantees demand and accelerates technological progress across the commercial satellite imagery sector.
Global Commercial Satellite Imagery Market Trend:
Expansion of Cloud-Native Delivery Platforms
The commercial satellite imagery companies have increasingly used cloud-native platforms to store, process, and deliver imagery faster and more efficiently. For instance, Planet Labs migrated its satellite imagery processing to Google Cloud Platform, which allowed the company to process six times more satellite images than before and scale operations smoothly during rapid growth.
Additionally, AWS Ground Station, a cloud service from Amazon Web Services, lets satellite operators downlink data directly into Amazon’s cloud infrastructure, where it can be stored, processed, and shared without building their own ground station networks. This approach can reduce costs and speed up data delivery. Moreover, Europe’s Copernicus Data Space Ecosystem served more than 200 PB of Earth-observation data in 2024 and supports hundreds of thousands of users through cloud platforms, demonstrating how cloud hosting massively improves data availability and throughput.
These cloud capabilities help satellite imagery providers meet growing demand for near-real-time data access and large-scale analytics across government and commercial sectors. Such integrations demonstrate a clear shift from traditional data delivery to cloud-native, scalable geospatial services in the satellite imagery market.
Global Commercial Satellite Imagery Market Challenges:
High Capital Intensity and Long Payback Periods
High capital intensity is a major challenge in the global commercial satellite imagery market because companies must invest heavily before earning revenue. For instance, building and launching a high-resolution Earth-observation satellite can cost tens to hundreds of millions of dollars when manufacturing, launch, insurance, and mission integration are combined. Additionally, widely used launch vehicles such as SpaceX’s Falcon 9 are publicly reported to cost around USD62–70 million per launch, making satellite deployment financially demanding.
Similarly, commercial success usually requires constellations rather than single satellites to achieve frequent revisit rates and reliable coverage. For reference, the global space sector recorded 259 orbital launches in 2024, reflecting the scale of capital needed just to maintain and expand satellite fleets. Beyond satellites and launches, operators must also invest in ground stations, data processing systems, cloud infrastructure, and long-term operations, which increase fixed costs every year.
Moreover, revenues take time to materialize. Satellite imagery providers often rely on long-term government or large enterprise contracts to recover investments. For instance, Planet Labs’ USD230 million Pelican satellite build contract shows how companies commit large capital years before full commercial returns.
Global Commercial Satellite Imagery Market (2026-32) Segmentation Analysis:
The Global Commercial Satellite Imagery Market Report and Forecast 2026-2032 offers a detailed analysis of the market based on the following segments:
Based on Type
- Optical Imagery
- Synthetic Aperture Radar (SAR) Imagery
- Hyperspectral Imagery
- Multispectral Imagery
- Others
Optical imagery continues to dominate this market, holding about 64% market share, because it provides clear, natural-looking images that are easy for most users to understand and apply across operations. For instance, large commercial optical fleets operated by companies such as Planet Labs PBC deliver near-daily global coverage using hundreds of small optical satellites, enabling frequent monitoring for mapping, agriculture, and disaster response. This high revisit rate makes optical imagery highly practical for routine decision-making.
Additionally, the Satellite Industry Association reported a sharp rise in commercially launched satellites in 2023, with a significant share being optical smallsats designed to maximize coverage and revisit rather than niche sensing. This reflects market preference for scalable, visually intuitive imagery.
Moreover, optical data integrates easily into enterprise workflows. Insurance companies use optical imagery for damage assessment, infrastructure operators rely on it for asset inspection, and planners use it for land-use analysis. Similarly, multispectral optical missions such as the European Space Agency’s Sentinel-2 provide ready-to-use spectral bands that support crop health and environmental monitoring, reinforcing optical imagery’s broad usability. These factors are contributing to the dominance of optical imagery in this market.
Based on the End-User
- Government & Defense
- Agriculture & Forestry
- Energy & Natural Resources
- Construction & Infrastructure
- Environmental Monitoring & Disaster Management
- Transportation & Logistics
- Insurance & Finance
- Others
The government and defense segment holds the largest market share of about 48% in this market because it requires continuous, high-resolution, and mission-critical imagery that cannot tolerate data gaps or delays. For instance, the United States Department of Defense confirmed that commercial satellite imagery is now routinely integrated into intelligence, surveillance, and reconnaissance (ISR) workflows to supplement military satellites, ensuring redundancy and faster access during conflicts and emergencies.
Similarly, defense adoption is expanding globally. For instance, the North Atlantic Treaty Organization formally recognized the use of commercial satellite imagery to support alliance-wide intelligence sharing and situational awareness following recent geopolitical conflicts in Europe. This shift allows NATO members to access timely imagery without relying solely on national assets. Such factors are significantly increasing the market demand.
Global Commercial Satellite Imagery Market (2026-32): Regional Projection
North America dominates the Global Commercial Satellite Imagery Market by accounting for about 45% market share due to its unmatched concentration of satellite operators, government demand, and supporting infrastructure. For instance, in 2023, U.S. firms built about 85% of the world’s commercially procured satellites, far exceeding any other region, reflecting strong leadership across commercial Earth-observation services.
Additionally, government demand is a major driver of this dominance. The U.S. Department of Defense and intelligence agencies collectively spend billions of dollars annually on commercial imagery and geospatial intelligence, supporting long-term contracts that provide revenue stability to imagery providers. This demand enables sustained investment in high-resolution optical and SAR constellations.
Moreover, Maxar Technologies continued securing large multi-year U.S. defense imagery contracts exceeding USD200 million in recent years, reinforcing the region’s revenue concentration.
Furthermore, North America benefits from launch and cloud leadership. For reference, the U.S. led global launch activity in 2024, supporting rapid constellation deployment, while cloud platforms headquartered in the region enable near-real-time imagery delivery. These factors are contributing to the dominance of North America in this market.
Gain a Competitive Edge with Our Global Commercial Satellite Imagery Market Report
- Global Commercial Satellite Imagery Market Report by MarkNtel Advisors provides a detailed & thorough analysis of market size & share, growth rate, competitive landscape, and key players. This comprehensive analysis helps businesses gain a holistic understanding of the market dynamics & make informed decisions.
- This report also highlights current market trends & future projections, allowing businesses to identify emerging opportunities & potential challenges. By understanding market forecasts, companies can align their strategies & stay ahead of the competition.
- Global Commercial Satellite Imagery Market Report aids in assessing & mitigating risks associated with entering or operating in the market. By understanding market dynamics, regulatory frameworks, and potential challenges, businesses can develop strategies to minimize risks & optimize their operations.
*Reports Delivery Format - Market research studies from MarkNtel Advisors are offered in PDF, Excel and PowerPoint formats. Within 24 hours of the payment being successfully received, the report will be sent to your email address.
Frequently Asked Questions
- Market Segmentation
- Introduction
- Product Definition
- Research Process
- Assumptions
- Executive Summary
- Global Commercial Satellite Imagery Market Policies, Regulations, Product Standards
- Global Commercial Satellite Imagery Market Trends & Development
- Global Commercial Satellite Imagery Market Dynamics
- Growth Drivers
- Challenges
- Global Commercial Satellite Imagery Market Hotspot & Opportunities
- Global Commercial Satellite Imagery Market Outlook, 2022-2032F
- Market Size & Analysis
- By Revenue (USD Million)
- Market Share & Analysis
- By Type- (USD Million)
- Optical Imagery
- Synthetic Aperture Radar (SAR) Imagery
- Hyperspectral Imagery
- Multispectral Imagery
- Others
- By Resolution- (USD Million)
- Very High Resolution (≤0.5 m)
- High Resolution (0.5–1 m)
- Medium Resolution (1–10 m)
- Low Resolution (>10 m)
- By Deployment Model- (USD Million)
- Single Satellite Systems
- Satellite Constellations
- By Orbit (USD Million)
- Low Earth Orbit (LEO)
- Medium Earth Orbit (MEO)
- Geostationary Orbit (GEO)
- By Application Type- (USD Million)
- Mapping & Cartography
- Change Detection & Monitoring
- Surveillance & Reconnaissance
- Asset & Infrastructure Monitoring
- Crop Health & Yield Monitoring
- Emissions & Environmental Monitoring
- Maritime Domain Awareness
- By End User- (USD Million)
- Government & Defense
- Agriculture & Forestry
- Energy & Natural Resources
- Construction & Infrastructure
- Environmental Monitoring & Disaster Management
- Transportation & Logistics
- Insurance & Finance
- Others
- By Region
- North America
- South America
- Europe
- Middle East & Africa
- Asia-Pacific
- By Company
- Competition Characteristics
- Market Share & Analysis
- By Type- (USD Million)
- Market Size & Analysis
- North America Commercial Satellite Imagery Market Outlook, 2022-2032F
- Market Size & Analysis
- By Revenue (USD Million)
- Market Share & Analysis
- By Type- (USD Million)
- By Resolution- (USD Million)
- By Deployment Model- (USD Million)
- By Orbit- (USD Million)
- By Application- (USD Million)
- By End User- (USD Million)
- By Country
- The US
- Canada
- The US Commercial Satellite Imagery Market Outlook, 2022-2032F
- Market Size & Analysis
- By Revenue (USD Million)
- Market Share & Analysis
- By Type- (USD Million)
- By Resolution- (USD Million)
- By Deployment Model- (USD Million)
- By Orbit- (USD Million)
- By Application- (USD Million)
- By End User- (USD Million)
- Market Size & Analysis
- Canada Commercial Satellite Imagery Market Outlook, 2022-2032F
- Market Size & Analysis
- By Revenue (USD Million)
- Market Share & Analysis
- By Type- (USD Million)
- By Resolution- (USD Million)
- By Deployment Model- (USD Million)
- By Orbit- (USD Million)
- By Application- (USD Million)
- By End User- (USD Million)
- Market Size & Analysis
- Market Size & Analysis
- South America Commercial Satellite Imagery Market Outlook, 2022-2032F
- Market Size & Analysis
- By Revenue (USD Million)
- Market Share & Analysis
- By Type- (USD Million)
- By Resolution- (USD Million)
- By Deployment Model- (USD Million)
- By Orbit- (USD Million)
- By Application- (USD Million)
- By End User- (USD Million)
- By Country
- Brazil
- Argentina
- Chile
- Rest of South America
- Brazil Commercial Satellite Imagery Market Outlook, 2022-2032F
- Market Size & Analysis
- By Revenue (USD Million)
- Market Share & Analysis
- By Type- (USD Million)
- By Resolution- (USD Million)
- By Deployment Model- (USD Million)
- By Orbit- (USD Million)
- By Application- (USD Million)
- By End User- (USD Million)
- Market Size & Analysis
- Argentina Commercial Satellite Imagery Market Outlook, 2022-2032F
- Market Size & Analysis
- By Revenue (USD Million)
- Market Share & Analysis
- By Type- (USD Million)
- By Resolution- (USD Million)
- By Deployment Model- (USD Million)
- By Orbit- (USD Million)
- By Application- (USD Million)
- By End User- (USD Million)
- Market Size & Analysis
- Chile Commercial Satellite Imagery Market Outlook, 2022-2032F
- Market Size & Analysis
- By Revenue (USD Million)
- Market Share & Analysis
- By Type- (USD Million)
- By Resolution- (USD Million)
- By Deployment Model- (USD Million)
- By Orbit- (USD Million)
- By Application- (USD Million)
- By End User- (USD Million)
- Market Size & Analysis
- Market Share & Analysis
- By Revenue (USD Million)
- Market Size & Analysis
- Europe Commercial Satellite Imagery Market Outlook, 2022-2032F
- Market Size & Analysis
- By Revenue (USD Million)
- Market Share & Analysis
- By Type- (USD Million)
- By Resolution- (USD Million)
- By Deployment Model- (USD Million)
- By Orbit- (USD Million)
- By Application- (USD Million)
- By End User- (USD Million)
- By Country
- The UK
- Germany
- France
- Spain
- Finland
- Italy
- BENELUX
- Rest of Europe
- The UK Commercial Satellite Imagery Market Outlook, 2022-2032F
- Market Size & Analysis
- By Revenue (USD Million)
- Market Share & Analysis
- By Type- (USD Million)
- By Resolution- (USD Million)
- By Deployment Model- (USD Million)
- By Orbit- (USD Million)
- By Application- (USD Million)
- By End User- (USD Million)
- Market Size & Analysis
- Germany Commercial Satellite Imagery Market Outlook, 2022-2032F
- Market Size & Analysis
- By Revenue (USD Million)
- Market Share & Analysis
- By Type- (USD Million)
- By Resolution- (USD Million)
- By Deployment Model- (USD Million)
- By Orbit- (USD Million)
- By Application- (USD Million)
- By End User- (USD Million)
- Market Size & Analysis
- France Commercial Satellite Imagery Market Outlook, 2022-2032F
- Market Size & Analysis
- By Revenue (USD Million)
- Market Share & Analysis
- By Type- (USD Million)
- By Resolution- (USD Million)
- By Deployment Model- (USD Million)
- By Orbit- (USD Million)
- By Application- (USD Million)
- By End User- (USD Million)
- Market Size & Analysis
- Spain Commercial Satellite Imagery Market Outlook, 2022-2032F
- Market Size & Analysis
- By Revenue (USD Million)
- Market Share & Analysis
- By Type- (USD Million)
- By Resolution- (USD Million)
- By Deployment Model- (USD Million)
- By Orbit- (USD Million)
- By Application- (USD Million)
- By End User- (USD Million)
- Market Size & Analysis
- Finland Commercial Satellite Imagery Market Outlook, 2022-2032F
- Market Size & Analysis
- By Revenue (USD Million)
- Market Share & Analysis
- By Type- (USD Million)
- By Resolution- (USD Million)
- By Deployment Model- (USD Million)
- By Orbit- (USD Million)
- By Application- (USD Million)
- By End User- (USD Million)
- Market Size & Analysis
- Italy Commercial Satellite Imagery Market Outlook, 2022-2032F
- Market Size & Analysis
- By Revenue (USD Million)
- Market Share & Analysis
- By Type- (USD Million)
- By Resolution- (USD Million)
- By Deployment Model- (USD Million)
- By Orbit- (USD Million)
- By Application- (USD Million)
- By End User- (USD Million)
- Market Size & Analysis
- BENELUX Commercial Satellite Imagery Market Outlook, 2022-2032F
- Market Size & Analysis
- By Revenue (USD Million)
- Market Share & Analysis
- By Type- (USD Million)
- By Resolution- (USD Million)
- By Deployment Model- (USD Million)
- By Orbit- (USD Million)
- By Application- (USD Million)
- By End User- (USD Million)
- Market Size & Analysis
- Market Share & Analysis
- By Revenue (USD Million)
- Market Size & Analysis
- Middle East & Africa Commercial Satellite Imagery Market Outlook, 2022-2032F
- Market Size & Analysis
- By Revenue (USD Million)
- Market Share & Analysis
- By Type- (USD Million)
- By Resolution- (USD Million)
- By Deployment Model- (USD Million)
- By Orbit- (USD Million)
- By Application- (USD Million)
- By End User- (USD Million)
- By Country
- Saudi Arabia
- UAE
- Israel
- South Africa
- Nigeria
- Rest of Middle East & Africa
- Saudi Arabia Commercial Satellite Imagery Market Outlook, 2022-2032F
- Market Size & Analysis
- By Revenue (USD Million)
- Market Share & Analysis
- By Type- (USD Million)
- By Resolution- (USD Million)
- By Deployment Model- (USD Million)
- By Orbit- (USD Million)
- By Application- (USD Million)
- By End User- (USD Million)
- Market Size & Analysis
- UAE Commercial Satellite Imagery Market Outlook, 2022-2032F
- Market Size & Analysis
- By Revenue (USD Million)
- Market Share & Analysis
- By Type- (USD Million)
- By Resolution- (USD Million)
- By Deployment Model- (USD Million)
- By Orbit- (USD Million)
- By Application- (USD Million)
- By End User- (USD Million)
- Market Size & Analysis
- Israel Commercial Satellite Imagery Market Outlook, 2022-2032F
- Market Size & Analysis
- By Revenue (USD Million)
- Market Share & Analysis
- By Type- (USD Million)
- By Resolution- (USD Million)
- By Deployment Model- (USD Million)
- By Orbit- (USD Million)
- By Application- (USD Million)
- By End User- (USD Million)
- Market Size & Analysis
- South Africa Commercial Satellite Imagery Market Outlook, 2022-2032F
- Market Size & Analysis
- By Revenue (USD Million)
- Market Share & Analysis
- By Type- (USD Million)
- By Resolution- (USD Million)
- By Deployment Model- (USD Million)
- By Orbit- (USD Million)
- By Application- (USD Million)
- By End User- (USD Million)
- Market Size & Analysis
- Nigeria Commercial Satellite Imagery Market Outlook, 2022-2032F
- Market Size & Analysis
- By Revenue (USD Million)
- Market Share & Analysis
- By Type- (USD Million)
- By Resolution- (USD Million)
- By Deployment Model- (USD Million)
- By Orbit- (USD Million)
- By Application- (USD Million)
- By End User- (USD Million)
- Market Size & Analysis
- Market Size & Analysis
- Asia-Pacific Commercial Satellite Imagery Market Outlook, 2022-2032F
- Market Size & Analysis
- By Revenue (USD Million)
- Market Share & Analysis
- By Type- (USD Million)
- By Resolution- (USD Million)
- By Deployment Model- (USD Million)
- By Orbit- (USD Million)
- By Application- (USD Million)
- By End User- (USD Million)
- By Country
- China
- India
- Japan
- South Korea
- Australia
- Rest of Asia-Pacific
- China Commercial Satellite Imagery Market Outlook, 2022-2032F
- Market Size & Analysis
- By Revenue (USD Million)
- Market Share & Analysis
- By Type- (USD Million)
- By Resolution- (USD Million)
- By Deployment Model- (USD Million)
- By Orbit- (USD Million)
- By Application- (USD Million)
- By End User- (USD Million)
- Market Size & Analysis
- India Commercial Satellite Imagery Market Outlook, 2022-2032F
- Market Size & Analysis
- By Revenue (USD Million)
- Market Share & Analysis
- By Type- (USD Million)
- By Resolution- (USD Million)
- By Deployment Model- (USD Million)
- By Orbit- (USD Million)
- By Application- (USD Million)
- By End User- (USD Million)
- Market Size & Analysis
- Japan Commercial Satellite Imagery Market Outlook, 2022-2032F
- Market Size & Analysis
- By Revenue (USD Million)
- Market Share & Analysis
- By Type- (USD Million)
- By Resolution- (USD Million)
- By Deployment Model- (USD Million)
- By Orbit- (USD Million)
- By Application- (USD Million)
- By End User- (USD Million)
- Market Size & Analysis
- South Korea Commercial Satellite Imagery Market Outlook, 2022-2032F
- Market Size & Analysis
- By Revenue (USD Million)
- Market Share & Analysis
- By Type- (USD Million)
- By Resolution- (USD Million)
- By Deployment Model- (USD Million)
- By Orbit- (USD Million)
- By Application- (USD Million)
- By End User- (USD Million)
- Market Size & Analysis
- Australia Commercial Satellite Imagery Market Outlook, 2022-2032F
- Market Size & Analysis
- By Revenue (USD Million)
- Market Share & Analysis
- By Type- (USD Million)
- By Resolution- (USD Million)
- By Deployment Model- (USD Million)
- By Orbit- (USD Million)
- By Application- (USD Million)
- By End User- (USD Million)
- Market Size & Analysis
- Market Share & Analysis
- By Revenue (USD Million)
- Market Size & Analysis
- Global Commercial Satellite Imagery Market Key Strategic Imperatives for Success & Growth
- Competition Outlook
- Company Profiles
- Airbus Defence & Space
- Business Description
- Product Portfolio
- Strategic Alliances or Partnerships
- Recent Developments
- Financial Details
- Others
- Vantor
- Business Description
- Product Portfolio
- Strategic Alliances or Partnerships
- Recent Developments
- Financial Details
- Others
- Planet Labs PBC
- Business Description
- Product Portfolio
- Strategic Alliances or Partnerships
- Recent Developments
- Financial Details
- Others
- BlackSky Technology Inc.
- Business Description
- Product Portfolio
- Strategic Alliances or Partnerships
- Recent Developments
- Financial Details
- Others
- L3Harris Technologies
- Business Description
- Product Portfolio
- Strategic Alliances or Partnerships
- Recent Developments
- Financial Details
- Others
- Capella Space
- Business Description
- Product Portfolio
- Strategic Alliances or Partnerships
- Recent Developments
- Financial Details
- Others
- Satellogic
- Business Description
- Product Portfolio
- Strategic Alliances or Partnerships
- Recent Developments
- Financial Details
- Others
- ICEYE
- Business Description
- Product Portfolio
- Strategic Alliances or Partnerships
- Recent Developments
- Financial Details
- Others
- SI Imaging Services (SIIS)
- Business Description
- Product Portfolio
- Strategic Alliances or Partnerships
- Recent Developments
- Financial Details
- Others
- Umbra
- Business Description
- Product Portfolio
- Strategic Alliances or Partnerships
- Recent Developments
- Financial Details
- Others
- Muon Space
- Business Description
- Product Portfolio
- Strategic Alliances or Partnerships
- Recent Developments
- Financial Details
- Others
- Earth-i
- Business Description
- Product Portfolio
- Strategic Alliances or Partnerships
- Recent Developments
- Financial Details
- Others
- European Space Imaging (EUSI)
- Business Description
- Product Portfolio
- Strategic Alliances or Partnerships
- Recent Developments
- Financial Details
- Others
- Galileo Group
- Business Description
- Product Portfolio
- Strategic Alliances or Partnerships
- Recent Developments
- Financial Details
- Others
- LiveEO
- Business Description
- Product Portfolio
- Strategic Alliances or Partnerships
- Recent Developments
- Financial Details
- Others
- GHGSat
- Business Description
- Product Portfolio
- Strategic Alliances or Partnerships
- Recent Developments
- Financial Details
- Others
- Synspective
- Business Description
- Product Portfolio
- Strategic Alliances or Partnerships
- Recent Developments
- Financial Details
- Others
- Deimos Imaging
- Business Description
- Product Portfolio
- Strategic Alliances or Partnerships
- Recent Developments
- Financial Details
- Others
- Others
- Airbus Defence & Space
- Company Profiles
- Disclaimer
MarkNtel Advisors follows a robust and iterative research methodology designed to ensure maximum accuracy and minimize deviation in market estimates and forecasts. Our approach combines both bottom-up and top-down techniques to effectively segment and quantify various aspects of the market. A consistent feature across all our research reports is data triangulation, which examines the market from three distinct perspectives to validate findings. Key components of our research process include:
1. Scope & Research Design At the outset, MarkNtel Advisors define the research objectives and formulate pertinent questions. This phase involves determining the type of research—qualitative or quantitative—and designing a methodology that outlines data collection methods, target demographics, and analytical tools. They also establish timelines and budgets to ensure the research aligns with client goals.
2. Sample Selection and Data Collection In this stage, the firm identifies the target audience and determines the appropriate sample size to ensure representativeness. They employ various sampling methods, such as random or stratified sampling, based on the research objectives. Data collection is carried out using tools like surveys, interviews, and observations, ensuring the gathered data is reliable and relevant.
3. Data Analysis and Validation Once data is collected, MarkNtel Advisors undertake a rigorous analysis process. This includes cleaning the data to remove inconsistencies, employing statistical software for quantitative analysis, and thematic analysis for qualitative data. Validation steps are taken to ensure the accuracy and reliability of the findings, minimizing biases and errors.

4. Data Forecast and FinalizationThe final phase involves forecasting future market trends based on the analyzed data. MarkNtel Advisors utilize predictive modeling and time series analysis to anticipate market behaviors. The insights are then compiled into comprehensive reports, featuring visual aids like charts and graphs, and include strategic recommendations to inform client decision-making
We offer flexible licensing options to cater to varying organizational needs. Choose the pricing pack that best suits your requirements:
Buy Now

