
Global Anemia Drugs Market Research Report: Forecast (2025-2030)
Anemia Drugs Market Size, Value and Forecast - By Anemia Type (Iron Deficiency Anemia, Pernicious Anemia, Aplastic Anemia, Hemolytic Anemia, Sickle Cell Anemia, Thalassemia, Others ... ), By Route of Administration (Oral, Injectable), By Distribution Channel (Hospital Pharmacies, Retail Pharmacies, Online Pharmacies) and Others Read more
- Healthcare
- Aug 2025
- Pages 188
- Report Format: PDF, Excel, PPT
Global Anemia Drugs Market
Projected 6.83% CAGR from 2025 to 2030
Study Period
2025-2030
Market Size (2024)
USD 14.62 Billion
Market Size (2030)
USD 21.73 Billion
Largest Region
North America
Projected CAGR
6.83%
Leading Segments
By Anemia Type: Iron-Deficiency Anemia
Market Definition
Anemia is a type of blood disorder which is caused by a deficiency of hemoglobin or red blood cells (RBCs) in the blood of both animals and humans. The symptoms of anemia may include fatigue, decreased focus and concentration, including shortness of breath on any intense physical activity. There are different types of anemia, such as microcytic, normocytic, macrocytic, and dimorphic anemia.
Market Insights & Analysis: Global Anemia Drugs Market (2025-30):
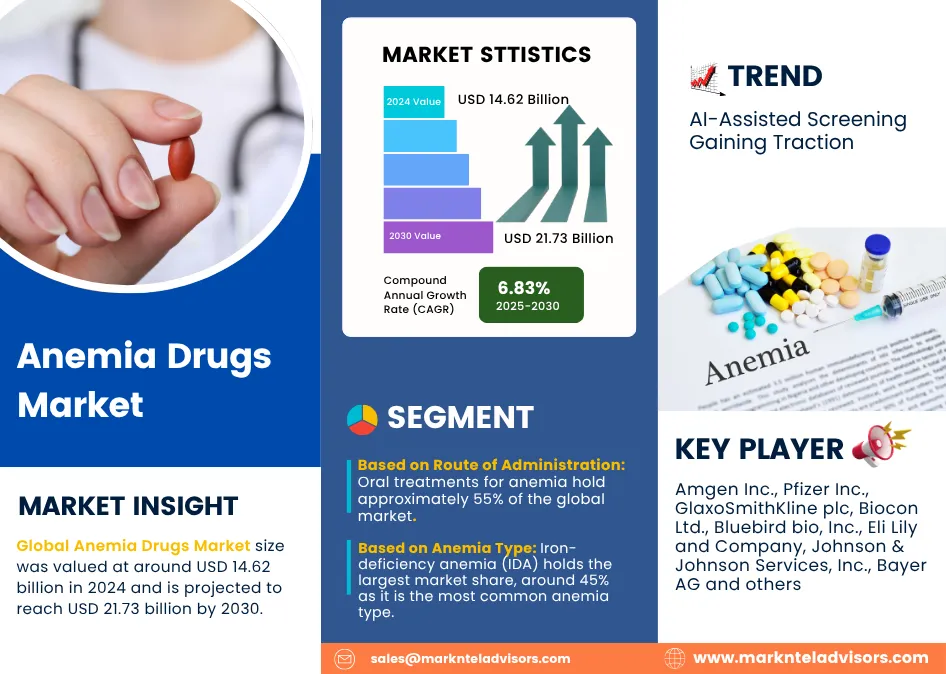
The Global Anemia Drugs Market size was valued at around USD 14.62 billion in 2024 and is projected to reach USD 21.73 billion by 2030. Along with this, the market is estimated to grow at a CAGR of around 6.83% during the forecast period, i.e., 2025-30. The main reason behind this growth is the rising anemia affliction and awareness, along with the aging of the population globally. Other factors include poor diet, genetics, underlying illnesses, non-adherence in patients, as well as limited access to healthcare in major regions of the world, such as in Africa and South Asia.
In response, several countries have increased their efforts against anemia, increasing the demand for anemia treatment and benefiting pharmaceutical companies. For instance, in 2023, India expanded its "Anemia Mukt Bharat" initiative by improving the supply chains for iron and folic acid tablets across its rural districts, due to which pharmaceutical companies involved in anemia drugs are now seeing a rise in procurement through public tenders. This demand has also driven activities in related industries, such as active pharmaceutical ingredient (API) production and packaging. For instance, in 2024, Lupin partnered with API suppliers across Southeast Asia to ensure that there was uninterrupted production of its iron-based formulations for anemia treatment programs.
Despite such efforts, anemia continues to affect public health, especially among the vulnerable population. For instance, in 2023, the World Health Organization (WHO) reported that certain demographic groups are disproportionately afflicted, amounting to about 35.5% of pregnant women aged 15–49 years and 39.8% of children under the age of 5, increasing the demand for more effective and accessible drug options in the market. While this causes the world to go off track in achieving a 50% reduction in anemia cases by the end of this decade, it makes way for companies to innovate and expand their portfolios of anemia drugs to meet this growing demand.
Global Anemia Drugs Market Scope:
| Category | Segments |
|---|---|
| By Anemia Type | Iron Deficiency Anemia, Pernicious Anemia, Aplastic Anemia, Hemolytic Anemia, Sickle Cell Anemia, Thalassemia, Others |
| By Route of Administration | Oral, Injectable |
| By Distribution Channel | Hospital Pharmacies, Retail Pharmacies, Online Pharmacies |
Furthermore, public-private partnerships (PPPs) and the involvement of non-governmental organizations (NGOs) play an important role in addressing the global impact of anemia, which is particularly serious in low and middle-income countries (LMICs). For instance, governments globally have collaborated with pharmaceutical companies to improve awareness and promote iron supplementation programs. These joint efforts are often implemented through national health initiatives with an aim to expand access to essential anemia drugs and close treatment gaps among vulnerable populations. As a result, such coordinated actions are driving the demand for effective anemia drugs in these countries.
Global Anemia Drugs Market Driver:
Innovations in Drug Technologies – There have been several innovations in the Global Anemia Drugs Market with the introduction of oral HIF-prolyl hydroxylase inhibitors, such as daprodustat and roxadustat, as alternatives to injectables, offering convenience and accessibility to patients. These oral drugs are particularly beneficial for patients afflicted with chronic kidney disease (CKD), where long-term treatment adherence and convenience become vital. For instance, in 2023, the US Food and Drug Administration (FDA) approved Jesduvroq (daprodustat) as the first once-a-day oral treatment for anemia associated with CKD in adults who are undergoing dialysis for at least four months. The typical treatment before this was approved by the FDA was injected into the bloodstream. Additionally, Roxadustat is another such oral drug for CKD-associated anemia, which was developed by FibroGen in partnership with AstraZeneca. These innovations help in providing patients with more options for anemia treatment, thereby driving demand and creating growth opportunities for pharmaceutical companies that specialize in anemia drugs.
Global Anemia Drugs Market Challenge:
Underdiagnoses and poor Patient Compliance – A major challenge hindering the growth of the Global Anemia Drugs Market is the high rate of underdiagnosis combined with a widespread reliance on low-cost over-the-counter (OTC) supplements. Many individuals who suffer from symptoms like fatigue and weakness often treat themselves with basic, inexpensive iron pills without seeking a proper medical diagnosis to determine what underlying cause and severity of anemia they have. For instance, while a bottle of generic OTC iron supplement may cost less than USD20, it often leads to poor compliance in patients because of its gastrointestinal side effects and may be insufficient or even inappropriate for moderate to severe cases or for anemia not caused by iron deficiency. This delays the patient's journey toward receiving effective, clinically proven treatments, thereby creating a barrier for the prescription drug market as a large portion of the potential patient base never receives a formal diagnosis or prescription for more effective drugs, such as advanced intravenous (IV) iron or novel oral formulations.
This is a situation that drives opportunity for market players and public health bodies to invest in large-scale awareness campaigns that emphasize the importance of proper diagnosis. Moreover, not addressing the issue of underdiagnoses will continue to suppress the market potential and hinder the adoption of more effective therapeutic agents, thereby constraining overall market growth during the forecast period.
Global Anemia Drugs Market Trend:
AI-Assisted Screening Gaining Traction – AI-powered anemia screening tools can be non-invasive for patients, as they can be used to analyze a person’s fingernail beds when compared to the regular screening methods. For instance, such an app was developed by the researchers from Emory University and Georgia Tech, which is an alternative to the conventional blood test. The hemoglobin in the blood can be reflected by the color of the fingernail bed, hemoglobin being the protein in the red blood cells (RBCs) which carry oxygen and give the blood its red hue. The fingernail beds become paler as the hemoglobin level drops. The AI algorithm in the app estimated hemoglobin levels with exceptional accuracy when tested on over 9,000 users, whose fingernail selfies were compared to their clinical blood test results.
Such innovation makes anemia screening more accessible for the population and reduces invasive procedures. Broadening the reach to underdiagnosed populations increases the number of individuals seeking treatment, contributing to the increased demand for anemia drugs. This trend represents a good opportunity for pharmaceutical companies to align their strategies with tech-enabled diagnostic ecosystems.
Global Anemia Drugs Market (2025-30): Segmentation Analysis
The Global Anemia Drugs Market study of MarkNtel Advisors evaluates & highlights the major trends and influencing factors in each segment. It includes predictions for the period 2025-30 at the global level. According to the analysis, the market has been further classified as:
Based on Anemia Type:
- Iron-Deficiency Anemia
- Pernicious Anemia
- Aplastic Anemia
- Hemolytic Anemia
- Sickle Cell Anemia
- Thalassemia
- Others
Iron-deficiency anemia (IDA) holds the largest market share, around 45% as it is the most common anemia type and a widespread nutritional deficiency. For instance, the WHO estimated that 30% of the population worldwide suffers from this condition, creating persistent demand for therapeutic solutions such as the adoption of intravenous (IV) iron infusions and the development of new oral formulations. Additionally, drugs like ferric carboxymaltose have gained considerable usage because of their ability to replete iron stores rapidly with a limited number of infusions, which gives them an advantage over traditional oral supplements that often have poor patient compliance due to gastrointestinal side effects. Thus, an opportunity lies in expanding the use of these advanced therapies, such as for the treatment of iron deficiency in patients with chronic conditions, like CKD, where oral iron drugs are often ineffective. These advancements, combined with growing awareness programs in developing countries, help in the continued focus on treating IDA. Therefore, this establishes IDA's ongoing growth and leadership in the market.
Based on Route of Administration:
- Oral
- Injectable
Oral treatments for anemia hold approximately 55% of the global market as they are affordable, accessible, and easy to use compared to other forms of anemia treatment. Their prominence in the Global Anemia Drugs Market is driven by their status as the first-line treatment for iron deficiency anemia. Ferrous salts such as ferrous sulfate, fumarate, and gluconate are available as tablets or syrup. Other types include ferrous glycine sulfate, bisglycinate, ascorbate, carbonate, tartrate, iodine, chloride, sodium citrate, aspartate, or succinate. Additionally, oral treatment also includes ferric complexes (mixed polysaccharides, polymaltose, or polydextrose) and Carbonyl iron and heme iron polypeptide.
Oral drugs are frequently prescribed in outpatient settings and are also incorporated into national supplementation programs. Additionally, once or twice daily dosing helps in drug refill rates without having to visit the clinics frequently. Furthermore, combined drugs, for example, iron plus folic acid and novel excipients, reduce gastrointestinal side effects, which creates opportunities for premium branded drugs. All these factors help in the sustenance of the segment’s leading market share and create opportunities for companies to launch differentiated, value-added products at large.
Global Anemia Drugs Market (2025-30): Regional Projections
Geographically, the Global Anemia Drugs Market expands across:
- North America
- South America
- Europe
- The Middle East & Africa
- Asia-Pacific
North America has the largest share in the Global Anemia Drugs Market, particularly in iron deficiency therapies alone. There are several factors, such as high spending on healthcare, robust R&D, advanced medical technologies, easy accessibility to outpatient medical care, and having numerous pharmaceutical companies and healthcare providers that offer treatments such as erythropoiesis-stimulating agents (ESAs) and intravenous (IV) iron therapies. This, combined with the high prevalence of CKD, cancer, heart failure, etc., increases the demand for anemia treatment, bringing consistent demand for both oral and injectable anemia medications across hospitals, dialysis centers, and oncology clinics in the North American region.
For instance, according to the CDC, in 2023, more than 35 million people in the US alone were estimated to have CKD, many of whom required ESA or iron therapy to treat anemia. Additionally, there is widespread insurance coverage and early screening practices, which ensure that the treatment starts promptly, further driving the drug demand. Furthermore, in North America, there are regular FDA approvals of new anemia treatments, allowing for their faster adoption. For instance, the drug Reblozyl (luspatercept), which was approved for anemia in MDS patients, recorded over USD425 million in U.S. sales in a single quarter of 2024. Therefore, supported by a strong pharma pipeline, advanced healthcare infrastructure, and persistent anemia cases, North America continues to dominate the Anemia Drugs Industry, and this trend is expected to persist through 2030.
Global Anemia Drugs Industry Recent Development:
- September 2024: Pfizer Inc. announced that it voluntarily withdrew all lots of OXBRYTA ® (voxelotor), which is used for the treatment of sickle cell disease (SCD), in all the markets where it was approved. It also discontinued all active voxelotor clinical trials as well as the expanded access programs worldwide. This decision by Pfizer Inc. was taken because they had researched the clinical data, which indicated that the overall benefit of OXBRYTA no longer outweighed the risk in the approved sickle cell patient population.
- April 2024: Zydus Lifesciences announced that China’s National Medical Products Administration of China (NMPA) accepted the New Drug Application (NDA) for Desidustat tablets. The Phase III trial of the drug in China showed positive results.
Gain a Competitive Edge with Our Global Anemia Drugs Market Report
- Global Anemia Drugs Market Report by MarkNtel Advisors provides a detailed & thorough analysis of market size & share, growth rate, competitive landscape, and key players. This comprehensive analysis helps businesses gain a holistic understanding of market dynamics & make informed decisions.
- This report also highlights current market trends & future projections, allowing businesses to identify emerging opportunities & potential challenges. By understanding market forecasts, companies can align their strategies & stay ahead of the competition.
- Global Anemia Drugs Market Report aids in assessing & mitigating risks associated with entering or operating in the market. By understanding market dynamics, regulatory frameworks, and potential challenges, businesses can develop strategies to minimize risks & optimize their operations.
*Reports Delivery Format - Market research studies from MarkNtel Advisors are offered in PDF, Excel and PowerPoint formats. Within 24 hours of the payment being successfully received, the report will be sent to your email address.
Frequently Asked Questions
- Market Segmentation
- Introduction
- Product Definition
- Research Process
- Assumptions
- Executive Summary
- Global Anemia Drugs Market Regulations, Policies & Standards
- Global Anemia Drugs Market Trends & Developments
- Global Anemia Drugs Market Dynamics
- Growth Drivers
- Challenges
- Global Anemia Drugs Market Hotspots & Opportunities
- Global Anemia Drugs Market Value Chain Analysis
- Global Anemia Drugs Market Outlook, 2020-2030F
- Market Size & Analysis
- By Revenues (USD Million)
- Market Share & Analysis
- By Anemia Type
- Iron Deficiency Anemia – Market Size & Forecast 2020–2030, USD Million
- Pernicious Anemia – Market Size & Forecast 2020–2030, USD Million
- Aplastic Anemia – Market Size & Forecast 2020–2030, USD Million
- Hemolytic Anemia – Market Size & Forecast 2020–2030, USD Million
- Sickle Cell Anemia – Market Size & Forecast 2020–2030, USD Million
- Thalassemia – Market Size & Forecast 2020–2030, USD Million
- Others – Market Size & Forecast 2020–2030, USD Million
- By Route of Administration
- Oral – Market Size & Forecast 2020–2030, USD Million
- Injectable – Market Size & Forecast 2020–2030, USD Million
- By Distribution Channel
- Hospital Pharmacies – Market Size & Forecast 2020–2030, USD Million
- Retail Pharmacies – Market Size & Forecast 2020–2030, USD Million
- Online Pharmacies – Market Size & Forecast 2020–2030, USD Million
- Others – Market Size & Forecast 2020–2030, USD Million
- By Region
- North America
- South America
- Europe
- The Middle East & Africa
- Asia-Pacific
- By Anemia Type
- Market Size & Analysis
- North America Anemia Drugs Market Outlook, 2020-2030F
- Market Size & Analysis
- By Revenues (USD Million)
- Market Share & Analysis
- By Anemia Type – Market Size & Forecast 2020–2030, USD Million
- By Route of Administration– Market Size & Forecast 2020–2030, USD Million
- By Distribution Channel – Market Size & Forecast 2020–2030, USD Million
- By Country
- The US
- Canada
- Mexico
- The US Anemia Drugs Market Outlook, 2020-2030F
- Market Size & Analysis
- By Revenues (USD Million)
- Market Share & Analysis
- By Anemia Type – Market Size & Forecast 2020–2030, USD Million
- By Route of Administration – Market Size & Forecast 2020–2030, USD Million
- By Distribution Channel – Market Size & Forecast 2020–2030, USD Million
- Market Size & Analysis
- Canada Anemia Drugs Market Outlook, 2020-2030F
- Market Size & Analysis
- By Revenues (USD Million)
- Market Share & Analysis
- By Anemia Type – Market Size & Forecast 2020–2030, USD Million
- By Route of Administration – Market Size & Forecast 2020–2030, USD Million
- By Distribution Channel – Market Size & Forecast 2020–2030, USD Million
- Market Size & Analysis
- Mexico Anemia Drugs Market Outlook, 2020-2030F
- Market Size & Analysis
- By Revenues (USD Million)
- Market Share & Analysis
- By Anemia Type – Market Size & Forecast 2020–2030, USD Million
- By Route of Administration – Market Size & Forecast 2020–2030, USD Million
- By Distribution Channel – Market Size & Forecast 2020–2030, USD Million
- Market Size & Analysis
- Market Size & Analysis
- South America Anemia Drugs Market Outlook, 2020-2030F
- Market Size & Analysis
- By Revenues (USD Million)
- Market Share & Analysis
- By Anemia Type – Market Size & Forecast 2020–2030, USD Million
- By Route of Administration – Market Size & Forecast 2020–2030, USD Million
- By Distribution Channel – Market Size & Forecast 2020–2030, USD Million
- By Country
- Brazil
- Argentina
- Rest of South America
- Brazil Anemia Drugs Market Outlook, 2020-2030F
- Market Size & Analysis
- By Revenues (USD Million)
- Market Share & Analysis
- By Anemia Type – Market Size & Forecast 2020–2030, USD Million
- By Route of Administration – Market Size & Forecast 2020–2030, USD Million
- By Distribution Channel – Market Size & Forecast 2020–2030, USD Million
- Market Size & Analysis
- Argentina Anemia Drugs Market Outlook, 2020-2030F
- Market Size & Analysis
- By Revenues (USD Million)
- Market Share & Analysis
- By Anemia Type – Market Size & Forecast 2020–2030, USD Million
- By Route of Administration – Market Size & Forecast 2020–2030, USD Million
- By Distribution Channel – Market Size & Forecast 2020–2030, USD Million
- Market Size & Analysis
- Market Size & Analysis
- Europe Anemia Drugs Market Outlook, 2020-2030F
- Market Size & Analysis
- By Revenues (USD Million)
- Market Share & Analysis
- By Anemia Type – Market Size & Forecast 2020–2030, USD Million
- By Route of Administration – Market Size & Forecast 2020–2030, USD Million
- By Distribution Channel – Market Size & Forecast 2020–2030, USD Million
- By Country
- Germany
- United Kingdom
- France
- Italy
- Spain
- Rest of Europe
- Germany Anemia Drugs Market Outlook, 2020-2030F
- Market Size & Analysis
- By Revenues (USD Million)
- Market Share & Analysis
- By Anemia Type – Market Size & Forecast 2020–2030, USD Million
- By Route of Administration – Market Size & Forecast 2020–2030, USD Million
- By Distribution Channel – Market Size & Forecast 2020–2030, USD Million
- Market Size & Analysis
- United Kingdom Anemia Drugs Market Outlook, 2020-2030F
- Market Size & Analysis
- By Revenues (USD Million)
- Market Share & Analysis
- By Anemia Type – Market Size & Forecast 2020–2030, USD Million
- By Route of Administration – Market Size & Forecast 2020–2030, USD Million
- By Distribution Channel – Market Size & Forecast 2020–2030, USD Million
- Market Size & Analysis
- France Anemia Drugs Market Outlook, 2020-2030F
- Market Size & Analysis
- By Revenues (USD Million)
- Market Share & Analysis
- By Anemia Type – Market Size & Forecast 2020–2030, USD Million
- By Route of Administration – Market Size & Forecast 2020–2030, USD Million
- By Distribution Channel – Market Size & Forecast 2020–2030, USD Million
- Market Size & Analysis
- Italy Anemia Drugs Market Outlook, 2020-2030F
- Market Size & Analysis
- By Revenues (USD Million)
- Market Share & Analysis
- By Anemia Type – Market Size & Forecast 2020–2030, USD Million
- By Route of Administration – Market Size & Forecast 2020–2030, USD Million
- By Distribution Channel – Market Size & Forecast 2020–2030, USD Million
- Market Size & Analysis
- Spain Anemia Drugs Market Outlook, 2020-2030F
- Market Size & Analysis
- By Revenues (USD Million)
- Market Share & Analysis
- By Anemia Type – Market Size & Forecast 2020–2030, USD Million
- By Route of Administration – Market Size & Forecast 2020–2030, USD Million
- By Distribution Channel – Market Size & Forecast 2020–2030, USD Million
- Market Size & Analysis
- Market Size & Analysis
- Middle East and Africa Anemia Drugs Market Outlook, 2020-2030F
- Market Size & Analysis
- By Revenues (USD Million)
- Market Share & Analysis
- By Anemia Type – Market Size & Forecast 2020–2030, USD Million
- By Route of Administration – Market Size & Forecast 2020–2030, USD Million
- By Distribution Channel – Market Size & Forecast 2020–2030, USD Million
- By Country
- Saudi Arabia
- The UAE
- South Africa
- Rest of Middle East and Africa
- Saudi Arabia Anemia Drugs Market Outlook, 2020-2030F
- Market Size & Analysis
- By Revenues (USD Million)
- Market Share & Analysis
- By Anemia Type – Market Size & Forecast 2020–2030, USD Million
- By Route of Administration – Market Size & Forecast 2020–2030, USD Million
- By Distribution Channel – Market Size & Forecast 2020–2030, USD Million
- Market Size & Analysis
- The UAE Anemia Drugs Market Outlook, 2020-2030F
- Market Size & Analysis
- By Revenues (USD Million)
- Market Share & Analysis
- By Anemia Type – Market Size & Forecast 2020–2030, USD Million
- By Route of Administration – Market Size & Forecast 2020–2030, USD Million
- By Distribution Channel – Market Size & Forecast 2020–2030, USD Million
- Market Size & Analysis
- South Africa Anemia Drugs Market Outlook, 2020-2030F
- Market Size & Analysis
- By Revenues (USD Million)
- Market Share & Analysis
- By Anemia Type – Market Size & Forecast 2020–2030, USD Million
- By Route of Administration – Market Size & Forecast 2020–2030, USD Million
- By Distribution Channel – Market Size & Forecast 2020–2030, USD Million
- Market Size & Analysis
- Market Size & Analysis
- Asia-Pacific Anemia Drugs Market Outlook, 2020-2030F
- Market Size & Analysis
- By Revenues (USD Million)
- Market Share & Analysis
- By Anemia Type – Market Size & Forecast 2020–2030, USD Million
- By Route of Administration – Market Size & Forecast 2020–2030, USD Million
- By Distribution Channel – Market Size & Forecast 2020–2030, USD Million
- By Country
- China
- Japan
- India
- South Korea
- Australia
- Rest of Asia-Pacific
- China Anemia Drugs Market Outlook, 2020-2030F
- Market Size & Analysis
- By Revenues (USD Million)
- Market Share & Analysis
- By Anemia Type – Market Size & Forecast 2020–2030, USD Million
- By Route of Administration – Market Size & Forecast 2020–2030, USD Million
- By Distribution Channel – Market Size & Forecast 2020–2030, USD Million
- Market Size & Analysis
- Japan Anemia Drugs Market Outlook, 2020-2030F
- Market Size & Analysis
- By Revenues (USD Million)
- Market Share & Analysis
- By Anemia Type – Market Size & Forecast 2020–2030, USD Million
- By Route of Administration – Market Size & Forecast 2020–2030, USD Million
- By Distribution Channel – Market Size & Forecast 2020–2030, USD Million
- Market Size & Analysis
- India Anemia Drugs Market Outlook, 2020-2030F
- Market Size & Analysis
- By Revenues (USD Million)
- Market Share & Analysis
- By Anemia Type – Market Size & Forecast 2020–2030, USD Million
- By Route of Administration – Market Size & Forecast 2020–2030, USD Million
- By Distribution Channel – Market Size & Forecast 2020–2030, USD Million
- Market Size & Analysis
- South Korea Anemia Drugs Market Outlook, 2020-2030F
- Market Size & Analysis
- By Revenues (USD Million)
- Market Share & Analysis
- By Anemia Type – Market Size & Forecast 2020–2030, USD Million
- By Route of Administration – Market Size & Forecast 2020–2030, USD Million
- By Distribution Channel – Market Size & Forecast 2020–2030, USD Million
- Market Size & Analysis
- Australia Anemia Drugs Market Outlook, 2020-2030F
- Market Size & Analysis
- By Revenues (USD Million)
- Market Share & Analysis
- By Anemia Type – Market Size & Forecast 2020–2030, USD Million
- By Route of Administration – Market Size & Forecast 2020–2030, USD Million
- By Distribution Channel – Market Size & Forecast 2020–2030, USD Million
- Market Size & Analysis
- Market Size & Analysis
- Global Anemia Drugs Market Strategic Imperatives for Growth & Success
- Competition Outlook
- Company Profiles
- Amgen Inc.
- Business Description
- Product Portfolio
- Strategic Alliances or Partnerships
- Recent Developments
- Financial Details
- Others
- Pfizer Inc.
- Business Description
- Product Portfolio
- Strategic Alliances or Partnerships
- Recent Developments
- Financial Details
- Others
- GlaxoSmithKline plc
- Business Description
- Product Portfolio
- Strategic Alliances or Partnerships
- Recent Developments
- Financial Details
- Others
- Biocon Ltd.
- Business Description
- Product Portfolio
- Strategic Alliances or Partnerships
- Recent Developments
- Financial Details
- Others
- Bluebird bio, Inc.
- Business Description
- Product Portfolio
- Strategic Alliances or Partnerships
- Recent Developments
- Financial Details
- Others
- Eli Lilly and Company
- Business Description
- Product Portfolio
- Strategic Alliances or Partnerships
- Recent Developments
- Financial Details
- Others
- Johnson & Johnson Services, Inc.
- Business Description
- Product Portfolio
- Strategic Alliances or Partnerships
- Recent Developments
- Financial Details
- Others
- Bayer AG
- Business Description
- Product Portfolio
- Strategic Alliances or Partnerships
- Recent Developments
- Financial Details
- Others
- GlycoMimetics, Inc.
- Business Description
- Product Portfolio
- Strategic Alliances or Partnerships
- Recent Developments
- Financial Details
- Others
- Regen Biopharma Inc.
- Business Description
- Product Portfolio
- Strategic Alliances or Partnerships
- Recent Developments
- Financial Details
- Others
- Acceleron Pharma
- Business Description
- Product Portfolio
- Strategic Alliances or Partnerships
- Recent Developments
- Financial Details
- Others
- F. Hoffmann-La Roche Ltd.
- Business Description
- Product Portfolio
- Strategic Alliances or Partnerships
- Recent Developments
- Financial Details
- Others
- Novartis AG
- Business Description
- Product Portfolio
- Strategic Alliances or Partnerships
- Recent Developments
- Financial Details
- Others
- Zydus Lifesciences Ltd.
- Business Description
- Product Portfolio
- Strategic Alliances or Partnerships
- Recent Developments
- Financial Details
- Others
- Others
- Amgen Inc.
- Company Profiles
- Disclaimer
MarkNtel Advisors follows a robust and iterative research methodology designed to ensure maximum accuracy and minimize deviation in market estimates and forecasts. Our approach combines both bottom-up and top-down techniques to effectively segment and quantify various aspects of the market. A consistent feature across all our research reports is data triangulation, which examines the market from three distinct perspectives to validate findings. Key components of our research process include:
1. Scope & Research Design At the outset, MarkNtel Advisors define the research objectives and formulate pertinent questions. This phase involves determining the type of research—qualitative or quantitative—and designing a methodology that outlines data collection methods, target demographics, and analytical tools. They also establish timelines and budgets to ensure the research aligns with client goals.
2. Sample Selection and Data Collection In this stage, the firm identifies the target audience and determines the appropriate sample size to ensure representativeness. They employ various sampling methods, such as random or stratified sampling, based on the research objectives. Data collection is carried out using tools like surveys, interviews, and observations, ensuring the gathered data is reliable and relevant.
3. Data Analysis and Validation Once data is collected, MarkNtel Advisors undertake a rigorous analysis process. This includes cleaning the data to remove inconsistencies, employing statistical software for quantitative analysis, and thematic analysis for qualitative data. Validation steps are taken to ensure the accuracy and reliability of the findings, minimizing biases and errors.

4. Data Forecast and FinalizationThe final phase involves forecasting future market trends based on the analyzed data. MarkNtel Advisors utilize predictive modeling and time series analysis to anticipate market behaviors. The insights are then compiled into comprehensive reports, featuring visual aids like charts and graphs, and include strategic recommendations to inform client decision-making
We offer flexible licensing options to cater to varying organizational needs. Choose the pricing pack that best suits your requirements:
Buy Now

