
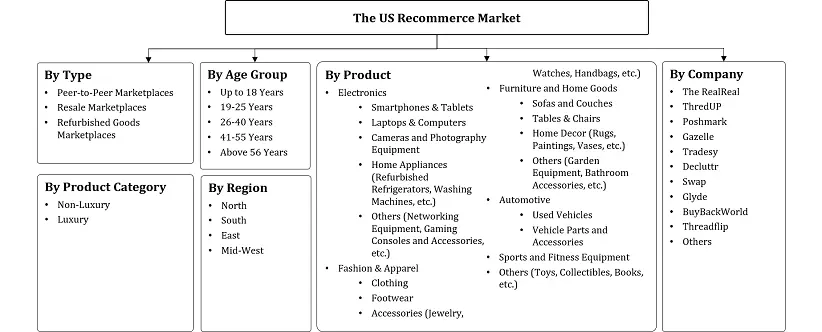
By Type (Peer-to-Peer Marketplaces, Resale Marketplaces, Refurbished Goods Marketplaces), By Product (Electronics, Fashion & Apparel, Furniture and Home Goods, Automotive, Sports and Fitness Equipment... ... nd Fitness Equipment), By Product Category (Non-Luxury, Luxury), By Age Group (Up to 18 Years, 19-25 Years, 26-40 Years, 41-55 Years, Above 56 Years), and others Read more
- ICT & Electronics
- Mar 2026
- 175
- PDF, Excel, PPT
US Recommerce Market Report Key Takeaways:
- The US Recommerce Market size was valued at USD 59.36 billion in 2025 and is projected to grow from USD 63.25 billion in 2026 to USD 92.55 billion by 2032, exhibiting a CAGR of 6.55% during the forecast period.
- By type, the resale marketplaces segment represented a significant share of about 47% in the US Recommerce Market in 2026.
- By product category, the non-luxury segment seized a significant share of about 72% in the US Recommerce Market in 2026.
- Leading companies in the market are The RealReal, ThredUP, Poshmark, Gazelle, Tradesy, Decluttr, Swap, Glyde, BuyBackWorld, Threadflip, and Others.
Market Insights & Analysis: US Recommerce Market (2026-32):
The US Recommerce Market size was valued at USD 59.36 billion in 2025 and is projected to grow from USD 63.25 billion in 2026 to USD 92.55 billion by 2032. Along with this, the market is estimated to grow at a CAGR of around 6.55% during the forecast period, i.e., 2026-32.
The US Recommerce Market is projected to expand steadily, driven by rising consumer preference for affordable, value-oriented purchasing and the increasing adoption of AI-driven personalization and dynamic pricing strategies, which enhance user engagement, optimize resale value, and improve overall transaction efficiency across digital platforms.
Persistently elevated living costs continue to influence purchasing decisions. According to the U.S. Bureau of Labor Statistics, consumer prices increased by 2.9% in 2024, with essential expenses such as shelter rising by 4.6% and food by 2.5%, placing ongoing pressure on household budgets. This economic environment is encouraging consumers to actively seek cost-effective alternatives, including second hand and refurbished goods.
Consumer sentiment further reinforces this transition. For instance, more than 51.5% of U.S. consumers planned to reduce retail spending in 2024, reflecting cautious financial behavior amid inflationary uncertainty. At the same time, external cost pressures are expected to intensify.
New tariff measures projected for 2025 could raise average household expenses by approximately USD 4,700 annually, accelerating the shift toward resale platforms as consumers prioritize value-driven purchasing .
Beyond economic drivers, secondhand consumption is becoming structurally embedded in U.S. retail behavior. On average, approximately 34% of items owned by U.S. consumers are second hand, indicating that resale is no longer a niche segment but an integral part of mainstream consumption . This trend is particularly visible in high-value categories. For instance, used electric vehicle sales reached 378,140 units in 2025, growing by 35.1% year-on-year, highlighting strong demand for refurbished and pre-owned durable goods.
Simultaneously, technological innovation is transforming the competitive landscape. AI-driven personalization and dynamic pricing are enhancing platform efficiency and user experience. A leading U.S. luxury resale platform, The RealReal, has implemented AI-based pricing models that analyze real-time demand, historical sales patterns, and customer behavior. This has improved inventory turnover and contributed to approximately 11% revenue growth in 2024, even amid broader luxury market slowdowns.
Similarly, Depop has strengthened its AI-powered search and recommendation capabilities, enabling better product discovery across millions of listings and supporting around 30% year-on-year growth, alongside higher user engagement.
At the platform level, companies such as Poshmark are actively integrating AI solutions. Its “Smart List AI” (2025) automates product listing by generating descriptions, categories, and attributes from images, reducing seller effort and improving marketplace efficiency.
Looking ahead, continued investments in AI infrastructure, combined with evolving consumer preferences for affordability and sustainability, are expected to further accelerate market penetration.
The convergence of economic pressure and technological advancement is reshaping the U.S. retail landscape in favor of re-commerce. As affordability concerns persist and AI capabilities mature, the market is set to witness robust and sustained growth in the coming years.
US Recommerce Market Recent Developments:
- 2025: Trove, a U.S.-based resale technology provider, is gaining traction by enabling brands to launch and manage their own recommerce platforms. Its AI-driven tools help optimize pricing, returns, and inventory decisions, while supporting resale, repair, and trade-in programs to enhance customer acquisition and revenue growth.
US Recommerce Market Scope:
| Category | Segments |
|---|---|
| By Type | (Peer-to-Peer Marketplaces, Resale Marketplaces, Refurbished Goods Marketplaces), |
| By Product | (Electronics, Fashion & Apparel, Furniture and Home Goods, Automotive, Sports and Fitness Equipment), |
| By Product Category | (Non-Luxury, Luxury), |
| By Age Group | (Up to 18 Years, 19-25 Years, 26-40 Years, 41-55 Years, Above 56 Years), |
US Recommerce Market Driver:
Rising Consumer Preference for Affordable and Value-Oriented Shopping
Rising consumer preference for affordable and value-oriented shopping is a key driver of the U.S. re-commerce market, supported by increasing cost pressures on household budgets. According to the U.S. Bureau of Labor Statistics, average annual consumer expenditure reached USD 78,535 in 2024, up from USD 77,158 in 2023, with housing costs alone increasing by 3.3%. This consistent rise in essential spending is significantly compressing disposable income, prompting consumers to seek cost-effective purchasing alternatives.
As a result, spending behavior is shifting toward value-based consumption. Data indicates that 62% of U.S. consumers reduced non-essential spending due to rising prices, actively prioritizing lower-cost options such as second hand goods. This behavioral shift is further reinforced by changing attitudes toward resale markets, where affordability is the primary motivator.
Meanwhile, approximately 72% of consumers purchase second hand items to save money, while 66% engage in thrifting as a regular shopping practice, reflecting the normalization of re-commerce in everyday consumption .
This growing acceptance of second hand products is not only driven by economic necessity but also by increased accessibility through digital resale platforms, making it easier for consumers to compare prices and find value deals across categories.
As essential living costs continue to rise, the demand for affordable alternatives will intensify. This sustained shift toward value-oriented shopping is expected to significantly accelerate the growth of the U.S. re-commerce market in the coming years.
- Market Segmentation
- Introduction
- Product Definition
- Research Process
- Assumptions
- Executive Summary
- US Recommerce Market Consumer Behavior Analysis
- Selling Motivation
- Buying Preference/ Motivation
- The Role of Sustainability in Choosing Resale/Refurbished Products
- US Recommerce Market Startup Ecosystem
- Year of Establishment
- Amount Raised (USD Million)
- Series of Fund Raise
- Purpose of Fund Raise
- Investors Involved
- US Recommerce Market Trends & Developments
- US Recommerce Market Dynamics
- Growth Drivers
- Challenges
- US Recommerce Market Policies, Regulations & Product Standards
- US Recommerce Market Hotspot & Opportunities
- US Recommerce Market Outlook, 2022-2032F
- Market Size & Analysis
- By Revenue (USD Million)
- Market Segmentation & Analysis
- By Type- (USD Million)
- Peer-to-Peer Marketplaces
- Resale Marketplaces
- Refurbished Goods Marketplaces
- By Product- (USD Million)
- Electronics
- Smartphones & Tablets
- Laptops & Computers
- Cameras and Photography Equipment
- Home Appliances (Refurbished Refrigerators, Washing Machines, etc.)
- Others (Networking Equipment, Gaming Consoles and Accessories, etc.)
- Fashion & Apparel
- Clothing
- Footwear
- Accessories (Jewelry, Watches, Handbags, etc.)
- Furniture and Home Goods
- Sofas and Couches
- Tables & Chairs
- Home Decor (Rugs, Paintings, Vases, etc.)
- Others (Garden Equipment, Bathroom Accessories, etc.)
- Automotive
- Used Vehicles
- Vehicle Parts and Accessories
- Sports and Fitness Equipment
- Others (Toys, Collectibles, Books, etc.)
- Electronics
- By Product Category- (USD Million)
- Non-Luxury
- Luxury
- By Age Group- (USD Million)
- Up to 18 Years
- 19-25 Years
- 26-40 Years
- 41-55 Years
- Above 56 Years
- By Region
- North
- South
- East
- Mid-West
- By Company
- Market Share
- Competition Characteristics
- By Type- (USD Million)
- Market Size & Analysis
- The US Electronics Recommerce Market Outlook, 2022-2032F
- Market Size & Analysis
- By Revenue (USD Million)
- Market Segmentation & Analysis
- By Type- (USD Million)
- By Product- (USD Million)
- By Product Category- (USD Million)
- By Age Group- (USD Million)
- Market Size & Analysis
- The US Fashion & Apparel Recommerce Market Outlook, 2022-2032F
- Market Size & Analysis
- By Revenue (USD Million)
- Market Segmentation & Analysis
- By Type- (USD Million)
- By Product- (USD Million)
- By Product Category- (USD Million)
- By Age Group- (USD Million)
- Market Size & Analysis
- The US Automotive Recommerce Market Outlook, 2022-2032F
- Market Size & Analysis
- By Revenue (USD Million)
- Market Segmentation & Analysis
- By Type- (USD Million)
- By Product- (USD Million)
- By Product Category- (USD Million)
- By Age Group- (USD Million)
- Market Size & Analysis
- The US Sports and Fitness Equipment Recommerce Market Outlook, 2022-2032F
- Market Size & Analysis
- By Revenue (USD Million)
- Market Segmentation & Analysis
- By Type- (USD Million)
- By Product- (USD Million)
- By Product Category- (USD Million)
- By Age Group- (USD Million)
- Market Size & Analysis
- US Recommerce Market Key Strategic Imperatives for Success & Growth
- Competitive Outlook
- Company Profiles
- The RealReal
- Business Description
- Product Portfolio
- Strategic Alliances or Partnerships
- Recent Developments
- Financial Details
- Others
- ThredUP
- Business Description
- Product Portfolio
- Strategic Alliances or Partnerships
- Recent Developments
- Financial Details
- Others
- Poshmark
- Product Portfolio
- Strategic Alliances or Partnerships
- Recent Developments
- Financial Details
- Others
- Gazelle
- Product Portfolio
- Strategic Alliances or Partnerships
- Recent Developments
- Financial Details
- Others
- Tradesy
- Product Portfolio
- Strategic Alliances or Partnerships
- Recent Developments
- Financial Details
- Others
- Decluttr
- Product Portfolio
- Strategic Alliances or Partnerships
- Recent Developments
- Financial Details
- Others
- Swap
- Product Portfolio
- Strategic Alliances or Partnerships
- Recent Developments
- Financial Details
- Others
- Glyde
- Product Portfolio
- Strategic Alliances or Partnerships
- Recent Developments
- Financial Details
- Others
- BuyBackWorld
- Product Portfolio
- Strategic Alliances or Partnerships
- Recent Developments
- Financial Details
- Others
- Threadflip
- Product Portfolio
- Strategic Alliances or Partnerships
- Recent Developments
- Financial Details
- Others
- Others
- The RealReal
- Company Profiles
- Disclaimer
MarkNtel Advisors follows a robust and iterative research methodology designed to ensure maximum accuracy and minimize deviation in market estimates and forecasts. Our approach combines both bottom-up and top-down techniques to effectively segment and quantify various aspects of the market. A consistent feature across all our research reports is data triangulation, which examines the market from three distinct perspectives to validate findings. Key components of our research process include:
1. Scope & Research Design At the outset, MarkNtel Advisors define the research objectives and formulate pertinent questions. This phase involves determining the type of research—qualitative or quantitative—and designing a methodology that outlines data collection methods, target demographics, and analytical tools. They also establish timelines and budgets to ensure the research aligns with client goals.
2. Sample Selection and Data Collection In this stage, the firm identifies the target audience and determines the appropriate sample size to ensure representativeness. They employ various sampling methods, such as random or stratified sampling, based on the research objectives. Data collection is carried out using tools like surveys, interviews, and observations, ensuring the gathered data is reliable and relevant.
3. Data Analysis and Validation Once data is collected, MarkNtel Advisors undertake a rigorous analysis process. This includes cleaning the data to remove inconsistencies, employing statistical software for quantitative analysis, and thematic analysis for qualitative data. Validation steps are taken to ensure the accuracy and reliability of the findings, minimizing biases and errors.

4. Data Forecast and FinalizationThe final phase involves forecasting future market trends based on the analyzed data. MarkNtel Advisors utilize predictive modeling and time series analysis to anticipate market behaviors. The insights are then compiled into comprehensive reports, featuring visual aids like charts and graphs, and include strategic recommendations to inform client decision-making
We offer flexible licensing options to cater to varying organizational needs. Choose the pricing pack that best suits your requirements:
Buy Now