

By Product Type (Water Treatment Chemicals (Coagulants & Flocculants, Biocides & Disinfectants, Corrosion/Scale Inhibitors, ph Adjusters, Others), Water Treatment Equipment & Systems (Filtration Units... ... ms (Filtration Units, Membrane Systems, Ion Exchange Units, Disinfection Systems, Others), Water Treatment Services (EPC/System Integration, O&M/Outsourced Water Management, Testing, Monitoring & Consulting)), By Technology (Filtration & Separation, Membrane-Based Treatment, Ion Exchange & Demineralization, Disinfection & Sterilization, Chemical Treatment, Others), By Application (Boiler Feed Water Treatment, Cooling Water Treatment, Process/Utility Water Treatment, Industrial Wastewater Treatment & Reuse), By End-User (Power Generation, Chemical & Petrochemical, Oil & Gas Refining, Iron & Steel / Metals & Mining, Pharmaceutical & Biotechnology, Food & Beverage, Pulp & Paper, Textile, Electronics & Semiconductor), and others Read more
- Environment
- Sep 2026
- 145
- PDF, Excel, PPT
U.S. Industrial Process Water Market Key Takeaways
- The United States industrial process water market was valued at USD 5.38 billion in 2025 and is projected to increase from USD 6.12 billion in 2026 to USD 8.98 billion by 2032.
- The industry is projected to witness steady growth at a 6.57% CAGR during 2026–2032.
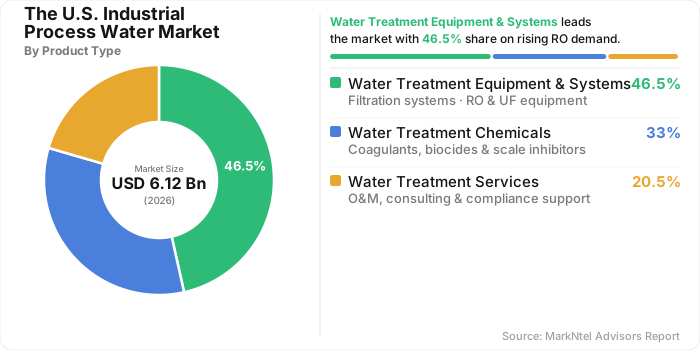
- Water treatment equipment & systems remain the dominant product segment, accounting for an estimated 46.5% share in 2026.
- Power generation leads the end-use segment, accounting for a 22.4% share in 2026.
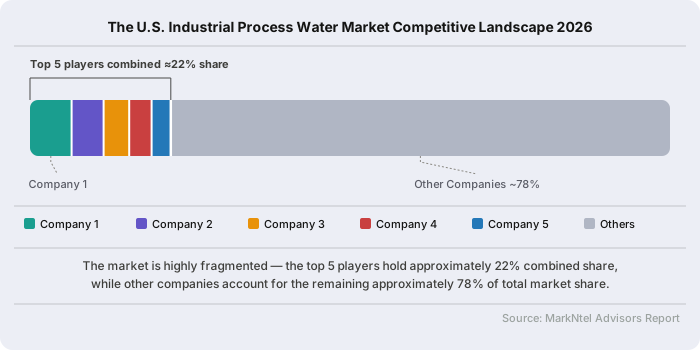
- The market is moderately fragmented, with the top five companies collectively accounting for an estimated 22% share in 2026.
U.S. Industrial Process Water Market Size and Outlook
The industrial process water market in the United States is valued at USD 5.38 billion in 2025, expands to USD 6.12 billion in 2026, and is projected to reach USD 8.98 billion by 2032, registering a 6.57% CAGR during 2026–2032.
The market's expansion is supported by the U.S. government's increasing emphasis on industrial water reuse, manufacturing water resilience, and treatment-system modernization, particularly as semiconductor manufacturing, energy production, and other water-intensive industries expand. EPA's Water Reuse Action Plan 2.0, launched in April 2026, specifically prioritizes water reuse for domestic industry, energy, semiconductor manufacturing, and other technology-intensive applications.
This structural demand is reinforced by the scale of U.S. industrial water use. According to the EPA, U.S. industrial water use exceeds direct withdrawals, while industrial and manufacturing businesses account for approximately 12% of public water-supply use. The industrial user base spans chemicals, food and beverage, paper, steel, electronics and computers, metal finishing, petroleum refining, and transportation equipment, creating a broad installed requirement for process-water treatment and reuse infrastructure.
The outlook is further strengthened by U.S. semiconductor manufacturing expansion. The U.S. Department of Commerce reports that the CHIPS Program Office is investing USD 39 billion to rebuild domestic semiconductor manufacturing capacity, while planned electronics-manufacturing investments approach USD 450 billion. This expansion supports additional demand for high-purity process water, wastewater reclamation, and water-recycling systems at advanced manufacturing facilities.
U.S. Industrial Process Water Market Key Indicators
- According to the U.S. Environmental Protection Agency (EPA), U.S. industrial water use exceeds 18.2 billion gallons per day, establishing a substantial physical water-treatment requirement across manufacturing and other process industries. The scale of withdrawals supports continued demand for process-water treatment, recycling, filtration, and water-efficiency systems across water-intensive industrial facilities.
- As per the U.S. EPA, the Bipartisan Infrastructure Law channels USD 11.7 billion through the Clean Water State Revolving Fund, while WIFIA financing reaches USD 22 billion across more than 140 projects nationwide. This federal capital support strengthens the broader U.S. water-infrastructure investment environment and supports deployment of treatment, reuse, and wastewater-management infrastructure.
- Reported by the U.S. Environmental Protection Agency, the December 2025 Deadline Extensions Rule extends several compliance deadlines associated with the 2024 Steam Electric Power Generating Effluent Limitations Guidelines. The additional implementation time allows affected coal- and gas-fired facilities to plan treatment upgrades while sustaining demand for advanced wastewater-treatment and zero-discharge technologies.
- According to ASTM International's ASTM D5127-13 guide, Type E-1.3 ultrapure water for electronics and semiconductor applications associated with 0.065–0.032 micron linewidths requires online resistivity of at least 18.2 MΩ·cm at 25°C, together with a 1 μg/L TOC limit. This benchmark supports sophisticated purification trains incorporating membrane treatment, electrodeionization, polishing, and continuous water-quality control for advanced semiconductor production.
United States Industrial Water Consumption & Treatment Demand Analysis
U.S. industrial water demand creates a broad physical requirement for process-water treatment across manufacturing and production facilities. According to the U.S. Geological Survey, industrial water withdrawals total approximately 14.8 billion gallons per day, with surface water supplying about 82% of self-supplied industrial withdrawals. This large industrial withdrawal base supports treatment requirements for process water, cooling systems, boiler operations, production cleaning, and wastewater discharge, establishing a substantial recurring demand pool for filtration, conditioning, recycling, and contaminant-removal systems.
Power generation represents a distinct high-volume treatment requirement. USGS reports that thermoelectric facilities withdraw approximately 80.4 billion gallons of water per day across the contiguous United States, including 61.4 billion gallons of freshwater and 19.0 billion gallons of saline water. The scale of cooling-water circulation creates continuous requirements for chemical conditioning, filtration, blowdown management, wastewater treatment, and corrosion and scale control. This makes generating stations particularly important consumers of high-throughput industrial water-treatment equipment and services.
Industrial demand is also geographically concentrated, creating identifiable regional treatment opportunities. USGS reports that Indiana, Louisiana, Texas, Tennessee, and Pennsylvania together account for approximately 46% of U.S. self-supplied industrial water withdrawals. These states contain significant concentrations of petroleum refining, chemicals, primary metals, manufacturing, and other water-intensive activities. Such concentration supports localized demand for industrial wastewater-treatment plants, membrane systems, water-recovery equipment, and treatment services, particularly where facilities face discharge requirements or freshwater-availability constraints.
The U.S. industrial process water industry therefore has three distinct demand engines: industrial withdrawal volume, high-throughput power-sector cooling, and increasing treatment intensity from water reuse. This structure supports demand across both large-capacity treatment systems and higher-value purification technologies, creating opportunities for equipment, chemicals, monitoring, and lifecycle-service providers.
U.S. Industrial Process Water Market Scope
| Category | Segments |
|---|---|
| By Product Type | Water Treatment Chemicals (Coagulants & Flocculants, Biocides & Disinfectants, Corrosion/Scale Inhibitors, ph Adjusters, Others), Water Treatment Equipment & Systems (Filtration Units, Membrane Systems, Ion Exchange Units, Disinfection Systems, Others), Water Treatment Services (EPC/System Integration, O&M/Outsourced Water Management, Testing, Monitoring & Consulting |
| By Technology | Filtration & Separation, Membrane-Based Treatment, Ion Exchange & Demineralization, Disinfection & Sterilization, Chemical Treatment, Others |
| By Application | Boiler Feed Water Treatment, Cooling Water Treatment, Process/Utility Water Treatment, Industrial Wastewater Treatment & Reuse |
| By End-User | Power Generation, Chemical & Petrochemical, Oil & Gas Refining, Iron & Steel / Metals & Mining, Pharmaceutical & Biotechnology, Food & Beverage, Pulp & Paper, Textile, Electronics & Semiconductor |
U.S. Industrial Process Water Market Growth Driver
Rising Industrial and Electricity Demand Accelerates Process-Water Treatment Investment
The expansion of U.S. industrial activity and electricity demand is strengthening the underlying requirement for industrial process-water infrastructure. According to the U.S. Energy Information Administration (EIA), U.S. electricity generation reaches a record 4.43 thousand TWh in 2025, increasing 2.8% from 2024, while industrial electricity retail sales rise 0.7% during the year. This expanding industrial operating base supports demand for cooling-water treatment, boiler-feedwater conditioning, filtration, wastewater management, and water-reuse systems across energy-intensive facilities.
The manufacturing base is simultaneously expanding toward more water-intensive, high-value production. The U.S. Department of Commerce reports that the CHIPS Program Office is investing USD 39 billion to rebuild domestic semiconductor manufacturing, while planned electronics-manufacturing investments approach USD 450 billion. Semiconductor fabrication requires tightly controlled process-water quality and extensive water recycling, increasing demand for high-purity water systems, membrane treatment, wastewater reclamation, and advanced process-water management infrastructure as new domestic manufacturing capacity comes online.
U.S. Industrial Process Water Market Recent Trend
AI Data Center Expansion Drives Adoption of Closed-Loop and Reclaimed Cooling Water Systems
The rapid expansion of AI-driven computing infrastructure is creating a distinct requirement for industrial-grade cooling-water management. According to the U.S. Department of Energy-supported 2024 United States Data Center Energy Usage Report, direct data-center water consumption could increase from approximately 66 billion liters in 2023 to 95–145 billion liters annually by 2028, with the broader range reaching approximately 150–280 billion liters when accounting for associated electricity-generation water consumption. This rising cooling-water requirement strengthens demand for treatment, recycling, and closed-loop cooling systems.
Treatment vendors are responding with technologies designed specifically for high-density computing environments. In May 2025, Ecolab Inc. introduced 3D TRASAR™ Technology for Direct-to-Chip Liquid Cooling, providing real-time monitoring of coolant conditions including concentration, temperature, pH, and flow. The technology supports direct-to-chip cooling architectures while improving coolant management and reducing water-related operational risks. This development strengthens demand for real-time cooling-water monitoring, corrosion and scale control, closed-loop treatment, and reclaimed-water integration as AI data centers become a growing industrial process-water application.
U.S. Industrial Process Water Market Opportunities and Challenges
Escalating PFAS Compliance Costs Are Creating an Opening for Advanced Destruction Technologies
Industrial dischargers face growing compliance uncertainty and capital-cost exposure as the EPA's PFAS regulatory program advances. According to the EPA, its Effluent Guidelines Program evaluates technology-based wastewater controls across industrial categories, with PFAS-related work covering organic chemicals, plastics and synthetic fibers, metal finishing and electroplating, landfills, and textile mills. This expanding regulatory scope increases the need for PFAS characterization, treatment evaluation, and compliance planning, while uncertainty around technology requirements and implementation timelines complicates multi-year capital budgeting for industrial wastewater-treatment upgrades
At the same time, these compliance pressures create commercial opportunities for advanced PFAS destruction technologies. As per the EPA, Method 1633A measures 40 PFAS compounds across wastewater matrices, strengthening demand for validated treatment solutions. In March 2026, 374Water disclosed that its AirSCWO supercritical water oxidation platform achieved independently validated PFAS destruction and removal efficiency exceeding 99.9% across multiple PFAS-impacted waste streams under a U.S. Department of Defense initiative. This strengthens demand for permanent PFAS destruction systems.
Segmentation Insights
Water Treatment Equipment & Systems Capture the Highest-Value Industrial Water Spending
Water treatment equipment & systems lead the U.S. industrial process water industry, representing an estimated 46.5% of 2026 revenue. The segment generates higher revenue because industrial water projects require integrated physical assets rather than recurring consumables alone. The EPA's Quincy Water Reuse Utility illustrates this capital intensity: the USD 31 million project incorporates 10 treatment systems and more than 30 miles of piping, including lime softening, ultrafiltration, high-efficiency softening, and reverse osmosis for data-center cooling.
Future equipment demand is supported by the tightening technical specifications for recycled industrial water. According to the EPA, California's industrial-reuse requirements for cooling applications can require continuous turbidity monitoring, with membrane-filtered recycled water subject to limits as low as 0.2 NTU for more than 5% of the monitoring period and 0.5 NTU as a single-sample maximum. Such requirements increase demand for filtration, membrane treatment, online monitoring, and polishing equipment, while EPA's WRAP 2.0 expands support for recycled water in industrial and data-center cooling applications. Based on product type, the industry is segmented into:
- Water Treatment Chemicals
- Water Treatment Equipment & Systems
- Water Treatment Services
Expanding Thermal and Nuclear Generation Capacity Sustains Power Generation's End-Use Leadership
Power Generation dominates the U.S. industrial process water industry, accounting for an estimated 22.4% of 2026 revenue. The segment generates the highest revenue because thermal and nuclear facilities require multiple treatment systems across cooling-water, boiler-feedwater, condensate, and wastewater streams. The EPA's 2024 Steam Electric Effluent Guidelines Final Rule strengthens discharge requirements for flue-gas-desulfurization wastewater, bottom-ash transport water, and combustion-residual leachate, reinforcing plant-level investment in advanced treatment infrastructure.
Future demand is sustained by the continued importance of nuclear generation within the U.S. electricity system. According to the U.S. Energy Information Administration, nuclear power accounts for about 18% of U.S. utility-scale electricity generation in 2025, maintaining a large installed base of continuously operating facilities that require high-reliability water-treatment infrastructure. Long operating lifetimes, wastewater compliance requirements, and ongoing plant modernization support recurring demand for cooling-water treatment, condensate polishing, wastewater treatment, and water-reuse systems, while rising electricity requirements increase the strategic value of reliable generation assets. Based on end-user, the industry is segmented into:
- Power Generation
- Chemical & Petrochemical
- Oil & Gas Refining
- Iron & Steel / Metals & Mining
- Pharmaceutical & Biotechnology
- Food & Beverage
- Pulp & Paper
- Textile
- Electronics & Semiconductor
- Others
U.S. Industrial Process Water Market Competitive Analysis
The U.S. industrial process water market is moderately fragmented, with the top five companies estimated to account for 22% of 2026 market revenue. The leading companies are Veolia Environnement SA, Xylem Inc., Ecolab Inc., DuPont de Nemours, Inc., and Pentair plc. Official corporate and regulatory records confirm the registered identities of Veolia, Xylem, Ecolab, and DuPont.
Top Companies in the U.S. Industrial Process Water Market
- Veolia Environnement S.A.
- Xylem Inc.
- Ecolab Inc.
- SUEZ S.A.
- DuPont de Nemours, Inc.
- Pentair plc
- Kurita Water Industries Ltd.
- Solenis LLC
- Aquatech International LLC
- Ovivo Inc.
US Industrial Process Water Industry News and Recent Developments
April 2026: Veolia and AWS Partner to Develop Reclaimed Water Solutions for Data Center Cooling
Veolia announced a partnership with Amazon Web Services to develop reclaimed-water solutions for data center cooling, combining its water treatment technology portfolio with AI-enabled optimization tools. The collaboration targets closed-loop cooling and wastewater recovery specifically for hyperscale data center campuses.
Impact Analysis: The partnership positions Veolia to capture a growing share of data-center water spend as hyperscalers face intensifying scrutiny over freshwater withdrawal, and signals that reclaimed and recycled water is becoming a preferred cooling-water source for new hyperscale builds rather than a niche sustainability add-on, a shift that is expected to lift demand for advanced tertiary treatment and closed-loop recycling equipment across the data center end-use category.
April 2025: Stantec Selected to Design the Largest PFAS Treatment System in the Northwestern US
Stantec was selected by the City of Vancouver, Washington, to design a PFAS removal system for a high-volume municipal water station, with engineering support continuing through construction. Once complete, the treatment system will process up to 12.2 million gallons per day, making it the largest PFAS treatment project in the Northwestern US by treatment capacity.
Impact Analysis: The project illustrates how PFAS compliance is translating into large, dated capital commitments for advanced filtration and ion-exchange treatment capacity, and is expected to be referenced as a design benchmark for subsequent large-scale PFAS treatment projects serving industrial and municipal water users across the Pacific Northwest.
- Market Segmentation
- Introduction
- Product Definition
- Research Process
- Assumptions
- Executive Summary
- US Industrial Process Water Market Policies, Regulations, and Product Standards
- US Industrial Process Water Market Trends & Developments
- US Industrial Process Water Market Dynamics
- Growth Factors
- Challenges
- US Industrial Process Water Market Hotspot & Opportunitiesz
- US Industrial Process Water Market Outlook, 2022-2032F
- Market Size & Outlook
- By Revenues (USD Million)
- Market Share & Analysis
- By Product Type - Market Size & Forecast 2022-2032, USD Million
- Water Treatment Chemicals
- Coagulants & Flocculants
- Biocides & Disinfectants
- Corrosion/Scale Inhibitors
- ph Adjusters
- Others
- Water Treatment Equipment & Systems
- Filtration Units
- Membrane Systems
- Ion Exchange Units
- Disinfection Systems
- Others
- Water Treatment Services
- EPC/System Integration
- O&M/Outsourced Water Management
- Testing
- Monitoring & Consulting
- Water Treatment Chemicals
- By Technology- Market Size & Forecast 2022-2032, USD Million
- Filtration & Separation
- Membrane-Based Treatment
- Ion Exchange & Demineralization
- Disinfection & Sterilization
- Chemical Treatment
- Others
- By Application- Market Size & Forecast 2022-2032, USD Million
- Boiler Feed Water Treatment
- Cooling Water Treatment
- Process/Utility Water Treatment
- Industrial Wastewater Treatment & Reuse
- By End-User- Market Size & Forecast 2022-2032, USD Million
- Power Generation
- Chemical & Petrochemical
- Oil & Gas Refining
- Iron & Steel / Metals & Mining
- Pharmaceutical & Biotechnology
- Food & Beverage
- Pulp & Paper
- Textile
- Electronics & Semiconductor
- Others
- By Region
- North
- East
- South
- West
- By Company
- Competition Characteristics
- Market Share & Analysis
- By Product Type - Market Size & Forecast 2022-2032, USD Million
- Market Size & Outlook
- US Water Treatment Chemicals Market Outlook, 2022-2032
- Market Size & Outlook
- By Revenues (USD Million)
- Market Segmentation & Analysis
- By Technology- Market Size & Forecast 2022-2032, USD Million
- By Application- Market Size & Forecast 2022-2032, USD Million
- By End-User- Market Size & Forecast 2022-2032, USD Million
- Market Size & Outlook
- US Water Treatment Equipment & Systems Market Outlook, 2022-2032
- Market Size & Outlook
- By Revenues (USD Million)
- Market Segmentation & Analysis
- By Technology- Market Size & Forecast 2022-2032, USD Million
- By Application- Market Size & Forecast 2022-2032, USD Million
- By End-User- Market Size & Forecast 2022-2032, USD Million
- Market Size & Outlook
- US Water Treatment Services Market Outlook, 2022-2032
- Market Size & Outlook
- By Revenues (USD Million)
- Market Segmentation & Analysis
- By Technology- Market Size & Forecast 2022-2032, USD Million
- By Application- Market Size & Forecast 2022-2032, USD Million
- By End-User- Market Size & Forecast 2022-2032, USD Million
- Market Size & Outlook
- US Industrial Process Water Market Key Strategic Imperatives for Success & Growth
- Competitive Outlook
- Company Profiles
- Veolia Water Technologies (Shanghai) Co., Ltd.
- Business Description
- Product Portfolio
- Collaborations & Alliances
- Recent Developments
- Financial Details
- Others
- SUEZ Engineering (China) Co., Ltd.
- Business Description
- Product Portfolio
- Collaborations & Alliances
- Recent Developments
- Financial Details
- Others
- Ecolab Inc.
- Business Description
- Product Portfolio
- Collaborations & Alliances
- Recent Developments
- Financial Details
- Others
- Kurita Water Industries Ltd.
- Business Description
- Product Portfolio
- Collaborations & Alliances
- Recent Developments
- Financial Details
- Others
- Xylem Inc.
- Business Description
- Product Portfolio
- Collaborations & Alliances
- Recent Developments
- Financial Details
- Others
- Beijing OriginWater Technology Co., Ltd.
- Business Description
- Product Portfolio
- Collaborations & Alliances
- Recent Developments
- Financial Details
- Others
- Jiangsu Jiuwu Hi-Tech Co., Ltd.
- Business Description
- Product Portfolio
- Collaborations & Alliances
- Recent Developments
- Financial Details
- Others
- SafBon Water Service (Holding) Inc., Shanghai
- Business Description
- Product Portfolio
- Collaborations & Alliances
- Recent Developments
- Financial Details
- Others
- US Everbright Water Limited
- Business Description
- Product Portfolio
- Collaborations & Alliances
- Recent Developments
- Financial Details
- Others
- Beijing Enterprises Water Group Limited
- Business Description
- Product Portfolio
- Collaborations & Alliances
- Recent Developments
- Financial Details
- Others
- Veolia Water Technologies (Shanghai) Co., Ltd.
- Company Profiles
- Disclaimer

MarkNtel Advisors follows a robust and iterative research methodology designed to ensure maximum accuracy and minimize deviation in market estimates and forecasts. Our approach combines both bottom-up and top-down techniques to effectively segment and quantify various aspects of the market. A consistent feature across all our research reports is data triangulation, which examines the market from three distinct perspectives to validate findings. Key components of our research process include:
1. Scope & Research Design At the outset, MarkNtel Advisors define the research objectives and formulate pertinent questions. This phase involves determining the type of research—qualitative or quantitative—and designing a methodology that outlines data collection methods, target demographics, and analytical tools. They also establish timelines and budgets to ensure the research aligns with client goals.
2. Sample Selection and Data Collection In this stage, the firm identifies the target audience and determines the appropriate sample size to ensure representativeness. They employ various sampling methods, such as random or stratified sampling, based on the research objectives. Data collection is carried out using tools like surveys, interviews, and observations, ensuring the gathered data is reliable and relevant.
3. Data Analysis and Validation Once data is collected, MarkNtel Advisors undertake a rigorous analysis process. This includes cleaning the data to remove inconsistencies, employing statistical software for quantitative analysis, and thematic analysis for qualitative data. Validation steps are taken to ensure the accuracy and reliability of the findings, minimizing biases and errors.

4. Data Forecast and FinalizationThe final phase involves forecasting future market trends based on the analyzed data. MarkNtel Advisors utilize predictive modeling and time series analysis to anticipate market behaviors. The insights are then compiled into comprehensive reports, featuring visual aids like charts and graphs, and include strategic recommendations to inform client decision-making
We offer flexible licensing options to cater to varying organizational needs. Choose the pricing pack that best suits your requirements:
Buy Now Inquire Before Buying
 Request Customization