

By Engine Type (Internal Combustion Engine (ICE), Electric Engine, Alternative Fuel Engine), By Fuel Type (Gasoline, Diesel, Hybrid, Alternative Fuels), By Vehicle Type (Passenger Cars, Light Commerci... ... Cars, Light Commercial Vehicles (LCVs), Heavy Commercial Vehicles (HCVs)), By Engine Capacity (Below 1.0L, 1.0L–2.0L, 2.0L–3.0L, Above 3.0L), By Engine Configuration (In-line Engine, V-type Engine, Opposed Engine), By Sales Channel (OEM, Aftermarket),and others Read more
- Buildings, Construction, Metals & Mining
- May 2026
- 175
- PDF, Excel, PPT
United States Leak Detection and Repair Market Report Key Takeaways
- The US leak detection and repair market is projected to grow from USD 1.26 billion in 2025 to USD 1.78 billion in 2026.
- By 2032, the market is expected to reach USD 4.18 billion, expanding at a robust CAGR of 15.29%, supported by continuous monitoring and automation integration.
- Optical Gas Imaging (OGI) remains the leading technology segment with approximately 35% share, reinforcing its role as the primary compliance-driven inspection tool.
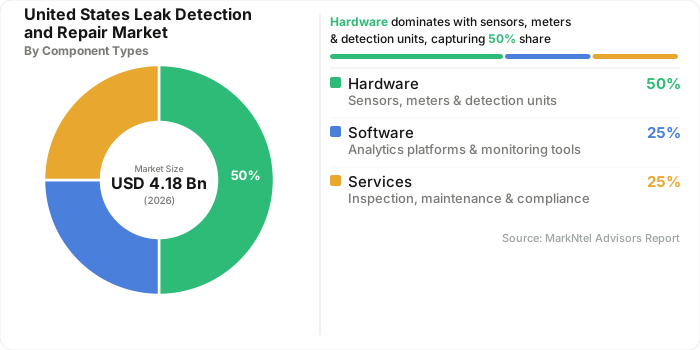
- Within component type, hardware solutions dominate with nearly 50% share, reflecting strong demand for sensors, cameras, and field deployment systems.
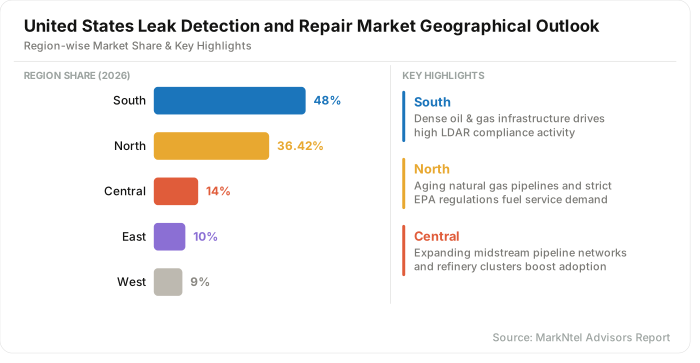
- The Southern United States leads regionally with 48% share, driven by dense oil and gas infrastructure and high LDAR enforcement intensity.
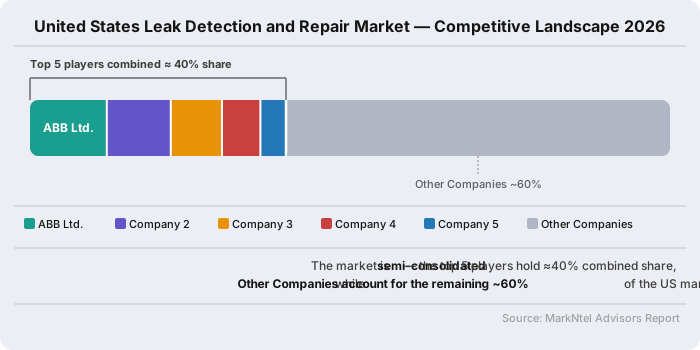
- The market is semi-consolidated, where the top five companies account for around 40% share, highlighting a balanced mix of global leaders and specialized technology providers.
United States Leak Detection and Repair Market Size and Outlook
The US leak detection and repair market size was valued at around USD 1.26 billion in 2025, projected to grow from USD 1.78 billion in 2026 to USD 4.18 billion by 2032, growing at a CAGR of 15.29% with a forecast period from 2026 to 2032.
The LDAR market in the United States has developed through long-term industrial expansion across hydrocarbon processing, interstate pipeline networks, and chemical manufacturing corridors. Early environmental governance under the Clean Air Act established mandatory leak monitoring obligations for industrial emitters, shaping baseline compliance behavior across facilities. Over time, rising throughput in refining hubs and increased complexity in transmission infrastructure strengthened the need for advanced monitoring systems. This transition marked a structural shift from periodic inspection models toward continuous emissions visibility across high-risk assets.
Regulatory reinforcement in recent years has further accelerated adoption of advanced detection systems. The US Environmental Protection Agency introduced updated methane monitoring standards for oil and gas facilities under its 2025 compliance framework, expanding measurement frequency and reporting obligations. In parallel, the Pipeline and Hazardous Materials Safety Administration strengthened integrity management expectations for transmission operators, requiring enhanced risk-based inspection planning. These regulatory measures are documented under federal pipeline safety and emissions control programs, directly increasing demand for automated leak detection technologies.
End-user segmentation plays a critical role in shaping demand distribution across the US Industrial oil and gas operators represent the largest adoption base due to high emission intensity across upstream drilling sites and downstream refining units, particularly in compliance-heavy corridors. Municipal water and wastewater utilities are increasingly integrating leak monitoring systems to improve distribution efficiency and reduce infrastructure losses, supported by federal water infrastructure modernization programs. Commercial and institutional facilities are also adopting refrigerant monitoring systems aligned with federal greenhouse gas reduction initiatives targeting HVAC emissions.
From a technology and industry perspective, market expansion is being reinforced by federal innovation support and private-sector digital transformation. The US Department of Energy has funded advanced methane detection research programs focusing on satellite sensing, drone-based monitoring, and low-cost sensor networks to improve detection accuracy across distributed assets. Major industrial automation companies are integrating AI-enabled analytics into emission monitoring platforms to improve predictive maintenance and reduce inspection cycles.
These developments indicate a long-term transition toward digitally integrated LDAR ecosystems supported by regulatory compliance and infrastructure modernization priorities, driving the market from USD 1.78 billion in 2026 to USD 4.18 billion by 2032.
United States Leak Detection and Repair Market Key Indicators
- The Pipeline and Hazardous Materials Safety Administration (PHMSA) oversees approximately 3.3 million miles of onshore pipeline infrastructure in the United States including 300,930 miles of gas transmission pipelines, 2.3 million miles of gas distribution mains and services, and 350,200 miles of gas gathering pipelines (FY 2025 Budget Estimates). The scale and age composition of this network generates sustained mandatory inspection and repair obligations, directly expanding the addressable base for LDAR technology and service providers across transmission, distribution, and gathering segments .
- According to the U.S. Energy Information Administration (EIA), the United States had 918,481 producing oil and natural gas wells in 2024, with crude oil production averaging 13.4 million barrels per day and natural gas gross withdrawals averaging 128.8 billion cubic feet per day in December 2024 . Each producing well represents a regulated fugitive emissions source requiring scheduled LDAR inspection under EPA NSPS OOOOb, translating record-level US hydrocarbon output directly into proportional demand for leak survey services and monitoring equipment.
United States Leak Detection and Repair Market Scope
| Category | Segments |
|---|---|
| By Engine Type | Internal Combustion Engine (ICE), Electric Engine, Alternative Fuel Engine |
| By Fuel Type | Gasoline, Diesel, Hybrid, Alternative Fuels |
| By Vehicle Type | Passenger Cars, Light Commercial Vehicles (LCVs), Heavy Commercial Vehicles (HCVs |
| By Engine Capacity | Below 1.0L, 1.0L–2.0L, 2.0L–3.0L, Above 3.0L |
| By Engine Configuration | In-line Engine, V-type Engine, Opposed Engine |
| By Sales Channel | OEM, Aftermarket |
United States Leak Detection and Repair Market Growth Drivers
Aging Pipeline Infrastructure Requiring Integrity-Driven Leak Monitoring
A major structural driver of the US LDAR market is the extensive aging oil and gas pipeline infrastructure, which is increasingly prone to corrosion, stress fatigue, and operational leakage risks. According to the US Energy Information Administration, a significant portion of interstate natural gas pipelines in the United States were constructed before modern monitoring technologies became standard, creating long-term integrity challenges. This has directly increased the need for continuous leak detection systems integrated into pipeline safety management frameworks.
The US Pipeline and Hazardous Materials Safety Administration has reinforced this pressure by mandating integrity management programs that require operators to identify, assess, and repair leaks using risk-based inspection methodologies. For instance, PHMSA investigated a jet fuel leak on the Twin Oaks Pipeline that led to federal corrective actions and system-wide inspection requirements. It mandates advanced leak detection systems across US pipelines and covers 2.8 million miles of pipeline infrastructure. These rules are particularly impactful in high-density pipeline corridors such as the Gulf Coast and Midwest transmission networks, where operators must deploy advanced monitoring tools including sensors, pressure analytics, and automated alert systems.
This infrastructure-driven compliance need has transformed LDAR adoption into a capital-intensive necessity rather than a discretionary safety measure. Pipeline operators and utility companies are increasingly investing in continuous monitoring systems to reduce unplanned outages, environmental penalties, and repair costs associated with undetected leaks. As asset aging accelerates, replacement cycles and retrofitting programs are expanding across transmission and distribution networks. This ensures sustained demand growth for LDAR technologies, particularly in pipeline-heavy industrial regions of the United States.
Recent Trends
Always-On Methane Monitoring Using AI-Driven Edge Sensors And Acoustic Detection Systems
The most significant structural shift in the US LDAR market is the move from periodic inspections to always-on monitoring using distributed sensors, AI analytics, and acoustic detection systems. This transition has accelerated due to EPA methane regulations under OOOOb/OOOOc, which prioritize rapid detection and quantification of fugitive emissions. Field deployments in major basins such as the Permian demonstrate continuous monitoring networks replacing quarterly optical gas imaging surveys. Programs like Project Astra show how multi-operator sensor grids enable near real-time emissions visibility at scale.
This shift is fundamentally changing operational architecture across the value chain, especially upstream oil and gas assets. Companies like Qube Technologies deploy fixed sensor networks with AI analytics that convert raw concentration data into actionable leak alerts.
AI-enabled drones and continuous OGI systems now complement ground sensors, reducing dependence on manual field crews and scheduled audits. As a result, industrial leak detection is evolving into a real-time emissions intelligence function embedded directly into production operations.
United States Leak Detection and Repair Market Opportunities and Challenges
Structural Challenge And Emerging Opportunity In Modernization Shift
The US LDAR market faces a core structural challenge of inefficiency in traditional manual inspection systems that depend on periodic surveys rather than continuous detection.
These legacy approaches often fail to capture transient or intermittent leaks, leading to resource losses in water systems, hydrocarbon facilities, and chemical processing plants. At the same time, operators face rising compliance pressure and environmental penalties, but hesitate to adopt advanced monitoring due to operational disruption and cost burden.
This challenge is directly driving the shift toward performance-based and “as-a-service” LDAR models that eliminate heavy upfront investment requirements. Instead of owning infrastructure, operators increasingly rely on IoT-enabled sensors, AI-driven analytics, and remote monitoring platforms that continuously detect and quantify leaks. For instance, Bridger Photonics provides airborne LiDAR-based methane detection services that map emissions across entire facilities and pipelines. This expands LDAR coverage beyond ground inspections and enables high-frequency “survey-as-a-service” models. Operators use these datasets to prioritize repairs and reduce large-scale methane losses.
As this model scales, LDAR is evolving into a subscription-driven ecosystem where vendors are responsible for continuous monitoring and verified performance outcomes. Operators benefit by reducing capital expenditure while improving regulatory compliance and minimizing product or resource losses over time. This is particularly impactful for small and mid-sized operators that previously lacked access to high-cost monitoring technologies. Ultimately, the shift transforms LDAR from a compliance cost center into a value recovery and efficiency optimization system.
Segmentation Analysis
Leadership of Optical Gas Imaging (OGI) Technology Segment
One of the major factors driving the dominance of OGI technology with a market share of 35% is the increasing stringency of environmental regulations by agencies such as the U.S. Environmental Protection Agency (EPA). Oil & gas operators, chemical plants, and refineries are required to monitor methane and VOC emissions regularly, and OGI systems provide a faster and more efficient inspection method compared to conventional leak detection technologies such as soap bubble tests or handheld detectors.
In addition, OGI technology enables non-contact and remote monitoring, allowing inspectors to detect leaks in hazardous or hard-to-reach areas without shutting down operations. This improves worker safety and reduces maintenance downtime.
A major example is FLIR Systems (now part of Teledyne Technologies), which provides advanced OGI cameras widely used across the U.S. oil & gas secto r. These cameras help operators comply with EPA methane regulations while minimizing product loss and environmental impact. Additionally, many pipeline operators are integrating drone-mounted OGI systems for large-scale infrastructure inspection, particularly in shale production regions such as the Permian Basin.
The strong adoption of OGI technology is significantly influencing the overall LDAR market growth in the U.S. The technology helps industries reduce fugitive emissions, avoid regulatory penalties, and improve operational efficiency. As methane reduction becomes a national climate priority, demand for advanced OGI systems is expected to increase further. By technology the market is further segmented into following sub-categories:
- Optical Gas Imaging (OGI)
- Acoustic Detection
- Laser-Based Detection
- IoT-Based Monitoring
- AI & Predictive Analytics
- Drone-Based Inspection
- Others
Leadership of Hardware-Based Leak Detection Systems
The hardware segment dominates the leak detection and repair systems with a market share of 50% due to its direct role in physical leak detection, measurement, and field-level emission identification. Regulatory frameworks such as U.S. EPA LDAR requirements mandate on-site monitoring, which depends heavily on detectors, sensors, and imaging devices. Equipment like infrared cameras, gas detectors, and fixed monitoring units form the operational backbone of compliance-driven inspection systems. This structural dependency ensures hardware remains the first-line deployment layer across industrial LDAR programs.
Demand is further reinforced by large-scale asset-heavy industries such as oil refineries, petrochemical plants, and gas transmission networks. Additionally, Companies including Honeywell and Emerson Electric continuously upgrade hardware systems with advanced sensing accuracy and rugged field performance. UAV-based detectors and handheld devices are increasingly deployed in complex terrains like shale basins and offshore platforms. This improves detection coverage while reducing manual inspection exposure in hazardous zones.
Capital investment flows strongly favor hardware due to its long replacement cycles and critical compliance role in LDAR frameworks. Integration with infrared imaging, laser sensing, and IoT-enabled monitoring devices strengthens real-time leak detection capability. Software and analytics layers depend on hardware-generated data, reinforcing its foundational market position. This interdependence ensures hardware remains the dominant revenue-generating and deployment-intensive segment in the LDAR ecosystem. By Component types the market is further segmented into following sub-categories:
- Hardware
- Handheld Detectors
- Fixed Detectors
- UAV-Based Detecto
- Gas Detectors
- Sensors
- Infrared Cameras
- Laser-Based Detection Systems
- Monitoring Devices
- Software
- Emission Monitoring Software
- Data Analytics Platforms
- Compliance Management Software
- Services
- Inspection Services
- Repair & Maintenance Services
- Consulting & Compliance Services
- Training Services
United States Leak Detection and Repair Market Geographical Analysis
The Southern United States leads the leak detection and repair demand due to dense oil, gas, and petrochemical infrastructure concentrated across the Gulf Coast and Permian Basin. Texas and Louisiana together form the largest refining and midstream processing corridor in the country, requiring continuous emissions monitoring. High shale production intensity drives frequent inspection cycles across upstream wells, gathering systems, and processing facilities.
This industrial concentration creates sustained, large-scale demand for LDAR technologies and services.
Regulatory frameworks strongly reinforce this dominance through strict enforcement of EPA LDAR requirements and state-level compliance mechanisms. The Texas Railroad Commission and Louisiana environmental authorities align operational standards with federal emission monitoring mandates. These policies ensure consistent inspection frequency across high-emission industrial assets, reducing regulatory flexibility for operators. As a result, compliance-driven investment in monitoring infrastructure remains structurally embedded in the region.
Demand is further amplified by the concentration of major energy and chemical operators across the Gulf Coast industrial belt. Refineries, LNG export terminals, and petrochemical plants operate continuous monitoring programs due to high throughput and safety risk exposure. Sustained capital inflows into shale expansion and petrochemical capacity upgrades reinforce the adoption of advanced LDAR systems. The region serves as a primary testing ground for OGI, drone-based inspection, and IoT-enabled monitoring integration. High-risk operational environments accelerate the adoption of predictive leak detection and automated compliance systems. These combined structural, regulatory, and industrial factors secure long-term regional leadership in the U.S. industrial leak detection systems.
United States Leak Detection and Repair Industry Competitive Landscape
The US LDAR market is characterized by a semi-consolidated competitive structure, where a handful of multinational industrial leaders dominate high-value instrumentation and automation solutions, while a large number of specialized and regional service providers operate in inspection, compliance, and field monitoring services. The leading tier consists of global industrial automation and sensing companies such as Honeywell International Inc., Siemens AG, Emerson Electric Co., ABB Ltd., and Teledyne FLIR LLC, these firms collectively account for the largest share of 40%.
Major Companies in US Leak Detection and Repair Industry
- ABB Ltd.
- Atmos International
- Baker Hughes, a GE Company
- Clampon AS
- Emerson Electric Co.
- FLIR Systems Inc.
- Honeywell International Inc.
- John Wood Group PLC
- Krohne Group
- PSI AG
- Pergam Technical Services Inc.
- Sensit Technologies LLC
- Siemens AG
- Synodon Inc.
- Schneider Electric SE
- Thermo Fisher Scientific Inc.
- TUV SUD AG
- Viper Innovations Ltd.
- Yokogawa Electric Corp.
- Zeus Intelligence
United States Leak Detection and Repair Industry News and Recent Developments
2025: MSA Safety Acquires M&C TechGroup for USD 200 Million to Expand Gas Analysis and Process Safety Detection Capabilities
MSA Safety Incorporated (NYSE: MSA) completed the acquisition of M&C TechGroup on May 7, 2025, in a transaction valued at approximately USD 200 million. M&C TechGroup, headquartered in Ratingen, Germany, generated annual revenue of approximately USD 55 million at the time of acquisition and employed approximately 220 associates across global operations. The company's portfolio spans gas sampling systems, gas conditioning equipment, and advanced process control solutions deployed across energy, chemicals, utilities, manufacturing, and food and beverage sectors. MSA Safety, which reported 2024 revenues of USD 1.8 billion and operates across more than 40 international locations with over 5,000 employees, framed the acquisition as central to its Accelerate strategy — a program targeting systematic growth of its detection business through technology portfolio expansion and strategic acquisitions.
Impact Analysis: The acquisition broadens MSA Safety's addressable market in industrial gas detection, integrating M&C's gas sampling and conditioning technologies into MSA's established global distribution network. For the US leak detection and repair market, the combination of process control analytics and detection hardware under a single provider reflects consolidation toward turnkey monitoring solutions — a competitive model that displaces point-product suppliers, raises the technical threshold for competitors without equivalent portfolio depth, and positions MSA Safety to serve compliance-driven demand across oil and gas, chemical, and utility end markets through a unified offering.
2025: SLB Methane LiDAR Camera Receives U.S. EPA Approval as Alternative Test Method Under OOOO Regulations, Enabling Standalone Autonomous LDAR Compliance
SLB (NYSE: SLB) announced on September 3, 2025 that its Methane LiDAR Camera had received U.S. EPA approval as an Alternative Test Method (ATM) for methane detection under the OOOO family of regulations — the first autonomous LiDAR system approved at all leak resolution thresholds under the regulation. The system operates in daytime, nighttime, and multi-gas conditions without requiring the temperature differential between a leaking gas and its environment that limits OGI camera performance. Built-in laser imaging technology visualizes and quantifies emission rates, duration, location, persistence, and timing, with measurements accessible remotely via SLB's digital platform. At the date of approval, SLB had deployed over 100 Methane LiDAR Cameras across four continents, with US oil and gas operators representing a primary compliance-driven adoption segment under the OOOOb monitoring requirements effective since May 2024.
Impact Analysis: EPA ATM approval converts SLB's Methane LiDAR Camera from a supplementary monitoring tool into a standalone LDAR compliance instrument, enabling US oil and gas operators to replace labor-intensive periodic OGI survey programs across well sites, compressor stations, and midstream processing facilities. The approval marks the first meaningful structural challenge to the OGI-based LDAR model that has defined US compliance workflows since NSPS OOOOa in 2015, reducing per-inspection labor costs
- Market Segmentation
- Introduction
- Product Definition
- Research Process
- Assumptions
- Executive Summary
- US Leak Detection and Repair Market Policies, Regulations, and Product Standards
- US Leak Detection and Repair Market Trends & Developments
- US Leak Detection and Repair Market Dynamics
- Growth Factors
- Challenges
- US Leak Detection and Repair Market Hotspot & Opportunities
- US Leak Detection and Repair Market Outlook, 2022-2032F
- Market Size & Outlook
- By Revenues (USD Million)
- Market Share & Outlook
- By Component Type- Market Size & Forecast 2022-2032, USD Million
- Hardware
- Handheld Detectors
- Fixed Detectors
- UAV-Based Detecto
- Gas Detectors
- Sensors
- Infrared Cameras
- Laser-Based Detection Systems
- Monitoring Devices
- Software
- Emission Monitoring Software
- Data Analytics Platforms
- Compliance Management Software
- Services
- Inspection Services
- Repair & Maintenance Services
- Consulting & Compliance Services
- Training Services
- Hardware
- By Technology- Market Size & Forecast 2022-2032, USD Million
- Optical Gas Imaging (OGI)
- Acoustic Detection
- Laser-Based Detection
- IoT-Based Monitoring
- AI & Predictive Analytics
- Drone-Based Inspection
- Others
- By Deployment Type- Market Size & Forecast 2022-2032, USD Million
- Portable Systems
- Fixed/Continuous Monitoring Systems
- Remote Monitoring Systems
- By Equipment Type- Market Size & Forecast 2022-2032, USD Million
- Pipelines
- Valves
- Pumps
- Compressors
- Storage Tanks
- Flanges & Connectors
- Pressure Relief Devices
- By Leak Type- Market Size & Forecast 2022-2032, USD Million
- Gas Leaks
- Liquid Leaks
- Steam Leaks
- Vacuum Leaks
- By End Users- Market Size & Forecast 2022-2032, USD Million
- Oil & Gas Industry
- Chemical Plants
- Water Treatment Plants
- Power Plants
- Mining & Slurry
- Commercial
- Residential
- Others
- By region- Market Size & Forecast 2022-2032, USD Million
- North
- South
- East
- West
- Central
- By Company
- Competition Characteristics
- Market Share & Analysis
- By Component Type- Market Size & Forecast 2022-2032, USD Million
- Market Size & Outlook
- US Portable Systems Market Outlook, 2022-2032
- Market Size & Outlook
- By Revenues (USD Million)
- Market Share & Outlook
- By Technology- Market Size & Forecast 2022-2032, USD Million
- By Deployment Type- Market Size & Forecast 2022-2032, USD Million
- By Equipment Type- Market Size & Forecast 2022-2032, USD Million
- By Leak Type- Market Size & Forecast 2022-2032, USD Million
- By End Users- Market Size & Forecast 2022-2032, USD Million
- By region- Market Size & Forecast 2022-2032, USD Million
- Market Size & Outlook
- US Fixed/Continuous Monitoring Systems Market Outlook, 2022-2032
- Market Size & Outlook
- By Revenues (USD Million)
- Market Share & Outlook
- By Technology- Market Size & Forecast 2022-2032, USD Million
- By Deployment Type- Market Size & Forecast 2022-2032, USD Million
- By Equipment Type- Market Size & Forecast 2022-2032, USD Million
- By Leak Type- Market Size & Forecast 2022-2032, USD Million
- By End Users- Market Size & Forecast 2022-2032, USD Million
- By region- Market Size & Forecast 2022-2032, USD Million
- Market Size & Outlook
- US Leak Detection and Repair Market Key Strategic Imperatives for Success & Growth
- Competitive Outlook
- Company Profiles
- Remote Monitoring Systems
- Business Description
- Product Portfolio
- Collaborations & Alliances
- Recent Developments
- Financial Details
- Others
- ABB Ltd.
- Business Description
- Product Portfolio
- Collaborations & Alliances
- Recent Developments
- Financial Details
- Others
- Atmos International
- Business Description
- Product Portfolio
- Collaborations & Alliances
- Recent Developments
- Financial Details
- Others
- Baker Hughes, a GE Company
- Business Description
- Product Portfolio
- Collaborations & Alliances
- Recent Developments
- Financial Details
- Others
- Clampon AS
- Business Description
- Product Portfolio
- Collaborations & Alliances
- Recent Developments
- Financial Details
- Others
- Emerson Electric Co.
- Business Description
- Product Portfolio
- Collaborations & Alliances
- Recent Developments
- Financial Details
- Others
- FLIR Systems Inc.
- Business Description
- Product Portfolio
- Collaborations & Alliances
- Recent Developments
- Financial Details
- Others
- Honeywell International Inc.
- Business Description
- Product Portfolio
- Collaborations & Alliances
- Recent Developments
- Financial Details
- Others
- John Wood Group PLC
- Business Description
- Product Portfolio
- Collaborations & Alliances
- Recent Developments
- Financial Details
- Others
- Krohne Group
- Business Description
- Product Portfolio
- Collaborations & Alliances
- Recent Developments
- Financial Details
- Others
- Remote Monitoring Systems
- Company Profiles
- Disclaimer

MarkNtel Advisors follows a robust and iterative research methodology designed to ensure maximum accuracy and minimize deviation in market estimates and forecasts. Our approach combines both bottom-up and top-down techniques to effectively segment and quantify various aspects of the market. A consistent feature across all our research reports is data triangulation, which examines the market from three distinct perspectives to validate findings. Key components of our research process include:
1. Scope & Research Design At the outset, MarkNtel Advisors define the research objectives and formulate pertinent questions. This phase involves determining the type of research—qualitative or quantitative—and designing a methodology that outlines data collection methods, target demographics, and analytical tools. They also establish timelines and budgets to ensure the research aligns with client goals.
2. Sample Selection and Data Collection In this stage, the firm identifies the target audience and determines the appropriate sample size to ensure representativeness. They employ various sampling methods, such as random or stratified sampling, based on the research objectives. Data collection is carried out using tools like surveys, interviews, and observations, ensuring the gathered data is reliable and relevant.
3. Data Analysis and Validation Once data is collected, MarkNtel Advisors undertake a rigorous analysis process. This includes cleaning the data to remove inconsistencies, employing statistical software for quantitative analysis, and thematic analysis for qualitative data. Validation steps are taken to ensure the accuracy and reliability of the findings, minimizing biases and errors.

4. Data Forecast and FinalizationThe final phase involves forecasting future market trends based on the analyzed data. MarkNtel Advisors utilize predictive modeling and time series analysis to anticipate market behaviors. The insights are then compiled into comprehensive reports, featuring visual aids like charts and graphs, and include strategic recommendations to inform client decision-making
We offer flexible licensing options to cater to varying organizational needs. Choose the pricing pack that best suits your requirements:
Buy Now Inquire Before Buying
 Request Customization