
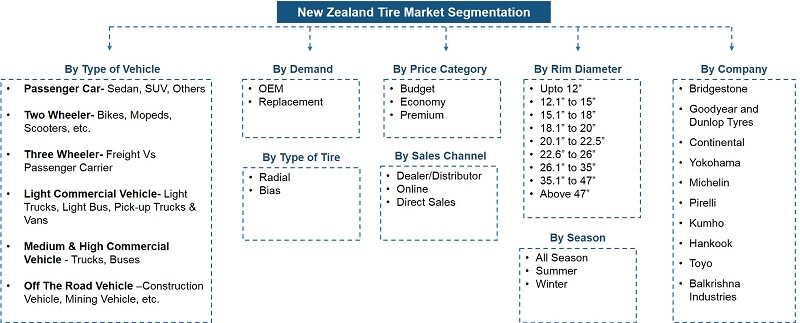
By Type of Vehicles (Passenger Car, Light Commercial Vehicle, Medium and Heavy Commercial Vehicles, Off the Road (OTR), Two Wheelers, Three Wheeler), By Demand Category (OEM and Re......placement), By Type of Tires (Radial and Bias), By Sales Channel (Dealer/Exclusive Outlets, Online and Others), By Season (all season, winter and Summer), By Price Category (Low (Up to USD90), Medium (USD91-USD140, High (Above USD140)), By Rim Diameter (Upto 12”, 12.1” to 15”, 15.1.” to 18”, 18.1” to 20”, 20.1” to 22.5”, 22.6” to 26”, 26.1” to 35”, 35.1” to 47”, Above 47”) Read more
- Tire
- Apr 2022
- 114
- PDF, Excel, PPT
Market Definition
The tire industry across New Zealand is import-driven, with the prevalence of Chinese tires and the growing sales of SUVs & pickup trucks. Besides, as the average vehicle age across the country is relatively higher, it augments the need for timely repairs & maintenance, which leads to frequent tire replacements. Due to this, prominent players in the tire industry of New Zealand are set to observe lucrative opportunities in the coming years.
Market Insights
The New Zealand Tire Market is projected to grow at a CAGR of around 3% during the forecast period, i.e., 2022-27. The increasing population, improving economic conditions, & the growing consumer inclination toward private ownership of vehicles are the prime aspects driving the tire industry in New Zealand.
Besides, as the country is highly import-driven due to the absence of tire manufacturing units, the prevalence of Chinese tires is rising rapidly and, in turn, fueling the market growth. Moreover, the government is laying out favorable policies to attract foreign investments in the establishment of tire manufacturing facilities in the country and, in turn, strengthen the overall tire industry.
| Report Coverage | Details |
|---|---|
| Study Period | Historical Data: 2017-20 |
| Base Year: 2021 | |
| Forecast Period: 2022-27 | |
| CAGR(2022-27) | 3% |
| Key Companies Profiled | Bridgestone, Goodyear and Dunlop Tyres, Continental, Yokohama, Michelin, Pirelli, Kumho, Hankook, Toyo, Federal tyres New Zealand |
| Unit Denominations | USD Million/Billion |
Additionally, to reduce carbon emissions and promote environmental sustainability, the government is encouraging the public to adopt Electric Vehicles (EVs) by offering incentives. It, in turn, is accelerating EV sales and instigating the leading market players to import EV-compatible tires, which projects lucrative growth for the tire industry in New Zealand over the coming years.
Furthermore, the increasing number of construction & road infrastructure projects across the country, i.e., surging the demand for commercial vehicles, is another prominent aspect expected to propel the sales of robust tires and augment the overall market growth through 2027.
Impact of Covid-19 on the New Zealand Tire Market
In 2020, the advent of Covid-19 severely impacted the New Zealand Tire Market by introducing numerous unprecedented challenges like disruptions in the supply chain, shortage of raw materials, delays in the deliveries & import of tires, & fluctuations in the raw material & tire prices, among others. It, in turn, caused massive revenue losses to the leading companies in the industry. However, the market players made a paradigm shift to online platforms to sell their products via e-commerce websites & provide door-step delivery & installation to their customers, which somehow facilitated the market growth amidst the crisis.
1. Introduction
1.1. Product and Services Definition
1.2. Research Process
1.3. Assumptions
2. Executive Summary
3. Experts Verbatim-What our experts say?
4. New Zealand Tire Market Voice of Customer
4.1. Brand Awareness
4.2. End User Expectations
4.3. Key Factors Impacting Vendor Selection
4.4. Key Issues Encountered
4.5. Vendor’s Receptiveness to Address Key Customer Issues
4.6. Future Requirements
5. New Zealand Tire Market Analysis, 2017- 2027
5.1. Market Size & Analysis
5.1.1. Market Revenue
5.1.2. Units Sold
5.2. Market Share & Analysis
5.2.1.By Type of Vehicles
5.2.1.1. Passenger Car
5.2.1.2. Light Commercial Vehicle
5.2.1.3. Medium and Heavy Commercial Vehicles
5.2.1.4. Off the Road (OTR)
5.2.1.5. Two Wheelers
5.2.2.By Demand Category
5.2.2.1. OEM
5.2.2.2. Aftermarket
5.2.3.By Type of Tire
5.2.3.1. Radial
5.2.3.2. Bias
5.2.4.By Sales Channel
5.2.4.1. Dealer/Exclusive Outlets
5.2.4.2. Online
5.2.4.3 Direct
5.2.5.By Season
5.2.5.1. All season
5.2.5.2. Summer
5.2.5.3. Winter
5.2.6.By Price Category
5.2.6.1. Budget (Up to USD90)
5.2.6.2. Economy (USD91-USD140
5.2.6.3. Premium (Above USD140)
5.2.7.By Rim Diameter
5.2.7.1. Upto 12”
5.2.7.2. 12.1” to 15”
5.2.7.3. 15.1.” to 18”
5.2.7.4. 18.1” to 20”
5.2.7.5. 20.1” to 22.5”
5.2.7.6. 22.6” to 26”
5.2.7.7. 26.1” to 35”
5.2.7.8. 35.1” to 47”
5.2.7.9. Above 47”
5.2.8.By Company
5.2.8.1. Revenue Shares
5.2.8.2. Strategic Factorial Indexing
5.2.8.3. Competitor Placement in MarkNtel Quadrant
6. New Zealand Passenger Car Tire Market Analysis, 2017- 2027
6.1. Market Size & Analysis
6.1.1. Market Revenue
6.2. Market Share & Analysis
6.2.1. By Type of Vehicle
6.2.1.1. Sedan
6.2.1.2. SUV
6.2.1.3. Hatchbacks
6.2.1.4. Others
6.2.2. By Demand Category
6.2.3. By Type of Tire
6.2.4. By Sales Channel
6.2.5. By Season
6.2.6. By Price Category
6.2.7. By Rim Diameter
7. New Zealand Light Commercial Vehicle Tire Market, 2017-2027
7.1. Market Size & Analysis
7.1.1. Market Revenue
7.2. Market Share & Analysis
7.2.1. By Type of Vehicle
7.2.1.1. Light Trucks
7.2.1.2. Light Buses
7.2.1.3. Pick-up Trucks and Vans
7.2.2. By Demand Category
7.2.3. By Type of Tire
7.2.4. By Sales Channel
7.2.5. By Season
7.2.6. By Price Category
7.2.7. By Rim Diameter
8. New Zealand Medium Heavy Commercial Vehicle Tire Market, 2017-2027
8.1. Market Size & Analysis
8.1.1. Market Revenue
8.2. Market Share & Analysis
8.2.1. By Type of Vehicle
8.2.1.1. Trucks
8.2.1.2. Buses
8.2.2. By Demand Category
8.2.3. By Type of Tire
8.2.4. By Sales Channel
8.2.5. By Season
8.2.6. By Price Category
8.2.7. By Rim Diameter
9. New Zealand Two-Wheeler Tire Market, 2017-2027
9.1. Market Size & Analysis
9.1.1. Market Revenue
9.2. Market Share & Analysis
9.2.1. By Type of Vehicle
9.2.1.1. Scooters
9.2.1.2. Mopeds
9.2.1.3. Motorcycles
9.2.2. By Demand Category
9.2.3. By Type of Tire
9.2.4. By Sales Channel
9.2.5. By Season
9.2.6. By Price Category
9.2.7. By Rim Diameter
10. New Zealand OTR Vehicle Tire Market, 2017-2027
10.1.Market Size & Analysis
10.1.1. Market Revenue
10.2.Market Share & Analysis
10.2.1. By Type of Vehicle
10.2.1.1. Earthmoving Equipment
10.2.1.2. Construction and Agricultural Vehicles
10.2.1.3. Material Handling Vehicles
10.2.2. By Demand Category
10.2.3. By Type of Tire
10.2.4. By Sales Channel
10.2.5. By Season
10.2.6. By Price Category
10.2.7. By Rim Diameter
11. New Zealand Tire Market Policies, Regulations, Product and Services Standards
12. New Zealand Tire Market Trends & Insights
13. New Zealand Tire Market Dynamics
13.1.Growth Drivers
13.2.Challenges
13.3.Impact Analysis
14. New Zealand Tire Market Hotspot & Opportunities
15. New Zealand Tire Market Key Strategic Imperatives for Success & Growth
16. New Zealand Competition Outlook
16.1. Competition Matrix
16.1.1. Product and Services Portfolio
16.1.2. Brand Specialization
16.1.3. Target Markets
16.1.4. Target End Users
16.1.5. Research & Development
16.1.6. Strategic Alliances
16.1.7. Strategic Initiatives
16.2. Company Profiles (Business Description, Product and Services Segments, Business Segments, Financials, Strategic Alliances/ Partnerships, Future Plans)
16.2.1. Bridgestone
16.2.2. Goodyear and Dunlop Tyres
16.2.3. Continental
16.2.4. Yokohama
16.2.5. Michelin
16.2.6. Pirelli
16.2.7. Kumho
16.2.8. Hankook
16.2.9. Toyo
16.2.10. Balkrishna Industries
17. Disclaimer
MarkNtel Advisors follows a robust and iterative research methodology designed to ensure maximum accuracy and minimize deviation in market estimates and forecasts. Our approach combines both bottom-up and top-down techniques to effectively segment and quantify various aspects of the market. A consistent feature across all our research reports is data triangulation, which examines the market from three distinct perspectives to validate findings. Key components of our research process include:
1. Scope & Research Design At the outset, MarkNtel Advisors define the research objectives and formulate pertinent questions. This phase involves determining the type of research—qualitative or quantitative—and designing a methodology that outlines data collection methods, target demographics, and analytical tools. They also establish timelines and budgets to ensure the research aligns with client goals.
2. Sample Selection and Data Collection In this stage, the firm identifies the target audience and determines the appropriate sample size to ensure representativeness. They employ various sampling methods, such as random or stratified sampling, based on the research objectives. Data collection is carried out using tools like surveys, interviews, and observations, ensuring the gathered data is reliable and relevant.
3. Data Analysis and Validation Once data is collected, MarkNtel Advisors undertake a rigorous analysis process. This includes cleaning the data to remove inconsistencies, employing statistical software for quantitative analysis, and thematic analysis for qualitative data. Validation steps are taken to ensure the accuracy and reliability of the findings, minimizing biases and errors.

4. Data Forecast and FinalizationThe final phase involves forecasting future market trends based on the analyzed data. MarkNtel Advisors utilize predictive modeling and time series analysis to anticipate market behaviors. The insights are then compiled into comprehensive reports, featuring visual aids like charts and graphs, and include strategic recommendations to inform client decision-making
FILL THE FORM TO GET THE FREE SAMPLE PAGES
We offer flexible licensing options to cater to varying organizational needs. Choose the pricing pack that best suits your requirements:
Buy Now