
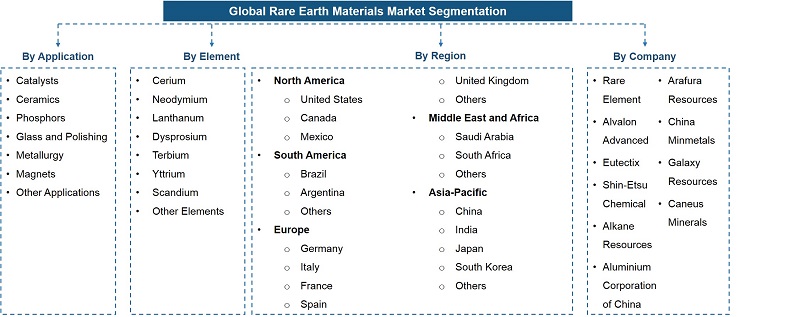
By Type (Cerium, Neodymium, Lanthanum, Dysprosium, Terbium, Yttrium, Scandium, Other Types), By Application (Catalysts, Ceramics, Phosphors, Glass and Polishing, Metallurgy, Magnet......s, Other Applications), By Region (North America, South America, Europe, Middle East and Africa, Asia-Pacific), By Country (United States, Canada, Mexico, Brazil, Germany, Italy, France, Spain, United Kingdom, Saudi Arabia, South Africa, China, India, Japan, South Korea), By Company Read more
- Chemicals
- Dec 2019
- 194
- PDF, Excel, PPT
A rising need for permanent magnet and battery applications is anticipated to fuel the demand for rare earth materials. Due to the escalating demand for high-purity products to achieve higher product quality, it is expected to drive the growth for the Global Rare Earth Materials market.
| Report Coverage | Details |
| Study Period | Historical Data: 2015-19 |
| Base Year: 2019 | |
| Forecast Period: 2020-25 | |
| Regions Covered | North America |
| Europe | |
| Asia-Pacific | |
| South America | |
| Middle East & Africa | |
| Unit Denominations | USD Million/Billion |
The Global Rare Earth Materials market is a highly fragmented market with many players operating in the market. Based on the product quality, independence of project funding, and global distribution and sales network, the leading companies are Lynas Corporation, Treibacher industries, HEFA Rare Earth Canada Co. Ltd. These companies hold a market share of around 8%-13%.
According to MarkNtel Advisors titled “Global Rare Earth Materials Market Analysis, 2020”, the global market is expected to grow at a CAGR of around 3% during 2020-25. The size of the Global Rare Earth Material market was around USD 5.40 billion in 2018. A large volume of rapidly growing volume demand from China, Japan, Korea, Brazil, and Western Europe is driving the demand for rare earth materials.
1. Introduction
1.1. Product Definition
1.2. Research Process
1.3. Assumptions
1.4. Market Segmentation
2. Executive Summary
3. Experts Verbatim-What our experts say?
4. Global Rare Earth Material Market Analysis, 2015- 2025F
4.1. Market Size & Analysis
4.1.1. Market Revenue
4.1.2. Quantity Sold
4.2. Market Share & Analysis
4.2.1. By Element
4.2.1.1. Cerium
4.2.1.2. Neodymium
4.2.1.3. Lanthanum
4.2.1.4. Dysprosium
4.2.1.5. Terbium
4.2.1.6. Yttrium
4.2.1.7. Scandium
4.2.1.8. Other Types
4.2.2. By Application
4.2.2.1. Catalysts
4.2.2.2. Ceramics
4.2.2.3. Phosphors
4.2.2.4. Glass and Polishing
4.2.2.5. Metallurgy
4.2.2.6. Magnets
4.2.2.7. Other Applications
4.2.3. By Region
4.2.3.1. North America
4.2.3.2. South America
4.2.3.3. Europe
4.2.3.4. Middle East and Africa
4.2.3.5. Asia-Pacific
4.2.4. By Company
4.2.4.1. Revenue Shares
4.2.4.2. Strategic Factorial Indexing
4.2.4.3. Competitor Placement in MarkNtel Quadrant
5. North America Rare Earth Material Market Analysis, 2015- 2025F
5.1. Market Size & Analysis
5.1.1. Market Revenue
5.1.2. Quantity Sold
5.2. Market Share & Analysis
5.2.1. By Type
5.2.2. By Application
5.2.3. By Country
5.2.3.1. United States
5.2.3.2. Canada
5.2.3.3. Mexico
5.3. United States Rare Earth Material Market Analysis, 2015- 2025F
5.3.1. Market Size & Analysis
5.3.1.1. Market Revenue
5.3.1.2. Quantity Sold
5.4. Canada Rare Earth Material Market Analysis, 2015- 2025F
5.4.1. Market Size & Analysis
5.4.1.1. Market Revenue
5.4.1.2. Quantity Sold
5.5. Mexico Rare Earth Material Market Analysis, 2015- 2025F
5.5.1. Market Size & Analysis
5.5.1.1. Market Revenue
5.5.1.2. Quantity Sold
6. South America Rare Earth Material Market Analysis, 2015-2025F
6.1. Market Size & Analysis
6.1.1. Market Revenue
6.1.2. Quantity Sold
6.2. Market Share & Analysis
6.2.1. By Type
6.2.2. By Application
6.2.3. By Country
6.2.3.1. Brazil
6.2.3.2. Argentina
6.3. Brazil Rare Earth Material Market Analysis, 2015- 2025F
6.3.1. Market Size & Analysis
6.3.1.1. Market Revenue
6.3.1.2. Quantity Sold
6.4. Argentina Rare Earth Material Market Analysis, 2015- 2025F
6.4.1. Market Size & Analysis
6.4.1.1. Market Revenue
6.4.1.2. Quantity Sold
7. Europe Rare Earth Material Market Analysis, 2015-2025F
7.1. Market Size & Analysis
7.1.1. Market Revenue
7.1.2. Quantity Sold
7.2. Market Share & Analysis
7.3. By Type
7.4. By Application
7.4.1. By Country
7.4.1.1. Germany
7.4.1.2. France
7.4.1.3. Italy
7.4.1.4. Spain
7.4.1.5. United Kingdom
7.5. Germany Rare Earth Material Market Analysis, 2015- 2025F
7.5.1. Market Size & Analysis
7.5.1.1. Market Revenue
7.5.1.2. Quantity Sold
7.6. France Rare Earth Material Market Analysis, 2015- 2025F
7.6.1. Market Size & Analysis
7.6.1.1. Market Revenue
7.6.1.2. Quantity Sold
7.7. Italy Rare Earth Material Market Analysis, 2015- 2025F
7.7.1. Market Size & Analysis
7.7.1.1. Market Revenue
7.7.1.2. Quantity Sold
7.8. Spain Rare Earth Material Market Analysis, 2015- 2025F
7.8.1. Market Size & Analysis
7.8.1.1. Market Revenue
7.8.1.2. Quantity Sold
7.9. United Kingdom Rare Earth Material Market Analysis, 2015- 2025F
7.9.1. Market Size & Analysis
7.9.1.1. Market Revenue
7.9.1.2. Quantity Sold
8. Middle East and Africa Rare Earth Material Market Analysis, 2015-2025F
8.1. Market Size & Analysis
8.1.1. Market Revenue
8.1.2. Quantity Sold
8.2. Market Share & Analysis
8.2.1. By Type
8.2.2. By Application
8.2.3. By Country
8.2.3.1. Saudi Arabia
8.2.3.2. South Africa
8.3. Saudi Arabia Rare Earth Material Market Analysis, 2015- 2025F
8.3.1. Market Size & Analysis
8.3.1.1. Market Revenue
8.3.1.2. Quantity Sold
8.4. South Africa Rare Earth Material Market Analysis, 2015- 2025F
8.4.1. Market Size & Analysis
8.4.1.1. Market Revenue
8.4.1.2. Quantity Sold
9. Asia-Pacific Rare Earth Material Market Analysis, 2015-2025F
9.1. Market Size & Analysis
9.1.1. Market Revenue
9.1.2. Quantity Sold
9.2. Market Share & Analysis
9.2.1. By Type
9.2.2. By Application
9.2.3. By Country
9.2.3.1. China
9.2.3.2. India
9.2.3.3. Japan
9.2.3.4. South Korea
9.3. China Rare Earth Material Market Analysis, 2015- 2025F
9.3.1. Market Size & Analysis
9.3.1.1. Market Revenue
9.3.1.2. Quantity Sold
9.4. India Rare Earth Material Market Analysis, 2015- 2025F
9.4.1. Market Size & Analysis
9.4.1.1. Market Revenue
9.4.1.2. Quantity Sold
9.5. Japan Rare Earth Material Market Analysis, 2015- 2025F
9.5.1. Market Size & Analysis
9.5.1.1. Market Revenue
9.5.1.2. Quantity Sold
9.6. South Korea Rare Earth Material Market Analysis, 2015- 2025F
9.6.1. Market Size & Analysis
9.6.1.1. Market Revenue
9.6.1.2. Quantity Sold
10. Global Rare Earth Material Market Policies, Regulations, Product and Services Standards
11. Global Rare Earth Material Market Trends & Insights
12. Global Rare Earth Material Market Dynamics
12.1.Growth Drivers
12.2.Challenges
12.3.Impact Analysis
13. Global Rare Earth Material Market Hotspot & Opportunities
14. Global Rare Earth Material Market Key Strategic Imperatives for Success & Growth
15. Global Rare Earth Material Market Competition Outlook
15.1. Competition Matrix
15.1.1. Product Portfolio
15.1.2. Brand Specialization
15.1.3. Target Markets
15.1.4. Target End Users
15.1.5. Research & Development
15.1.6. Strategic Alliances
15.1.7. Strategic Initiatives
15.2. Company Profiles (Business Description, Product and Services Segments, Business Segments, Financials, Strategic Alliances/ Partnerships, Future Plans)
15.2.1. Rare Type
15.2.2. Alvalon Advanced
15.2.3. Eutectix
15.2.4. Shin-Etsu Chemical
15.2.5. Alkane Resources
15.2.6. Aluminium Corporation of China
15.2.7. Arafura Resources
15.2.8. China Minmetals
15.2.9. Galaxy Resources
15.2.10. Caneus Minerals
16. Disclaimer
MarkNtel Advisors follows a robust and iterative research methodology designed to ensure maximum accuracy and minimize deviation in market estimates and forecasts. Our approach combines both bottom-up and top-down techniques to effectively segment and quantify various aspects of the market. A consistent feature across all our research reports is data triangulation, which examines the market from three distinct perspectives to validate findings. Key components of our research process include:
1. Scope & Research Design At the outset, MarkNtel Advisors define the research objectives and formulate pertinent questions. This phase involves determining the type of research—qualitative or quantitative—and designing a methodology that outlines data collection methods, target demographics, and analytical tools. They also establish timelines and budgets to ensure the research aligns with client goals.
2. Sample Selection and Data Collection In this stage, the firm identifies the target audience and determines the appropriate sample size to ensure representativeness. They employ various sampling methods, such as random or stratified sampling, based on the research objectives. Data collection is carried out using tools like surveys, interviews, and observations, ensuring the gathered data is reliable and relevant.
3. Data Analysis and Validation Once data is collected, MarkNtel Advisors undertake a rigorous analysis process. This includes cleaning the data to remove inconsistencies, employing statistical software for quantitative analysis, and thematic analysis for qualitative data. Validation steps are taken to ensure the accuracy and reliability of the findings, minimizing biases and errors.

4. Data Forecast and FinalizationThe final phase involves forecasting future market trends based on the analyzed data. MarkNtel Advisors utilize predictive modeling and time series analysis to anticipate market behaviors. The insights are then compiled into comprehensive reports, featuring visual aids like charts and graphs, and include strategic recommendations to inform client decision-making
FILL THE FORM TO GET THE FREE SAMPLE PAGES
We offer flexible licensing options to cater to varying organizational needs. Choose the pricing pack that best suits your requirements:
Buy Now