
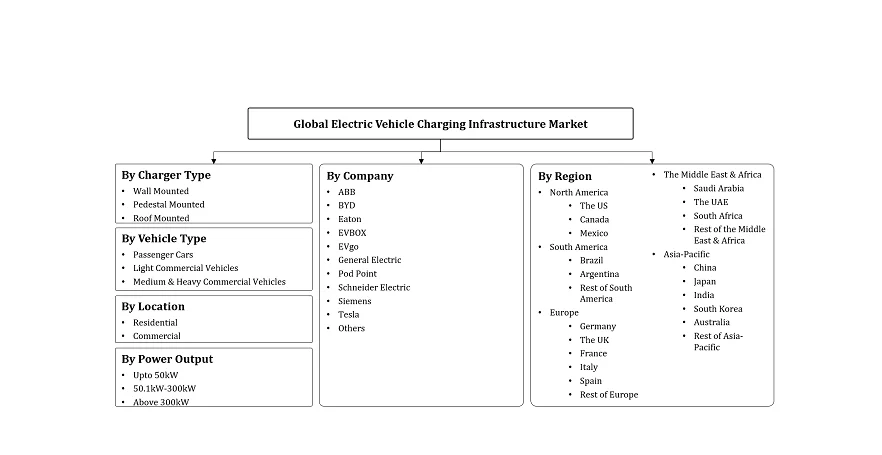
By Charger Type (Wall Mounted, Pedestal Mounted, Roof Mounted), By Vehicle Type (Passenger Cars, Light Commercial Vehicles, Medium & Heavy Commercial Vehicles), By Location (Reside......ntial, Commercial), By Power Output (Upto 50kW, 50.1kW-300kW, Above 300kW), and others Read more
- Automotive
- Jun 2026
- 320
- PDF, Excel, PPT
Global Electric Vehicle Charging Infrastructure Market Key Takeaways
- Global electric vehicle charging infrastructure market size was valued at USD 28.21 billion in 2025 and is projected to grow from USD 33.32 billion in 2026 to USD 90.5 billion by 2032.
- The industry is projected to reflect sustain growth at a steady CAGR of 18.12% during 2026-2032.
- Asia-Pacific holds the largest share of about 55% in 2026.
- Based on location, commercial holds a significant share of about 56% in 2026.
- By charger type, wall mounted seized a significant share of about 57% in 2026.
- The industry is moderately fragmented. However, the top five players collectively account for nearly 45% share.
Global Electric Vehicle Charging Infrastructure Market Size and Outlook
The global electric vehicle charging infrastructure market is estimated to grow at a CAGR of around 18.12% during the forecast period, i.e., 2026-32.
The market is witnessing strong expansion with increasing emphasis on destination charging, fleet electrification, and integrated mobility ecosystems. Airports, shopping malls, hotels, residential complexes, and parking operators are increasingly deploying EV charging stations to improve customer convenience.
Additionally, India is rapidly expanding EV charging infrastructure through fuel retail networks. In 2025, over 27,000 charging points were installed at petrol pumps nationwide under government-supported programs, marking a shift toward converting fuel stations into integrated charging hubs. Moreover, broader initiatives are strengthening public charging deployment across highways, cities, and commercial areas to enhance nationwide electric vehicle mobility and long-distance travel support.
The market is also benefiting from rising electrification of logistics and public transportation fleets. Commercial operators are increasingly investing in depot-based charging infrastructure for electric buses, trucks, and delivery vehicles to reduce operational expenses and achieve sustainability targets. In 2025, Karnataka proposed installation of around 1,500 high-capacity charging stations ranging from 60 kW to 240 kW to support heavy electric vehicles, intercity transportation, and commercial fleet operations. Karnataka EV Charging Expansion Plan.
Another important development is the transformation of charging stations into digitally connected mobility platforms through integration of reservation systems, digital payment gateways, mobile applications, and real-time charger tracking technologies. These advancements are improving operational efficiency, user convenience, and charging accessibility across urban and highway networks.
Overall, increasing investments in public charging accessibility, commercial fleet electrification, and smart charging ecosystems are strengthening the long-term outlook of the global EV charging infrastructure market. Expanding commercial applications, digital integration, and government-backed charging initiatives are expected to accelerate infrastructure deployment and support sustainable transportation growth, driving the market from USD 33.32 billion in 2026 to USD 90.5 billion by 2032.
Global Electric Vehicle Charging Infrastructure Market Key Indicators
- Global EV sales have grown exponentially in recent years. In 2023, electric car sales rose 35% year-on-year accounting for 18% of all cars sold globally, with over 250,000 new registrations recorded every week. Building on this momentum, global EV sales reached approximately 20.7 million units in 2025 more than a quarter of all new cars sold worldwide. China led with 16.49 million units, followed by Europe at 3.3 million BEVs and the U.S. at 1.6 million combined BEV and PHEV sales.
- The global EV fleet is expanding rapidly. The global EV stock grew from less than 45 million in 2023, projected to reach 250 million by 2030 and 525 million by 2035 averaging 23% annual growth under IEA's Stated Policies Scenario. In terms of overall vehicle ownership, the world's light-duty vehicle ownership average rose 15% between 2013 and 2021, from 281 to 332 LDVs per 1,000 population(International Road Federation, 2023).
- Charging infrastructure density remains a critical metric. As per the IEA, the ratio of electric LDVs per public charging point stood at less than 15 in 2024 globally, projected to rise to approximately 25 by 2030 as EV fleet growth outpaces charger additions. Regionally, China maintained more than one public charger per 10 EVs in 2024, while the EU had one chargepoint for every 13 EVs. U.S. public charging stock grew 20% in 2024 to just under 200,000 public charging points
- Rising greenfield investments by OEMs signal accelerating EV production scale, directly amplifying demand for charging infrastructure. Rivian broke ground on its USD 5 billion plant at Stanton Springs North, Georgia, on September 16, 2025, targeting 400,000 vehicles annually and 7,500 jobs by 2030. Reinforcing this, General Motors committed USD 4 billion across plants in Michigan, Kansas, and Tennessee, designating Factory ZERO as its dedicated EV assembly hub targeting over 2 million U.S.-produced vehicles per year.
Global Electric Vehicle Charging Infrastructure Market Scope
| Category | Segments |
|---|---|
| By Charger Type | Wall Mounted, Pedestal Mounted, Roof Mounted |
| By Vehicle Type | Passenger Cars, Light Commercial Vehicles, Medium & Heavy Commercial Vehicles |
| By Location | Residential, Commercial |
| By Power Output | Upto 50kW, 50.1kW-300kW, Above 300kW |
Global Electric Vehicle Charging Infrastructure Market Growth Drivers
Government Policies and Investment Driving Global EV Adoption
Global EV adoption is being strongly driven by government policies, funding programs, and regulatory mandates across major economies. EV sales rose from nearly 14 million units in 2023, increasing 35% year-on-year, and further grew to over 17 million units in 2024, capturing more than 20% global market share. By 2025, sales reached 20.7 million units, accounting for over 25% of global new car sales, reflecting a policy-supported shift toward electrification as per the International Energy Agency (IEA).
Additionally, governments are strengthening EV adoption through infrastructure investments. The United States has allocated USD 5 billion under the NEVI Formula Program via the Bipartisan Infrastructure Law to expand nationwide charging infrastructure and improve highway connectivity.
Moreover, global clean energy and electrification investment continues to grow across EV manufacturing and battery supply chains. The IEA Energy Technology Perspectives report highlights substantial investment expansion in EV-related manufacturing ecosystems, reflecting accelerating industrial capacity development across major markets.
Additionally, policy measures such as emission reduction mandates, purchase incentives, and energy security strategies continue to strengthen EV market penetration. These combined factors are expected to sustain long-term growth in EV deployment and directly support increasing demand for charging infrastructure worldwide.
- Market Segmentation
- Introduction
- Market Definition
- Research Process
- Assumption
- Executive Summary
- Global Electric Vehicle Charging Infrastructure Market Trends & Insights
- Global Electric Vehicle Charging Infrastructure Market Dynamics
- Growth Drivers
- Challenges
- Global Electric Vehicle Charging Infrastructure Market Hotspot & Opportunities
- Global Electric Vehicle Charging Infrastructure Market Regulation & Policy
- Global Electric Vehicle Charging Infrastructure Market Outlook, 2026-2032F
- Market Size & Outlook
- By Revenues (USD Million)
- Market Share & Outlook
- By Charger Type- Market Size & Forecast 2026-2032, (USD Million)
- Wall Mounted
- Pedestal Mounted
- Roof Mounted
- By Vehicle Type- Market Size & Forecast 2026-2032, (USD Million)
- Passenger Cars
- Light Commercial Vehicles
- Medium & Heavy Commercial Vehicles
- By Location- Market Size & Forecast 2026-2032, (USD Million)
- Residential
- Commercial
- By Power Output- Market Size & Forecast 2026-2032, (USD Million)
- Upto 50kW
- 50.1kW-300kW
- Above 300kW
- By Region
- North America
- South America
- Europe
- The Middle East & Africa
- Asia-Pacific
- By Company
- Competition Characteristics
- Revenue Shares
- By Charger Type- Market Size & Forecast 2026-2032, (USD Million)
- Market Size & Outlook
- North America Electric Vehicle Charging Infrastructure Market Outlook, 2026-2032F
- Market Size & Outlook
- By Revenues (USD Million)
- Market Share & Outlook
- By Charger Type- Market Size & Forecast 2026-2032, (USD Million)
- By Vehicle Type- Market Size & Forecast 2026-2032, (USD Million)
- By Location- Market Size & Forecast 2026-2032, (USD Million)
- By Power Output- Market Size & Forecast 2026-2032, (USD Million)
- By Country
- The US
- Canada
- Mexico
- The US Electric Vehicle Charging Infrastructure Market Outlook, 2026-2032F
- Market Size & Outlook
- By Revenues (USD Million)
- Market Size & Outlook
- By Vehicle Type- Market Size & Forecast 2026-2032, (USD Million)
- By Location- Market Size & Forecast 2026-2032, (USD Million)
- By Charger Type- Market Size & Forecast 2026-2032, (USD Million)
- By Power Output- Market Size & Forecast 2026-2032, (USD Million)
- Market Size & Outlook
- Canada Electric Vehicle Charging Infrastructure Market Outlook, 2026-2032F
- Market Size & Outlook
- By Revenues (USD Million)
- Market Size & Outlook
- By Vehicle Type- Market Size & Forecast 2026-2032, (USD Million)
- By Location- Market Size & Forecast 2026-2032, (USD Million)
- By Charger Type- Market Size & Forecast 2026-2032, (USD Million)
- By Power Output- Market Size & Forecast 2026-2032, (USD Million)
- Market Size & Outlook
- Mexico Electric Vehicle Charging Infrastructure Market Outlook, 2026-2032F
- Market Size & Outlook
- By Revenues (USD Million)
- Market Size & Outlook
- By Vehicle Type- Market Size & Forecast 2026-2032, (USD Million)
- By Location- Market Size & Forecast 2026-2032, (USD Million)
- By Charger Type- Market Size & Forecast 2026-2032, (USD Million)
- By Power Output- Market Size & Forecast 2026-2032, (USD Million)
- Market Size & Outlook
- Market Size & Outlook
- South America Electric Vehicle Charging Infrastructure Market Outlook, 2026-2032F
- Market Size & Outlook
- By Revenues (USD Million)
- Market Share & Outlook
- By Charger Type- Market Size & Forecast 2026-2032, (USD Million)
- By Vehicle Type- Market Size & Forecast 2026-2032, (USD Million)
- By Location- Market Size & Forecast 2026-2032, (USD Million)
- By Power Output- Market Size & Forecast 2026-2032, (USD Million)
- By Country
- Brazil
- Argentina
- Rest of South America
- Brazil Electric Vehicle Charging Infrastructure Market Outlook, 2026-2032F
- Market Size & Outlook
- By Revenues (USD Million)
- Market Size & Outlook
- By Vehicle Type- Market Size & Forecast 2026-2032, (USD Million)
- By Location- Market Size & Forecast 2026-2032, (USD Million)
- By Charger Type- Market Size & Forecast 2026-2032, (USD Million)
- By Power Output- Market Size & Forecast 2026-2032, (USD Million)
- Market Size & Outlook
- Argentina Electric Vehicle Charging Infrastructure Market Outlook, 2026-2032F
- Market Size & Outlook
- By Revenues (USD Million)
- Market Size & Outlook
- By Vehicle Type- Market Size & Forecast 2026-2032, (USD Million)
- By Location- Market Size & Forecast 2026-2032, (USD Million)
- By Charger Type- Market Size & Forecast 2026-2032, (USD Million)
- By Power Output- Market Size & Forecast 2026-2032, (USD Million)
- Market Size & Outlook
- Market Size & Outlook
- Europe Electric Vehicle Charging Infrastructure Market Outlook, 2026-2032F
- Market Size & Outlook
- By Revenues (USD Million)
- Market Share & Outlook
- By Charger Type- Market Size & Forecast 2026-2032, (USD Million)
- By Vehicle Type- Market Size & Forecast 2026-2032, (USD Million)
- By Location- Market Size & Forecast 2026-2032, (USD Million)
- By Power Output- Market Size & Forecast 2026-2032, (USD Million)
- By Country
- The UK
- Germany
- France
- Italy
- Spain
- Rest of Europe
- The UK Electric Vehicle Charging Infrastructure Market Outlook, 2026-2032F
- Market Size & Outlook
- By Revenues (USD Million)
- Market Size & Outlook
- By Vehicle Type- Market Size & Forecast 2026-2032, (USD Million)
- By Location- Market Size & Forecast 2026-2032, (USD Million)
- By Charger Type- Market Size & Forecast 2026-2032, (USD Million)
- By Power Output- Market Size & Forecast 2026-2032, (USD Million)
- Market Size & Outlook
- Germany Electric Vehicle Charging Infrastructure Market Outlook, 2026-2032F
- Market Size & Outlook
- By Revenues (USD Million)
- Market Size & Outlook
- By Vehicle Type- Market Size & Forecast 2026-2032, (USD Million)
- By Location- Market Size & Forecast 2026-2032, (USD Million)
- By Charger Type- Market Size & Forecast 2026-2032, (USD Million)
- By Power Output- Market Size & Forecast 2026-2032, (USD Million)
- Market Size & Outlook
- France Electric Vehicle Charging Infrastructure Market Outlook, 2026-2032F
- Market Size & Outlook
- By Revenues (USD Million)
- Market Size & Outlook
- By Vehicle Type- Market Size & Forecast 2026-2032, (USD Million)
- By Location- Market Size & Forecast 2026-2032, (USD Million)
- By Charger Type- Market Size & Forecast 2026-2032, (USD Million)
- By Power Output- Market Size & Forecast 2026-2032, (USD Million)
- Market Size & Outlook
- Italy Electric Vehicle Charging Infrastructure Market Outlook, 2026-2032F
- Market Size & Outlook
- By Revenues (USD Million)
- Market Size & Outlook
- By Vehicle Type- Market Size & Forecast 2026-2032, (USD Million)
- By Location- Market Size & Forecast 2026-2032, (USD Million)
- By Charger Type- Market Size & Forecast 2026-2032, (USD Million)
- By Power Output- Market Size & Forecast 2026-2032, (USD Million)
- Market Size & Outlook
- Spain Electric Vehicle Charging Infrastructure Market Outlook, 2026-2032F
- Market Size & Outlook
- By Revenues (USD Million)
- Market Size & Outlook
- By Vehicle Type- Market Size & Forecast 2026-2032, (USD Million)
- By Location- Market Size & Forecast 2026-2032, (USD Million)
- By Charger Type- Market Size & Forecast 2026-2032, (USD Million)
- By Power Output- Market Size & Forecast 2026-2032, (USD Million)
- Market Size & Outlook
- Market Size & Outlook
- The Middle East & Africa Electric Vehicle Charging Infrastructure Market Outlook, 2026-2032F
- Market Size & Outlook
- By Revenues (USD Million)
- Market Share & Outlook
- By Charger Type- Market Size & Forecast 2026-2032, (USD Million)
- By Vehicle Type- Market Size & Forecast 2026-2032, (USD Million)
- By Location- Market Size & Forecast 2026-2032, (USD Million)
- By Power Output- Market Size & Forecast 2026-2032, (USD Million)
- By Country
- Saudi Arabia
- The UAE
- South Africa
- Rest of the Middle East & Africa
- Saudi Arabia Electric Vehicle Charging Infrastructure Market Outlook, 2026-2032F
- Market Size & Outlook
- By Revenues (USD Million)
- Market Size & Outlook
- By Vehicle Type- Market Size & Forecast 2026-2032, (USD Million)
- By Location- Market Size & Forecast 2026-2032, (USD Million)
- By Charger Type- Market Size & Forecast 2026-2032, (USD Million)
- By Power Output- Market Size & Forecast 2026-2032, (USD Million)
- Market Size & Outlook
- The UAE Electric Vehicle Charging Infrastructure Market Outlook, 2026-2032F
- Market Size & Outlook
- By Revenues (USD Million)
- Market Size & Outlook
- By Vehicle Type- Market Size & Forecast 2026-2032, (USD Million)
- By Location- Market Size & Forecast 2026-2032, (USD Million)
- By Charger Type- Market Size & Forecast 2026-2032, (USD Million)
- By Power Output- Market Size & Forecast 2026-2032, (USD Million)
- Market Size & Outlook
- South Africa Electric Vehicle Charging Infrastructure Market Outlook, 2026-2032F
- Market Size & Outlook
- By Revenues (USD Million)
- Market Size & Outlook
- By Vehicle Type- Market Size & Forecast 2026-2032, (USD Million)
- By Location- Market Size & Forecast 2026-2032, (USD Million)
- By Charger Type- Market Size & Forecast 2026-2032, (USD Million)
- By Power Output- Market Size & Forecast 2026-2032, (USD Million)
- Market Size & Outlook
- Market Size & Outlook
- Asia-Pacific Electric Vehicle Charging Infrastructure Market Outlook, 2026-2032F
- Market Size & Outlook
- By Revenues (USD Million)
- Market Share & Outlook
- By Charger Type- Market Size & Forecast 2026-2032, (USD Million)
- By Vehicle Type- Market Size & Forecast 2026-2032, (USD Million)
- By Location- Market Size & Forecast 2026-2032, (USD Million)
- By Power Output- Market Size & Forecast 2026-2032, (USD Million)
- By Country
- China
- Japan
- South Korea
- India
- Australia
- Rest of Asia-Pacific
- China Electric Vehicle Charging Infrastructure Market Outlook, 2026-2032F
- Market Size & Outlook
- By Revenues (USD Million)
- Market Size & Outlook
- By Vehicle Type- Market Size & Forecast 2026-2032, (USD Million)
- By Location- Market Size & Forecast 2026-2032, (USD Million)
- By Charger Type- Market Size & Forecast 2026-2032, (USD Million)
- By Power Output- Market Size & Forecast 2026-2032, (USD Million)
- Market Size & Outlook
- Japan Electric Vehicle Charging Infrastructure Market Outlook, 2026-2032F
- Market Size & Outlook
- By Revenues (USD Million)
- Market Size & Outlook
- By Vehicle Type- Market Size & Forecast 2026-2032, (USD Million)
- By Location- Market Size & Forecast 2026-2032, (USD Million)
- By Charger Type- Market Size & Forecast 2026-2032, (USD Million)
- By Power Output- Market Size & Forecast 2026-2032, (USD Million)
- Market Size & Outlook
- South Korea Electric Vehicle Charging Infrastructure Market Outlook, 2026-2032F
- Market Size & Outlook
- By Revenues (USD Million)
- Market Size & Outlook
- By Vehicle Type- Market Size & Forecast 2026-2032, (USD Million)
- By Location- Market Size & Forecast 2026-2032, (USD Million)
- By Charger Type- Market Size & Forecast 2026-2032, (USD Million)
- By Power Output- Market Size & Forecast 2026-2032, (USD Million)
- Market Size & Outlook
- India Electric Vehicle Charging Infrastructure Market Outlook, 2026-2032F
- Market Size & Outlook
- By Revenues (USD Million)
- Market Size & Outlook
- By Vehicle Type- Market Size & Forecast 2026-2032, (USD Million)
- By Location- Market Size & Forecast 2026-2032, (USD Million)
- By Charger Type- Market Size & Forecast 2026-2032, (USD Million)
- By Power Output- Market Size & Forecast 2026-2032, (USD Million)
- Market Size & Outlook
- Australia Electric Vehicle Charging Infrastructure Market Outlook, 2026-2032F
- Market Size & Outlook
- By Revenues (USD Million)
- Market Size & Outlook
- By Vehicle Type- Market Size & Forecast 2026-2032, (USD Million)
- By Location- Market Size & Forecast 2026-2032, (USD Million)
- By Charger Type- Market Size & Forecast 2026-2032, (USD Million)
- By Power Output- Market Size & Forecast 2026-2032, (USD Million)
- Market Size & Outlook
- Market Size & Outlook
- Global Electric Vehicle Charging Infrastructure Market Key Strategic Imperatives for Success & Growth
- Competitive Outlook
- Company Profiles
- ABB
- Business Description
- Product Portfolio
- Strategic Alliances or Partnerships
- Recent Developments
- Financial Details
- Others
- BP Pulse
- Business Description
- Product Portfolio
- Strategic Alliances or Partnerships
- Recent Developments
- Financial Details
- Others
- Charge Point
- Business Description
- Product Portfolio
- Strategic Alliances or Partnerships
- Recent Developments
- Financial Details
- Others
- EVBOX
- Business Description
- Product Portfolio
- Strategic Alliances or Partnerships
- Recent Developments
- Financial Details
- Others
- EVgo
- Business Description
- Product Portfolio
- Strategic Alliances or Partnerships
- Recent Developments
- Financial Details
- Others
- Shell Recharge
- Business Description
- Product Portfolio
- Strategic Alliances or Partnerships
- Recent Developments
- Financial Details
- Others
- Wallbox
- Business Description
- Product Portfolio
- Strategic Alliances or Partnerships
- Recent Developments
- Financial Details
- Others
- Schneider Electric
- Business Description
- Product Portfolio
- Strategic Alliances or Partnerships
- Recent Developments
- Financial Details
- Others
- Siemens
- Business Description
- Product Portfolio
- Strategic Alliances or Partnerships
- Recent Developments
- Financial Details
- Others
- Tesla
- Business Description
- Product Portfolio
- Strategic Alliances or Partnerships
- Recent Developments
- Financial Details
- Others
- Blink Charging
- Business Description
- Product Portfolio
- Strategic Alliances or Partnerships
- Recent Developments
- Financial Details
- Others
- Electrify America
- Business Description
- Product Portfolio
- Strategic Alliances or Partnerships
- Recent Developments
- Financial Details
- Others
- Enel X
- Business Description
- Product Portfolio
- Strategic Alliances or Partnerships
- Recent Developments
- Financial Details
- Others
- IONITY
- Business Description
- Product Portfolio
- Strategic Alliances or Partnerships
- Recent Developments
- Financial Details
- Others
- Tritium
- Business Description
- Product Portfolio
- Strategic Alliances or Partnerships
- Recent Developments
- Financial Details
- Others
- Others
- ABB
- Company Profiles
- Disclaimer
MarkNtel Advisors follows a robust and iterative research methodology designed to ensure maximum accuracy and minimize deviation in market estimates and forecasts. Our approach combines both bottom-up and top-down techniques to effectively segment and quantify various aspects of the market. A consistent feature across all our research reports is data triangulation, which examines the market from three distinct perspectives to validate findings. Key components of our research process include:
1. Scope & Research Design At the outset, MarkNtel Advisors define the research objectives and formulate pertinent questions. This phase involves determining the type of research—qualitative or quantitative—and designing a methodology that outlines data collection methods, target demographics, and analytical tools. They also establish timelines and budgets to ensure the research aligns with client goals.
2. Sample Selection and Data Collection In this stage, the firm identifies the target audience and determines the appropriate sample size to ensure representativeness. They employ various sampling methods, such as random or stratified sampling, based on the research objectives. Data collection is carried out using tools like surveys, interviews, and observations, ensuring the gathered data is reliable and relevant.
3. Data Analysis and Validation Once data is collected, MarkNtel Advisors undertake a rigorous analysis process. This includes cleaning the data to remove inconsistencies, employing statistical software for quantitative analysis, and thematic analysis for qualitative data. Validation steps are taken to ensure the accuracy and reliability of the findings, minimizing biases and errors.

4. Data Forecast and FinalizationThe final phase involves forecasting future market trends based on the analyzed data. MarkNtel Advisors utilize predictive modeling and time series analysis to anticipate market behaviors. The insights are then compiled into comprehensive reports, featuring visual aids like charts and graphs, and include strategic recommendations to inform client decision-making
FILL THE FORM TO GET THE FREE SAMPLE PAGES
We offer flexible licensing options to cater to varying organizational needs. Choose the pricing pack that best suits your requirements:
Buy Now