

By Component (Solutions, Services (Consulting, Integration & Deployment, Support & Maintenance)), By Deployment Mode (Cloud, On-Premises), By Organization Size (Corporate Enterpris......es, Mid-Tier Enterprises, Small Businesses), By Vertical (Manufacturing (Food & Beverages, Metals & Mining, Chemical & Materials, Electronics & Consumer Goods, Automotive, Pharmaceutical & Healthcare, Others), Energy & Utilities, Residential & Commercial Buildings, Transportation & Logistics, IT & Telecom, Financial Services, Government), and others Read more
- Environment
- Jul 2026
- 130
- PDF, Excel, PPT
Australia Carbon Footprint Management Market Key Takeaways
- The Australia Carbon Footprint Management Market was valued at approximately USD 0.92 billion in 2025 and is estimated to reach USD 0.96 billion in 2026.
- The market is projected to expand further and reach approximately USD 1.34 billion by 2032 at a CAGR of 5.72% during the forecast period.
- By deployment mode, cloud-based deployment dominates the market, accounting for approximately 80% of the total market share.
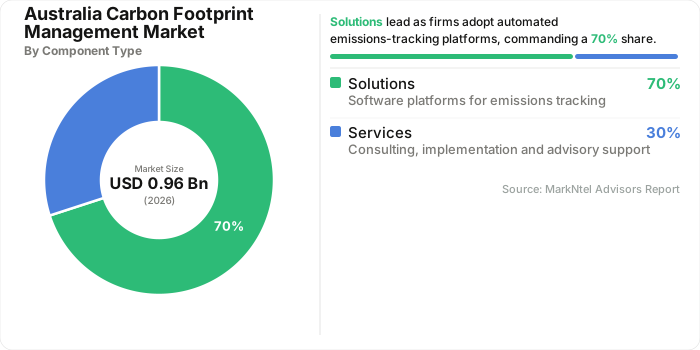
- By component, the solutions lead the market with a 70% share in 2026.
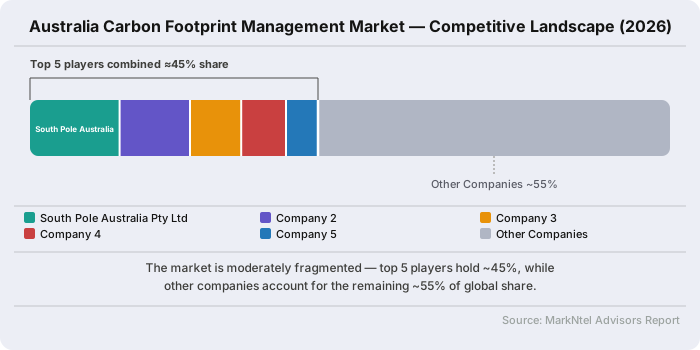
- The market is moderately consolidated, with the top five players collectively holding around 45% of the total market share.
Australia Carbon Footprint Management Market Size and Outlook
Australia’s carbon footprint management market is valued at USD 0.92 billion in 2025, 0.96 billion in 2026, and is projected to reach USD 1.34 billion by 2032, expanding at a CAGR of 5.72% during the forecast period.
Market growth is primarily driven by the introduction of mandatory climate-related financial disclosures under the Treasury Laws Amendment (Financial Market Infrastructure and Other Measures) Act 2024, which received royal assent in September 2024. The regulation requires Group 1 reporting entities to disclose climate-related financial information for financial years beginning on or after January 2025, accelerating the adoption of structured carbon management solutions.
The implementation of the Australian Sustainability Reporting Standards (ASRS) and AASB S2 Climate-related Disclosures is further strengthening demand for software. Companies are increasingly moving away from manual spreadsheet-based tracking toward automated systems capable of accurately measuring, reporting, and managing Scope 1, Scope 2, and Scope 3 emissions while ensuring compliance with regulatory requirements.
Demand is particularly strong among Australia’s energy-intensive industries. The updated Safeguard Mechanism requires 219 large industrial facilities emitting more than 100,000 tonnes of CO₂-e annually to operate within declining emissions baselines, which are reduced by 4.9% annually until 2030. This regulatory framework is encouraging mining, energy, manufacturing, and heavy industrial companies to adopt advanced carbon monitoring and emissions management solutions.
Technology providers are also expanding their offerings to support this transition. Telstra Corporation Limited has partnered with Microsoft Corporation to integrate sustainability management capabilities with IoT-based data collection, helping businesses transform operational data into disclosure-ready emissions insights. Similarly, SAP Australia Pty Ltd provides sustainability management solutions that enable organizations to calculate corporate and product carbon footprints using existing enterprise resource planning (ERP) data.
As climate disclosure requirements gradually expand beyond large corporations to a broader range of listed and private organizations, demand for carbon measurement, verification, reporting, and decarbonization management solutions is expected to remain strong throughout the forecast period.
Australia Carbon Footprint Management Market Key Indicators
- The Department of Climate Change, Energy, the Environment and Water reported that Australia's national greenhouse gas emissions declined by 2.1% year-on-year to 458.9 million tonnes of CO₂-e in the year ending December 2025. As the government continues to monitor progress toward its 2030 emissions reduction target, organizations are increasingly adopting verified carbon emissions measurement and reporting solutions, supporting demand for carbon footprint management industry in Australia.
- The Department of Climate Change, Energy, the Environment and Water reported that 219 facilities covered under the Safeguard Mechanism across the mining, manufacturing, transport, oil and gas, and waste sectors accounted for approximately 31% of Australia's total greenhouse gas emissions in 2023–24. Mandatory compliance for facilities emitting more than 100,000 tonnes of CO₂-e annually is driving demand for facility-level carbon footprint measurement, monitoring, and reporting solutions.
- According to the Clean Energy Regulator, Safeguard Mechanism baselines are set to decline by 4.9% annually through 2030, requiring covered facilities to continuously reduce their emissions intensity or surrender Australian Carbon Credit Units (ACCUs) to remain compliant. These ongoing compliance obligations are driving sustained investment in carbon accounting, emissions monitoring, and carbon abatement technologies across regulated industries.
Australia Carbon Footprint Management Market Scope
| Category | Segments |
|---|---|
| By Component | Solutions, Services (Consulting, Integration & Deployment, Support & Maintenance |
| By Deployment Mode | Cloud, On-Premises |
| By Organization Size | Corporate Enterprises, Mid-Tier Enterprises, Small Businesses |
| By Vertical | Manufacturing (Food & Beverages, Metals & Mining, Chemical & Materials, Electronics & Consumer Goods, Automotive, Pharmaceutical & Healthcare, Others), Energy & Utilities, Residential & Commercial Buildings, Transportation & Logistics, IT & Telecom, Financial Services, Government |
Australia Carbon Footprint Management Market Growth Drivers
Mandatory Climate-Related Financial Disclosure Under the Corporations Act Driving Carbon Footprint Management Adoption
Australia's mandatory climate-related financial disclosure requirements under the Corporations Act 2001 are accelerating demand for carbon footprint management solutions. Large entities meeting at least two of three thresholds consolidated revenue exceeding USD 715 million, consolidated gross assets above USD 715 million, or more than 500 employees are now required to annually disclose audit-ready Scope 1, Scope 2, and Scope 3 greenhouse gas emissions. Meeting these reporting obligations has become increasingly difficult using spreadsheet-based processes , prompting organizations to invest in dedicated carbon footprint management platforms that automate emissions calculations, consolidate data across multiple facilities, and generate assurance-ready reports.
The regulatory impact is already evident. According to the Australian Securities and Investments Commission (ASIC), sustainability reports for the financial year ending December 2025 had been submitted by May 2026, comprising unlisted entities. As mandatory reporting expands to Group 2 entities from 1 July 2026 and Group 3 entities from 1 July 2027, a significantly larger number of organizations will be required to implement emissions measurement, reporting, and verification systems.
Recent Trends
Rising Adoption of AI-Automated Platforms Replacing Manual Spreadsheet-Based Emissions Reporting
The growing complexity of greenhouse gas accounting and climate disclosure requirements is encouraging Australian organizations to transition from manual emissions reporting to AI-enabled carbon footprint management platforms. As businesses manage larger volumes of operational, energy, and supplier data, spreadsheet-based reporting is becoming increasingly inefficient, error-prone, and difficult to maintain. This shift has accelerated following the Department of Climate Change, Energy, the Environment and Water's revision of the 2025 National Greenhouse Accounts Factors, which replaced the previous three-year averaging methodology with single-year AEMO NEM Review data.
The updated approach resulted in significant changes to state-level electricity emission factors, including a decline of around 6% in Queensland and an increase of approximately 33% in Tasmania, requiring organizations to recalculate emissions more frequently and accurately. In response, technology providers are introducing AI-driven solutions that automate emissions data collection, calculations, and compliance reporting. For instance, Climate & Decisions launched ASRS in a Box in August 2025 to help ASX-listed companies streamline climate disclosures, while Brave Gen expanded its carbon accounting platform in September 2025 with automated building performance optimization. These innovations are strengthening demand for intelligent carbon footprint management solutions that improve reporting accuracy, operational efficiency, and audit readiness.
Australia Carbon Footprint Management Market Opportunities and Challenges
Rising Safeguard Mechanism Compliance Costs Driving Investment in Industrial Decarbonisation Financing
Australia’s strengthening Safeguard Mechanism is encouraging large industrial emitters to shift from short-term carbon-credit purchasing toward long-term emissions-reduction investments. Under the reformed mechanism, emissions baselines for covered facilities generally decline by 4.9% annually through 2030, increasing pressure on high-emitting organizations to improve operational efficiency and reduce emissions intensity. As compliance obligations increase, continued dependence on Australian Carbon Credit Units (ACCUs) and Safeguard Mechanism Credits (SMCs) may expose organizations to rising and potentially volatile compliance costs. Consequently, covered facilities are increasingly evaluating investments in electrification, renewable energy integration, energy-efficient equipment, low-emission production technologies, process optimization, and other industrial decarbonisation initiatives.
The expanding availability of sustainable finance is supporting this transition by improving access to capital for emissions-reduction projects. In the 2024–25 financial year, the Clean Energy Finance Corporation (CEFC) made record new investment commitments of approximately AUD 4.7 billion, supporting projects across renewable energy, energy efficiency, electrification, low-emission technologies, and broader economic decarbonisation. These commitments mobilized additional private-sector capital and increased the overall value of transactions supported through public–private co-investment.
The convergence of stricter emissions requirements and expanding green-finance availability is creating opportunities for carbon footprint management industry players. Organizations seeking decarbonisation financing require accurate, auditable, and decision-ready emissions data to establish emissions baselines, identify high-emission assets and processes, evaluate abatement opportunities, estimate compliance-cost exposure, and demonstrate the environmental performance of funded projects. Consequently, demand is expected to increase for carbon footprint management platforms offering automated emissions-data collection, Scope 1, Scope 2, and Scope 3 accounting, scenario modelling, abatement planning, regulatory reporting, and investment-performance tracking. These capabilities can enable Australian industrial organizations to align Safeguard Mechanism compliance with long-term decarbonisation strategies while improving access to sustainability-linked financing.
Segmentation Insights
Carbon Accounting Software Takes the Lead Amid Australia's Climate Reporting Push
Software solutions account for nearly 70% of Australia's carbon footprint management market, primarily because organisations increasingly require continuous emissions monitoring, automated carbon accounting, and audit-ready reporting rather than one-time consulting services. The introduction of mandatory climate-related financial disclosures has shifted enterprise spending toward platforms that collect emissions data from multiple operational systems, apply updated emission factors automatically, and generate standardised reports for recurring compliance, reducing manual intervention while improving reporting accuracy .
This trend is evident in the growing adoption of solutions such as Net Nada, which supports more than 1,000 Australian businesses with automated emissions tracking, while Sumday has strengthened software adoption by embedding carbon accounting directly into the financial workflows used by leading accounting firms, including KPMG and Pitcher Partners. As reporting obligations expand, demand for integrated software platforms is expected to outpace consulting-led engagements, reinforcing software as the largest revenue-generating component of the market. By component, the market is further segmented into the following sub-categories:
- Solutions
- Services
- Consulting
- Integration & Deployment
- Support & Maintenance
Cloud-Based Platforms Strengthen Their Leadership Through Scalability and Seamless Enterprise Integration
Cloud deployment accounts for approximately 80% of Australia's carbon footprint management market, supported by the growing adoption of Software-as-a-Service platforms that simplify emissions accounting, regulatory reporting, and enterprise-wide data management. As organizations prepare for recurring climate disclosures, cloud-based solutions offer automatic updates to emission factors, centralized data storage, real-time analytics, and seamless integration with ERP, accounting, and procurement systems without requiring significant upfront infrastructure investments. Their subscription-based model also enables faster implementation, lower maintenance costs, and easier scalability across multiple business locations, making cloud deployment the preferred choice for organizations of all sizes.
The trend is reflected in the expansion of Australian cloud solution providers. In April 2025, SumDay partnered with Xero to provide more than 4 million Xero customers with 12 months of free access to its cloud-based carbon accounting platform. The partnership enables businesses to automatically extract financial data, generate audit-ready emissions reports, leverage AI-powered carbon accounting assistance, and collaborate with suppliers through a single cloud environment, significantly reducing manual reporting efforts. As Australia's climate reporting requirements continue to expand, the flexibility, continuous software updates, and integration capabilities offered by cloud platforms are expected to reinforce their dominance within the carbon footprint management market. By deployment type the market is further segmented into the following sub-categories:
- Cloud
- On-Premises
Australia Carbon Footprint Management Market Competitive Landscape
The Australia carbon footprint management market is moderately consolidated, with the top five players accounting for approximately 45% of the total market share. Leading companies include South Pole Australia Pty Ltd, Eco Act SAS, Avarni Pty Ltd, Net Nada Pty Ltd, and Sumday Pty Ltd, supported by their comprehensive carbon accounting platforms, ESG reporting capabilities, Scope 1–3 emissions management solutions, and strong presence across enterprise and government sectors.
Major Companies in the Australia Carbon Footprint Management Market:
- Net- Nada Pty Ltd
- Avarni Pty Ltd
- Carbon Core Pty Ltd
- Trace ESG Pty Ltd
- Sum day Pty Ltd
- Corporate Carbon Group Pty Ltd
- North more Gordon Pty Ltd
- Pangolin Associates Pty Limited
- South Pole Australia Pty Ltd
- Eco Act SAS
Australia Carbon Footprint Management Market News and Recent Developments
2025: Avarni Launches New Feature to Track SBTi Commitments Across Supply Chains
In February 2025, Avarni introduced a new feature that enables organizations to automatically identify, monitor, and analyze suppliers with Science Based Targets initiative (SBTi) commitments across their supply chains. The solution provides enterprises with real-time visibility into supplier decarbonization progress, helping sustainability teams evaluate supplier alignment with science-based emissions reduction targets. It centralizes supplier climate data, reduces manual tracking, and enables businesses to prioritize engagement with high-impact suppliers. The feature also supports more accurate Scope 3 emissions reporting and strengthens compliance with Australia's mandatory climate disclosure requirements and other global ESG reporting frameworks.
Impact Analysis: The launch is expected to accelerate the adoption of advanced carbon footprint management platforms across Australia by addressing one of the biggest challenges in corporate decarbonization—supplier emissions visibility. Since Scope 3 emissions typically account for the largest share of an organization's carbon footprint, enterprises increasingly require automated tools to monitor supplier climate commitments and ensure regulatory compliance. Avarni's innovation strengthens the shift from basic carbon accounting to AI-driven supply chain emissions management, encouraging competitors to expand similar capabilities. The development is likely to increase investments in digital carbon management solutions, improve ESG data quality, and support Australia's transition toward transparent, audit-ready climate reporting.
2025: Trace ESG Launches Accounting Firm Partnership Program to Expand Carbon Advisory Distribution
In January 2025, Melbourne-based Trace ESG launched its Accounting Firm Partnership Program to help accounting firms integrate carbon accounting and climate advisory services into their existing offerings. The initiative includes a dedicated Carbon Accounting Fellowship, structured training, and white-label access to Trace ESG's carbon management platform. The program enables accounting firms to deliver emissions measurement, ESG reporting, and climate disclosure services without developing in-house carbon expertise. It is designed to meet the growing demand for carbon reporting among Australian SMEs following the introduction of mandatory climate-related disclosure requirements.
Market Impact Analysis: The partnership program is expected to significantly expand the reach of Australia's carbon footprint management market by leveraging accounting firms as trusted distribution channels for carbon accounting solutions. Instead of relying solely on direct enterprise sales, Trace ESG can rapidly penetrate the SME segment through firms that already maintain long-term client relationships. This approach lowers customer acquisition costs while accelerating adoption of carbon management platforms among businesses preparing for mandatory climate disclosures. The initiative also increases competition by encouraging other software providers to establish partner ecosystems, driving greater investment in carbon advisory services, digital ESG reporting, and scalable emissions management solutions across Australia.
2025: Northmore Gordon Partners with Pangolin Associates to Deliver Integrated ASRS Compliance Solution
In August 2025, Northmore Gordon entered a strategic partnership with Pangolin Associates to provide an integrated Australian Sustainability Reporting Standards (ASRS) compliance solution. The collaboration combines Northmore Gordon's expertise in energy optimization, engineering feasibility, and energy certificate funding with Pangolin Associates' capabilities in climate risk assessment, carbon accounting, and net-zero strategy. The joint offering enables organizations to manage emissions measurement, energy efficiency, climate risk analysis, and mandatory ASRS disclosures through a single service provider, simplifying compliance for companies preparing their first climate reporting submissions.
Market Impact Analysis: The partnership strengthens Australia's carbon footprint management market by creating an end-to-end compliance solution that integrates energy engineering, carbon accounting, and climate reporting under one provider. As mandatory ASRS disclosures expand to more businesses, organizations are increasingly seeking comprehensive advisory services instead of managing multiple consultants. This integrated model reduces implementation complexity, improves data consistency, and accelerates regulatory compliance. The collaboration is expected to encourage similar strategic partnerships across the market, intensify competition among sustainability consultants, and drive greater adoption of integrated carbon management and climate disclosure solutions among Australian enterprises.
2025: CEFC and La Caisse Launch USD 250 Million Meldora Agricultural Carbon Platform with Rio Tinto Offtake
On 8 September 2025, the Clean Energy Finance Corporation and Canadian investment group La Caisse launched Meldora, a $250 million agricultural and carbon platform combining sustainable farming with large-scale Environmental Plantings under the Australian Carbon Credit Unit scheme. La Caisse committed $200 million alongside $50 million from the CEFC, with the platform managed by Gunn Agri Partners. Meldora's first acquisition was a broadacre and irrigation farm exceeding 15,000 hectares in Central Queensland, underpinned by a long-term ACCU offtake agreement with mining group Rio Tinto.
Impact Analysis: This transaction signals institutional capital treating carbon credit generation as a distinct, investable asset class rather than a corporate offsetting expense, deepening the supply side of the ACCU market that underpins compliance for Safeguard Mechanism facilities nationally. A long-term offtake agreement of this scale sets a pricing reference point that smaller carbon farming operators are likely to invoke in future negotiations with industrial buyers.
- Market Segmentation
- Introduction
- Product Definition
- Research Process
- Assumptions
- Executive Summary
- Australia Carbon Footprint Management Market Policies, Regulations, and Product Standards
- Australia Carbon Footprint Management Market Trends & Developments
- Australia Carbon Footprint Management Market Dynamics
- Growth Factors
- Challenges
- Australia Carbon Footprint Management Market Hotspot & Opportunities
- Australia Carbon Footprint Management Market Outlook, 2022-2032
- Market Size & Outlook
- By Revenues (USD Million)
- Market Share & Outlook
- By Component- Market Size & Forecast 2022-2032, USD Million
- Solutions
- Services
- Consulting
- Integration & Deployment
- Support & Maintenance
- By Deployment Mode- Market Size & Forecast 2022-2032, USD Million
- Cloud
- On-Premises
- By Organization Size- Market Size & Forecast 2022-2032, USD Million
- Corporate Enterprises
- Mid-Tier Enterprises
- Small Businesses
- By Vertical- Market Size & Forecast 2022-2032, USD Million
- Manufacturing
- Food & Beverages
- Metals & Mining
- Chemical & Materials
- Electronics & Consumer Goods
- Automotive
- Pharmaceutical & Healthcare
- Others
- Energy & Utilities
- Residential & Commercial Buildings
- Transportation & Logistics
- IT & Telecom
- Financial Services
- Government
- Manufacturing
- By Region - Market Size & Forecast 2022-2032, USD Million
- North
- South
- East
- West
- Central
- By Company
- Competition Characteristics
- Market Share & Analysis
- By Component- Market Size & Forecast 2022-2032, USD Million
- Market Size & Outlook
- Australia Solutions Based Carbon Footprint Management Market Outlook, 2022-2032
- Market Size & Outlook
- By Revenues (USD Million)
- Market Share & Outlook
- By Deployment Mode- Market Size & Forecast 2022-2032, USD Million
- By Organization Size- Market Size & Forecast 2022-2032, USD Million
- By Vertical- Market Size & Forecast 2022-2032, USD Million
- By Region - Market Size & Forecast 2022-2032, USD Million
- Market Size & Outlook
- Australia Services Based Carbon Footprint Management Market Outlook, 2022-2032
- Market Size & Outlook
- By Revenues (USD Million)
- Market Share & Outlook
- By Deployment Mode- Market Size & Forecast 2022-2032, USD Million
- By Organization Size- Market Size & Forecast 2022-2032, USD Million
- By Vertical- Market Size & Forecast 2022-2032, USD Million
- By Region - Market Size & Forecast 2022-2032, USD Million
- Market Size & Outlook
- Australia Carbon Footprint Management Market Key Strategic Imperatives for Success & Growth
- Competitive Outlook
- Company Profiles
- Net Nada Pty Ltd
- Business Description
- Product Portfolio
- Collaborations & Alliances
- Recent Developments
- Financial Details
- Others
- Avarni Pty Ltd
- Business Description
- Product Portfolio
- Collaborations & Alliances
- Recent Developments
- Financial Details
- Others
- Carbon Core Pty Ltd
- Business Description
- Product Portfolio
- Collaborations & Alliances
- Recent Developments
- Financial Details
- Others
- Trace ESG Pty Ltd
- Business Description
- Product Portfolio
- Collaborations & Alliances
- Recent Developments
- Financial Details
- Others
- Sumday Pty Ltd
- Business Description
- Product Portfolio
- Collaborations & Alliances
- Recent Developments
- Financial Details
- Others
- Corporate Carbon Group Pty Ltd
- Business Description
- Product Portfolio
- Collaborations & Alliances
- Recent Developments
- Financial Details
- Others
- Northmore Gordon Pty Ltd
- Business Description
- Product Portfolio
- Collaborations & Alliances
- Recent Developments
- Financial Details
- Others
- Pangolin Associates Pty Limited
- Business Description
- Product Portfolio
- Collaborations & Alliances
- Recent Developments
- Financial Details
- Others
- South Pole Australia Pty Ltd
- Business Description
- Product Portfolio
- Collaborations & Alliances
- Recent Developments
- Financial Details
- Others
- EcoAct SAS
- Business Description
- Product Portfolio
- Collaborations & Alliances
- Recent Developments
- Financial Details
- Others
- Net Nada Pty Ltd
- Company Profiles
- Disclaimer

MarkNtel Advisors follows a robust and iterative research methodology designed to ensure maximum accuracy and minimize deviation in market estimates and forecasts. Our approach combines both bottom-up and top-down techniques to effectively segment and quantify various aspects of the market. A consistent feature across all our research reports is data triangulation, which examines the market from three distinct perspectives to validate findings. Key components of our research process include:
1. Scope & Research Design At the outset, MarkNtel Advisors define the research objectives and formulate pertinent questions. This phase involves determining the type of research—qualitative or quantitative—and designing a methodology that outlines data collection methods, target demographics, and analytical tools. They also establish timelines and budgets to ensure the research aligns with client goals.
2. Sample Selection and Data Collection In this stage, the firm identifies the target audience and determines the appropriate sample size to ensure representativeness. They employ various sampling methods, such as random or stratified sampling, based on the research objectives. Data collection is carried out using tools like surveys, interviews, and observations, ensuring the gathered data is reliable and relevant.
3. Data Analysis and Validation Once data is collected, MarkNtel Advisors undertake a rigorous analysis process. This includes cleaning the data to remove inconsistencies, employing statistical software for quantitative analysis, and thematic analysis for qualitative data. Validation steps are taken to ensure the accuracy and reliability of the findings, minimizing biases and errors.

4. Data Forecast and FinalizationThe final phase involves forecasting future market trends based on the analyzed data. MarkNtel Advisors utilize predictive modeling and time series analysis to anticipate market behaviors. The insights are then compiled into comprehensive reports, featuring visual aids like charts and graphs, and include strategic recommendations to inform client decision-making
FILL THE FORM TO GET THE FREE SAMPLE PAGES
We offer flexible licensing options to cater to varying organizational needs. Choose the pricing pack that best suits your requirements:
Buy Now Inquire Before Buying
 Talk to our Consultant
 Request Customization