

By Offering (Water Treatment Chemicals (Coagulants & Flocculants, Corrosion & Scale Inhibitors, Biocides & Disinfectants, pH Control Chemicals, Other Specialty Chemicals), Water Treatment Equipment (F... ... eatment Equipment (Filtration Systems & Separation, Membrane Systems, Disinfection Equipment, Evaporation & ZLD, Sludge Treatment Equipment, Other Treatment Systems), Water Treatment Services (Engineering, Procurement & Construction (EPC), Operations & Maintenance (O&M), Managed Services, Water Testing, Monitoring & Consulting)), By End-Use (Power Generation, Oil & Gas, Chemicals & Petrochemicals, Semiconductor & Electronics, Pharmaceuticals, Food & Beverage, Mining & Metals, Pulp & Paper, Textile) Read more
- Environment
- Sep 2026
- 150
- PDF, Excel, PPT
US Industrial Water Treatment Market Key Takeaways
- The US industrial water treatment market was valued at approximately USD 9.89 billion in 2025 and is projected to grow from USD 10.27 billion in 2026 to USD 12.85 billion by 2032.
- The industry is projected to witness steady growth at a CAGR of 3.8% during 2026–2032.
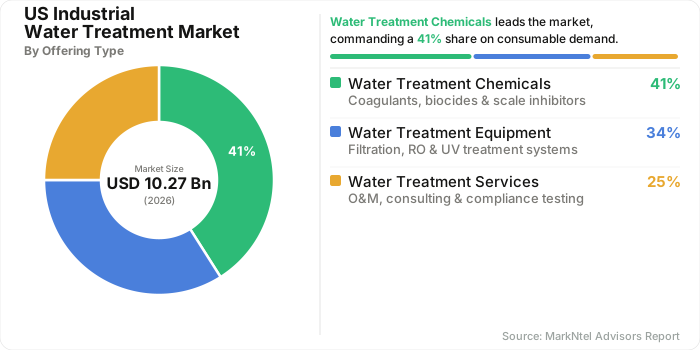
- Water treatment chemicals remain the dominant offering segment, accounting for approximately a 41% share in 2026.
- Power generation leads the end-use segment with an estimated 25% share in 2026.
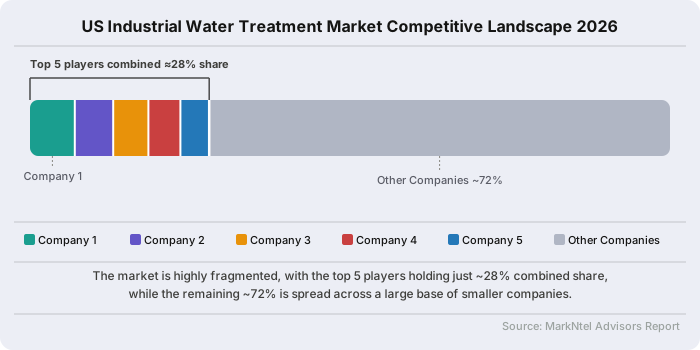
- The market is moderately fragmented, with the top five companies collectively estimated to account for approximately 28% of 2026 market revenue.
US Industrial Water Treatment Market Size and Outlook
The United States industrial water treatment market is estimated at USD 9.89 billion in 2025, increases to USD 10.27 billion in 2026, and reaches approximately USD 12.85 billion by 2032, representing a 3.8% CAGR during 2026–2032.
A major structural demand catalyst is the EPA's Water Reuse Action Plan 2.0, launched on April 16, 2026. EPA explicitly positions water reuse as an enabler for US industry, energy development, semiconductor manufacturing, and the expanding technology sector. The program therefore shifts water treatment from a compliance-only expenditure toward a strategic water-supply and production-continuity function.
The industrial demand base is broad because USGS defines industrial water use across manufacturing activities including fabricating, processing, washing, diluting, cooling, transporting, and sanitation. Its 2026 national data release covers manufacturing facilities classified under NAICS 31–33 and provides a more granular framework for assessing industrial water demand across US production activity.
Near-term demand is reinforced by high-value semiconductor water infrastructure. In May 2025, Veolia Water Technologies disclosed more than USD 750 million of new flagship water-technology contracts, including a USD 550 million, 16-year contract to design, construct, and operate a water and wastewater treatment facility for a US semiconductor manufacturing plant.
US Industrial Water Treatment Market Key Indicators
- As per the US EPA, the April 10, 2024 PFAS National Primary Drinking Water Regulation establishes legally enforceable maximum contaminant levels of 4.0 ppt for PFOA and PFOS, with compliance monitoring beginning April 26, 2027. The regulation strengthens demand for advanced PFAS treatment, monitoring and contaminant-removal technologies across affected water-treatment systems.
- According to the US EPA, its POTW Influent PFAS Study is designed to collect nationwide data on industrial PFAS discharges to publicly owned treatment works, with the agency planning questionnaires for approximately 400 high-flow POTWs and sampling across 200–300 selected facilities. The program increases visibility into industrial PFAS loading and supports potential future pretreatment and industrial wastewater-control requirements.
- According to the US Census Bureau, manufacturing construction spending reaches an annualized USD 235.6 billion in 2024, sustaining investment in new and expanded US manufacturing capacity. This construction pipeline supports additional requirements for process-water treatment, utility-water systems, wastewater treatment, and water-reuse infrastructure.
- As per the US EPA, WRAP 2.0 expands the national water-reuse framework to 76 actions and 200 partners, compared with 37 actions and 86 partners when the initiative launched in 2020. The April 2026 expansion specifically prioritizes water reuse for industry, semiconductor manufacturing, data centers, and energy, strengthening the institutional foundation for industrial water recycling and advanced treatment infrastructure.
US Industrial Water Consumption Analysis
US manufacturing requires water for processing, cooling, cleaning, boiler operations, product incorporation, and sanitation. The latest USGS industrial-water dataset covers NAICS 31–33 manufacturing activities, while EPA identifies manufacturing, food and beverage, microchip production and mineral extraction as key industrial water-use applications. These requirements create recurring demand for industrial water treatment equipment, filtration and process-water conditioning.
Power generation remains a major industrial water-use application, primarily for condenser cooling, steam generation, and plant operations. US electricity generation reached approximately 4,308.6 TWh in 2024, while EIA provides generator-level cooling-water withdrawal and consumption data. USGS research indicates thermoelectric generation accounts for more than 41% of US freshwater withdrawals, supporting recurring demand for cooling-water treatment, filtration, and water quality monitoring systems.
Semiconductor, pharmaceutical, food and beverage manufacturing require water with controlled quality for processing, rinsing, formulation, cleaning and sanitation. EPA reports cleaning can represent 50–70% of total water use at some food, beverage and pharmaceutical facilities. These applications create higher-value demand for membrane filtration, disinfection, high-purity treatment, and real-time water monitoring, where consistent water quality is essential for production reliability and regulatory compliance.
Industrial facilities are increasingly using reclaimed water for cooling and production-related applications to reduce dependence on freshwater. EPA's Water Reuse Action Plan 2.0, launched in April 2026, prioritizes microchip fabrication, data-center cooling, electricity generation, batteries, food and beverage, and automotive manufacturing. More than 745 million gallons of recycled water supplied cooling applications in 2025, supporting demand for advanced treatment, filtration and smart water monitoring.
Consequently, the combination of high-volume water requirements across power generation and manufacturing, increasing high-specification process-water needs in semiconductor and pharmaceutical production, and expanding industrial water reuse across battery, food and beverage, automotive and data-center applications is expected to support continued demand for industrial water treatment systems, advanced purification technologies and water quality monitoring solutions across the US industrial sector.
US Industrial Water Treatment Market Scope
| Category | Segments |
|---|---|
| By Offering | Water Treatment Chemicals (Coagulants & Flocculants, Corrosion & Scale Inhibitors, Biocides & Disinfectants, pH Control Chemicals, Other Specialty Chemicals), Water Treatment Equipment (Filtration Systems & Separation, Membrane Systems, Disinfection Equipment, Evaporation & ZLD, Sludge Treatment Equipment, Other Treatment Systems), Water Treatment Services (Engineering, Procurement & Construction (EPC), Operations & Maintenance (O&M), Managed Services, Water Testing, Monitoring & Consulting |
| By End-Use | Power Generation, Oil & Gas, Chemicals & Petrochemicals, Semiconductor & Electronics, Pharmaceuticals, Food & Beverage, Mining & Metals, Pulp & Paper, Textile |
US Industrial Water Treatment Market Growth Drivers
Rising Industrial Water Demand from Power Generation and Advanced Manufacturing
The expansion of US electricity generation is sustaining demand for industrial water treatment across power-generation facilities, particularly for cooling-water, boiler-water, and process-water applications. According to the US Energy Information Administration (EIA), total US electricity generation reached approximately 4,309 TWh in 2024, while EIA separately maintains detailed 2024 datasets for thermoelectric cooling-water use by generator and boiler. This large operating base supports recurring demand for industrial water treatment equipment, filtration, chemical treatment, water reuse, and monitoring systems required to maintain cooling efficiency and equipment reliability.
At the same time, continued investment across advanced manufacturing is increasing requirements for higher-quality process water. The US Census Bureau reported USD 662.7 billion in new manufactured-goods orders in April 2026, up 4.8% month-on-month, indicating continued production and capacity commitments across the manufacturing sector. Semiconductor, electronics, pharmaceutical, chemical, and other precision industries require tightly controlled process-water quality, increasing adoption of water quality monitoring systems, membrane treatment, high-purity water production, and real-time water monitoring technologies to support production reliability and regulatory compliance.
Recent Trend
Direct-to-Chip Liquid Cooling Accelerates Real-Time Water Quality Monitoring in Data Centers
The rapid expansion of AI computing is increasing the need for advanced cooling and real-time water monitoring across US data centers. According to Ecolab, US data center energy demand is expected to increase from 25 GW in 2024 to more than 80 GW by 2030, increasing thermal loads and accelerating adoption of liquid-cooling architectures. Direct-to-chip systems require tighter control of coolant concentration, temperature, pH, and flow, creating additional demand for continuous water quality monitoring systems rather than periodic manual testing.
Water treatment suppliers are increasingly integrating monitoring, chemistry, equipment, and analytics into unified cooling-management offerings. On November 14, 2025, Ecolab launched its Cooling as a Service (CaaS) program, combining 3D TRASAR Technology for Direct-to-Chip Liquid Cooling with a smart Coolant Distribution Unit (CDU), connected coolant management, and water-management technologies. The system supports continuous coolant-health analytics and monitoring of parameters including glycol concentration and pH, strengthening the convergence of smart water monitoring with high-density thermal management and creating a new recurring application for industrial water treatment providers.
US Industrial Water Treatment Market Opportunities and Challenges
High Compliance Costs Create Opportunities for Advanced Water Reuse and PFAS Treatment Technologies
The rising complexity of industrial wastewater compliance remains a challenge because facilities must increasingly manage contaminants that require specialized treatment, monitoring, and disposal infrastructure. The US EPA's POTW Influent PFAS Study is collecting nationwide data on industrial PFAS discharges and plans to involve approximately 400 POTWs, with 200–300 POTWs expected to participate in sampling covering up to 2,000 industrial users. This expanding monitoring framework increases the technical and financial burden on industrial facilities, particularly those discharging PFAS-containing wastewater, while strengthening demand for PFAS water treatment and advanced pretreatment systems.
At the same time, these compliance requirements create opportunities for suppliers of industrial water reuse and energy-efficient membrane technologies. The EPA identifies industrial reuse applications across manufacturing, microchip production, food and beverage, mineral extraction, energy generation, cooling, and other processes, supporting broader adoption of treated-water recovery systems. DuPont's FilmTec™ nanofiltration portfolio, for example, targets industrial water reuse and resource recovery while reducing energy and operating requirements. These developments expand opportunities for membrane filtration, concentrate reduction, and advanced water-recovery systems as US manufacturers seek to reduce freshwater demand and improve wastewater compliance.
Segmentation Insights
Recurring Chemical Consumption Anchors Leadership Across US Industrial Water Systems
The water treatment chemicals lead industry consumption and account for an estimated 41% revenue share in 2026, supported by the scale of US industrial cooling and process-water operations. The EIA provides 2024 water-cooling data by generator and boiler, confirming the continuing scale of thermoelectric cooling systems requiring chemical conditioning. EPA also identifies cooling, boiler, manufacturing, and energy-generation applications within industrial water reuse, supporting recurring demand for industrial water treatment chemicals across major water-intensive industries.
The segment's dominance is reinforced by continuous treatment requirements rather than periodic capital purchases. EPA's 2025–2026 industrial reuse resources cover manufacturing, microchip production, food and beverage, mining, and energy applications, while state requirements increasingly specify treatment and monitoring parameters for industrial cooling and boiler feed water. California, for example, requires continuous turbidity monitoring for certain industrial cooling reuse applications. This broad operating base sustains recurring demand for water treatment chemicals, including corrosion, scale, and biological-control formulations. By offering type, the industry is segmented into:
- Water Treatment Chemicals
- Water Treatment Equipment
- Water Treatment Services
Power-Sector Water Intensity Makes Generation Facilities the Core Revenue Engine for Industrial Treatment
Power Generation holds the largest market share with an estimated 25% revenue share in 2026, supported by the sector's exceptionally high water-treatment requirements. According to a US Geological Survey (USGS) study reports that thermoelectric power generation accounts for more than 41% of total US freshwater withdrawals, making it the largest water-use sector nationally. Water is primarily required for cooling steam-generation equipment, creating recurring requirements for cooling-water conditioning, corrosion and scale control, filtration, and wastewater treatment.
The demand base is further reinforced by the size of the operating fleet: the USGS National Water Availability Assessment tracks 1,360 water-using, utility-scale thermoelectric plants, while EIA provides dedicated 2024 cooling-water data by generator and boiler. Although thermoelectric water withdrawals and consumption have declined with the transition from once-through to more efficient cooling systems, USGS reports that recirculating cooling can increase consumption, sustaining treatment requirements. This supports continued demand for industrial water treatment, water treatment equipment, and monitoring solutions across power facilities. Based on end user type, the industry is further segmented into:
- Power Generation
- Oil & Gas
- Chemicals & Petrochemicals
- Semiconductor & Electronics
- Pharmaceuticals
- Food & Beverage
- Mining & Metals
- Pulp & Paper
- Textile
- Automotive
- Others
US Industrial Water Treatment Market Competitive Analysis
The US industrial water treatment market is moderately fragmented, with the top five companies estimated to account for approximately 28% of 2026 market revenue. Veolia Environnement S.A., Ecolab Inc., Xylem Inc., SUEZ S.A., and DuPont de Nemours, Inc. represent the leading competitive group.
Top Companies in the US Industrial Water Treatment Industry:
- Veolia Environnement S.A.
- Ecolab Inc.
- Xylem Inc.
- SUEZ S.A.
- DuPont de Nemours, Inc.
- Pentair plc
- Kurita Water Industries Ltd.
- Solenis LLC
- Kemira Oyj
- Aquatech International LLC
US Industrial Water Treatment Industry News and Recent Developments
April 2026: EPA Launches Water Reuse Action Plan 2.0
EPA launched WRAP 2.0 on April 16, 2026, with an explicit focus on water reuse for American industry, energy and the technology sector. The plan identifies data centers and semiconductor manufacturing as priority areas and promotes treated wastewater as a dependable alternative water source. The initiative strengthens the policy environment for advanced industrial treatment and reuse technologies.
Impact Analysis: WRAP 2.0 expands the strategic role of industrial treatment beyond discharge compliance toward water-supply resilience. This supports demand for advanced reuse, membrane, filtration and monitoring systems.
August 2025: Ecolab Agrees to Acquire Ovivo Electronics Ultra-Pure Water Business
Ecolab announced an agreement to acquire Ovivo's Electronics business in August 2025. The transaction adds ultra-pure-water technologies and services for semiconductor manufacturing to Ecolab's existing water, digital and service platform. The combined offering is positioned around circular water management and reduced freshwater use in microelectronics manufacturing.
Impact Analysis: The transaction strengthens Ecolab's position in high-value semiconductor water treatment and increases its ability to combine chemicals, digital monitoring, high-purity treatment and service capabilities.
- Market Segmentation
- Introduction
- Product Definition
- Research Process
- Assumptions
- Executive Summary
- US Industrial Water Treatment Market Policies, Regulations, and Product Standards
- US Industrial Water Treatment Market Trends & Developments
- US Industrial Water Treatment Market Dynamics
- Growth Factors
- Challenges
- US Industrial Water Treatment Market Hotspot & Opportunities
- US Industrial Water Treatment Market Outlook, 2022-2032F
- Market Size & Outlook
- By Revenues (USD Million)
- Market Share & Analysis
- By Offering- Market Size & Forecast 2022-2032, USD Million
- Water Treatment Chemicals
- Coagulants & Flocculants
- Corrosion & Scale Inhibitors
- Biocides & Disinfectants
- pH Control Chemicals
- Other Specialty Chemicals
- Water Treatment Equipment
- Filtration Systems & Separation
- Membrane Systems
- Disinfection Equipment
- Evaporation & ZLD
- Sludge Treatment Equipment
- Other Treatment Systems
- Water Treatment Services
- Engineering, Procurement & Construction (EPC)
- Operations & Maintenance (O&M)
- Managed Services
- Water Testing, Monitoring & Consulting
- Water Treatment Chemicals
- By End-Use- Market Size & Forecast 2022-2032, USD Million
- Power Generation
- Oil & Gas
- Chemicals & Petrochemicals
- Semiconductor & Electronics
- Pharmaceuticals
- Food & Beverage
- Mining & Metals
- Pulp & Paper
- Textile
- Automotive
- Others
- By Company
- Competition Characteristics
- Market Share & Analysis
- By Offering- Market Size & Forecast 2022-2032, USD Million
- Market Size & Outlook
- US Industrial Water Treatment Chemicals Market Outlook, 2022-2032
- Market Size & Outlook
- By Revenues (USD Million)
- Market Segmentation & Analysis
- By End-Use- Market Size & Forecast 2022-2032, USD Million
- Market Size & Outlook
- US Industrial Water Treatment Equipment Market Outlook, 2022-2032
- Market Size & Outlook
- By Revenues (USD Million)
- Market Segmentation & Analysis
- By End-Use- Market Size & Forecast 2022-2032, USD Million
- Market Size & Outlook
- US Industrial Water Treatment Services Market Outlook, 2022-2032
- Market Size & Outlook
- By Revenues (USD Million)
- Market Segmentation & Analysis
- By End-Use- Market Size & Forecast 2022-2032, USD Million
- Market Size & Outlook
- US Industrial Water Treatment Market Key Strategic Imperatives for Success & Growth
- Competitive Outlook
- Company Profiles
- Veolia Environnement S.A.
- Business Description
- Product Portfolio
- Collaborations & Alliances
- Recent Developments
- Financial Details
- Others
- Ecolab Inc.
- Business Description
- Product Portfolio
- Collaborations & Alliances
- Recent Developments
- Financial Details
- Others
- Xylem Inc.
- Business Description
- Product Portfolio
- Collaborations & Alliances
- Recent Developments
- Financial Details
- Others
- SUEZ S.A.
- Business Description
- Product Portfolio
- Collaborations & Alliances
- Recent Developments
- Financial Details
- Others
- DuPont de Nemours, Inc.
- Business Description
- Product Portfolio
- Collaborations & Alliances
- Recent Developments
- Financial Details
- Others
- Pentair plc
- Business Description
- Product Portfolio
- Collaborations & Alliances
- Recent Developments
- Financial Details
- Others
- Kurita Water Industries Ltd.
- Business Description
- Product Portfolio
- Collaborations & Alliances
- Recent Developments
- Financial Details
- Others
- Solenis LLC
- Business Description
- Product Portfolio
- Collaborations & Alliances
- Recent Developments
- Financial Details
- Others
- Kemira Oyj
- Business Description
- Product Portfolio
- Collaborations & Alliances
- Recent Developments
- Financial Details
- Others
- Aquatech International LLC
- Business Description
- Product Portfolio
- Collaborations & Alliances
- Recent Developments
- Financial Details
- Others
- Veolia Environnement S.A.
- Company Profiles
- Disclaimer

MarkNtel Advisors follows a robust and iterative research methodology designed to ensure maximum accuracy and minimize deviation in market estimates and forecasts. Our approach combines both bottom-up and top-down techniques to effectively segment and quantify various aspects of the market. A consistent feature across all our research reports is data triangulation, which examines the market from three distinct perspectives to validate findings. Key components of our research process include:
1. Scope & Research Design At the outset, MarkNtel Advisors define the research objectives and formulate pertinent questions. This phase involves determining the type of research—qualitative or quantitative—and designing a methodology that outlines data collection methods, target demographics, and analytical tools. They also establish timelines and budgets to ensure the research aligns with client goals.
2. Sample Selection and Data Collection In this stage, the firm identifies the target audience and determines the appropriate sample size to ensure representativeness. They employ various sampling methods, such as random or stratified sampling, based on the research objectives. Data collection is carried out using tools like surveys, interviews, and observations, ensuring the gathered data is reliable and relevant.
3. Data Analysis and Validation Once data is collected, MarkNtel Advisors undertake a rigorous analysis process. This includes cleaning the data to remove inconsistencies, employing statistical software for quantitative analysis, and thematic analysis for qualitative data. Validation steps are taken to ensure the accuracy and reliability of the findings, minimizing biases and errors.

4. Data Forecast and FinalizationThe final phase involves forecasting future market trends based on the analyzed data. MarkNtel Advisors utilize predictive modeling and time series analysis to anticipate market behaviors. The insights are then compiled into comprehensive reports, featuring visual aids like charts and graphs, and include strategic recommendations to inform client decision-making
We’d love to understand what matters most to you.