

By Fuel Type (E-Diesel, E-Gasoline, E-Kerosene, E-Methanol, E-Methane, Others), By Physical State (Liquid, Gas), By Application (Automotive, Marine, Industrial, Railway, Aviation, Others), and others ... Others), and others Read more
- Energy
- Sep 2026
- 340
- PDF, Excel, PPT
E-Fuels Market Key Takeaways
- The global e-fuel market was valued at USD 7.39 billion in 2025 and is projected to reach USD 32.29 billion by 2032.
- The industry is projected to witness steady growth at a 21% CAGR during 2026–2032.
- Power-to-Liquid (PtL) accounted for approximately 46% of the global market in 2026.
- E-Kerosene accounted for approximately 68% of the global market by fuel type in 2026.
- Europe accounted for approximately 45% of the global market in 2026.
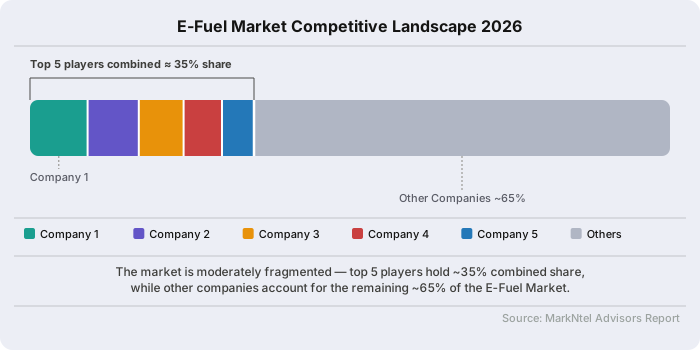
- The global market remains moderately fragmented, with the top five holding approximately 35% combined market share.
E-Fuels Market Size and Outlook
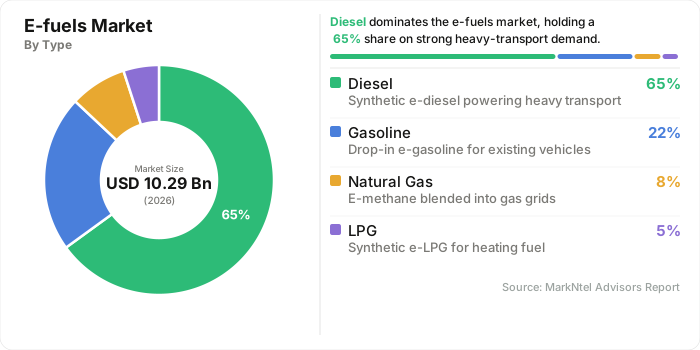
The global e-fuel market was valued at USD 7.39 billion in 2025 and is projected to reach USD 32.29 billion by 2032 from USD 10.29 billion in 2026, expanding at a 21% CAGR during 2026–2032.
The global e-fuels market is entering an early commercialization phase, supported by investments in renewable electricity generation, electrolyzers, green hydrogen production, CO₂ capture and Power-to-X facilities. The market is expected to expand as these energy projects move from pilot and feasibility stages toward commercial-scale production. In 2025, global installed water-electrolysis capacity more than doubled to over 4 GW, while another 2.5 GW of electrolyzer capacity was under construction and targeted for operation in 2026. This expanding hydrogen-production base is important for e-fuels because hydrogen is a key input for producing e-methanol, e-ammonia and synthetic liquid fuels.
Investment is also increasing across the broader low-emissions hydrogen value chain. Global capital spending on low-emissions hydrogen projects reached USD 4.3 billion in 2024, representing an 80% increase from 2023, while spending was expected to approach USD 8 billion in 2025 based on recent final investment decisions. Electrolysis was expected to account for around 80% of this spending, strengthening the infrastructure required for hydrogen-based fuel production.
Demand is particularly emerging from aviation and maritime transport, where direct electrification remains difficult. The IEA expects renewable hydrogen and e-fuel use in transport to reach 0.17 EJ by 2030, although e-fuels will remain a relatively small part of total renewable transport fuel consumption. In aviation, the EU's ReFuelEU Aviation regulation requires synthetic aviation fuels to reach 1.2% of fuel supplied at EU airports by 2030, increasing to 35% by 2050, creating a long-term demand signal for e-kerosene projects.
However, market expansion remains dependent on project financing, renewable power availability, electrolyzer deployment, CO₂ infrastructure, offtake agreements and supportive regulations. Consequently, the market outlook is positive, but actual e-fuel production capacity will depend on how quickly announced Power-to-X projects reach final investment decisions and commissioning.
E-Fuels Market Key Indicators
- The European Commission confirmed in December 2025 that Refuel EU Aviation will require e-kerosene to account for 1.2% of EU airport jet fuel demand by 2030, rising to 35% by 2050. Supported by the USD 585 million. Early Movers’ Coalition and the EU’s planned 2026 e-fuel auction, these mandates are strengthening demand visibility for producers and shifting e-fuel projects toward more predictable revenue opportunities.
- India is strengthening the feedstock base for e-fuel production through expanding green hydrogen capacity. In May 2025, the Ministry of New and Renewable Energy confirmed that 19 firms had been allocated 862,000 tonnes of annual capacity, against the National Green Hydrogen Mission’s 5 million-ton 2030 target. This capacity expansion supports competitive e-fuel production and export opportunities.
- California’s Air Resources Board strengthened the Low Carbon Fuel Standard by targeting a 30% reduction in transportation fuel carbon intensity by 2030, effective July 2025. The tighter standard increases compliance pressure on conventional fuels while improving the potential credit value of low-carbon e-fuels. This policy shift strengthens revenue incentives and supports greater adoption of e-fuels in California’s transportation sector.
- The U.S. Treasury’s Section 45Z Clean Fuel Production Credit, effective from 2025 through 2029, provides tax incentives based on a fuel’s carbon intensity under the 45ZCF-GREET framework. By linking credit value to emissions performance, the policy improves project economics for low-carbon e-fuels and provides greater revenue visibility, reducing exposure to crude oil price volatility.
E-Fuels Market Scope
| Category | Segments |
|---|---|
| By Fuel Type | E-Diesel, E-Gasoline, E-Kerosene, E-Methanol, E-Methane, Others |
| By Physical State | Liquid, Gas |
| By Application | Automotive, Marine, Industrial, Railway, Aviation, Others |
E-Fuels Market Growth Drivers
Reducing Fossil Fuel Import Dependency Accelerating E-Fuel Adoption
High fossil-fuel import dependence is strengthening the strategic case for domestically produced e-fuels, particularly in energy-importing economies. Japan imports around 90% of its total energy supply and more than 90% of its crude oil from the Middle East, exposing transport fuel costs to geopolitical disruptions and crude-price volatility. Japan also spent more than USD 56.3 billion on crude oil imports in 2025, increasing the economic incentive to develop domestically produced synthetic fuels using renewable electricity and green hydrogen.
Germany is pursuing a similar import-substitution pathway through tighter fuel decarbonization requirements. Fuel suppliers must reduce greenhouse-gas emissions by 25% from 2010 levels by 2030, creating additional demand for renewable fuels of non-biological origin (RFNBOs), including e-fuels. By converting domestically generated renewable electricity into transport fuels, countries can diversify fuel supply while reducing exposure to concentrated crude-oil supply chains. This combination of energy-security spending, import exposure, and mandatory fuel decarbonization is creating a structural demand base for e-fuels beyond purely climate-driven adoption.
Recent Trends
Growing Shift Toward Modular and Containerized Power-to-Liquid Production Units
E-fuel producers are increasingly adopting modular and containerized power-to-liquid (PtL) systems to reduce project complexity, shorten deployment timelines, and replicate production capacity across locations. INERATEC inaugurated ERA ONE in Frankfurt-Höchst in June 2025, with capacity to produce up to 2,500 tonnes of e-fuels annually from biogenic CO₂ and green hydrogen. The project was supported by a USD 80.98 million funding package from the European Investment Bank and Breakthrough Energy.
This modular approach expanded in March 2026 with INERATEC’s “Lifeline” containerized PtL units, each designed to produce an estimated 4,000–7,000 tonnes of e-fuels annually. These units can be deployed within the company’s Giga PtX network, allowing capacity to be added incrementally rather than through a single large-scale facility.
The same scale-up model is emerging in e-methanol. Denmark’s Kassø e-methanol facility began operations in 2025, supplying renewable methanol to shipping and chemical applications. As PtL technologies, catalysts, and reactor designs become increasingly standardized, serial deployment of modular units is expected to accelerate capacity additions, reducing the time and capital intensity associated with large centralized e-fuel projects.
E-Fuels Market Opportunities & Challenges
High E-Fuel Production Costs Creating Commercial Challenges While Falling Input Costs and Project Scale-Up Open First-Mover Opportunities
E-fuel production remains capital- and energy-intensive because electrolysis, carbon capture, and fuel synthesis require substantial investment and electricity. The IEA estimates that e-kerosene could fall to around USD 2,150 per tonne by the end of the decade, but still remain 2–3 times more expensive than fossil jet fuel, making long-term e-fuel offtake and project financing difficult. Electrolyzer costs also remain high, with installed systems outside China generally costing around USD 2,000–2,450/kW, according to the IEA.
However, falling renewable-power costs and successful project financing are beginning to address this cost barrier and create first-mover opportunities. In 2024, global solar PV costs averaged USD 0.043/kWh, 41% below the cheapest fossil alternative, while 91% of new utility-scale renewable capacity was cheaper than new fossil generation, improving the economics of renewable hydrogen production.
In March 2025, INERATEC secured USD 81.05 million to finance its Frankfurt ERA ONE plant, enabling commercial production of up to 2,500 tonnes of e-fuels annually and demonstrating that financing can move e-fuel projects beyond pilot scale. In May 2025, Infinium's Project Roadrunner in Texas reached FID and entered construction, targeting 23,000 tonnes annually of eSAF and other e-fuels by 2027, supported by renewable power and airline offtake agreements. Meanwhile, China leads electrolyzer manufacturing and deployment, helping drive technology scale and cost competitiveness globally. Together, these developments indicate that producers securing low-cost renewable electricity, electrolyzers, financing, and production capacity early can benefit as e-fuel costs decline through the early 2030s.
Segmentation Insights
E-Kerosene Captures 68% Market Share as Capacity Expansion and SAF Mandates Drive Demand
Driven by recurring aviation demand, new production capacity, and policy-driven procurement. Repsol, Petronor and Saudi Aramco’s Bilbao plant combines a 10 MW electrolyser with captured CO₂ and is designed for 8,000 litres/day of synthetic fuels, its port location can strengthen intra-European e-fuel logistics and future cross-border distribution.
Infinium’s Project Roadrunner in Texas, with planned capacity of 23,000 tonnes/year, secured a 10-year IAG offtake for 7,500 tonnes/year, linking new capacity directly with future international aviation-fuel demand. UK regulatory compliance will further support demand through the SAF Mandate’s PtL obligation from 2028, increasing to 3.5% of jet-fuel demand by 2040, encouraging suppliers to secure e-kerosene volumes and potentially increasing imports where domestic production is insufficient.
Singapore’s SAF levy, originally planned for tickets sold from April 2026, targets 1% SAF uplift, rising to 3–5% by 2030; following a 2026 deferment, the 1% target is now expected from 2027, creating another regional procurement pool for SAF suppliers. Together, these projects and mandates expand production, create contracted demand, strengthen cross-border fuel flows, and support e-kerosene’s dominant position. By fuel type the market is further segmented into the following sub-categories:
- E-Diesel
- E-Gasoline
- E-Kerosene
- E-Methanol
- E-Methane
- Others
Power-to-Liquid Drives the Shift Toward Scalable E-Fuel Production with 46% share
The advantage comes from producing liquid hydrocarbons that can be used across existing aviation and marine fuel infrastructure, giving power-to-liquid a broader immediate end-use market than gas-based alternatives. Technology deployment is moving beyond small demonstrations, for instance, Topsoe and Sasol's G2L process was selected in 2025 for Europe's largest e-fuels demonstration plant at Leuna, Germany, designed to produce 2,500 tonnes per year. Commercial-scale projects are also emerging across multiple regions. Elyse Energy secured USD 138.93 million for its Lacq project in France, targeting 82,000 tonnes of SAF and 200,000 tonnes of e-methanol annually, while Synkero began construction of a 50,000-tonne-per-year kerosene plant in Amsterdam.
In Chile, HIF Global's Haru Oni received ISCC EU RFNBO certification, supporting EU-compliant exports, while its Tasmania project completed pre-FEED engineering for a 210,000-tonne e-methanol facility with a 280 MW electrolyser. Together, these investments, certifications, and engineering milestones show PtL progressing from demonstration projects toward commercial-scale production, strengthening its position as the leading e-fuel production route. By production process the market is further segmented into the following sub-categories:
- Power-to-Liquid
- Power-to-Gas
- Gas-to-Liquid
- Biologically Derived Fuels
E-Fuels Market Geographical Analysis
Europe holds approximately 45% of the global e-fuels market, supported by regulatory mandates, expanding production infrastructure, and growing access to renewable hydrogen. The ReFuelEU Aviation Regulation established a 2% SAF blending requirement from 2025, rising to 6% by 2030, while synthetic aviation fuels specifically must reach 1.2% by 2030. This regulatory demand is stimulating project development, with more than 40 eSAF projects awaiting final investment decisions across Europe.
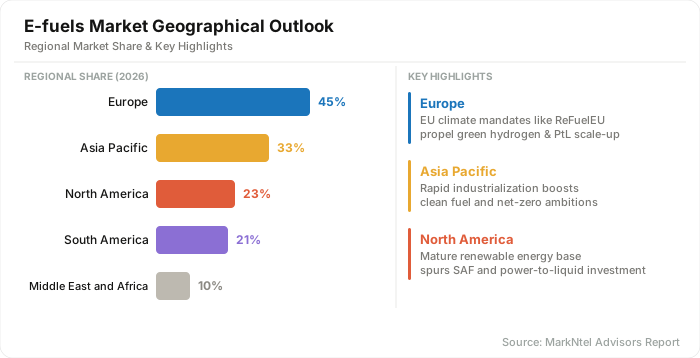
On the supply side, European electrolyser manufacturers reached 13.1 GW of annual production capacity in 2025, strengthening domestic access to hydrogen-production equipment. Germany further reinforces regional demand through its national PtL quota, requiring 0.5% e-SAF in 2026, 1% in 2028, and 2% in 2030, although the policy remains subject to potential changes.
Norway is also advancing large-scale capacity through Norsk e-Fuel's Mosjøen project, designed to produce 50 million litres of e-Crude annually, with up to 80% potentially upgraded into SAF. In April 2026, Boeing expanded its involvement in the project through operational collaboration. Meanwhile, in May 2026, India and the Netherlands launched a Green Hydrogen Roadmap and agreed to develop a renewable-hydrogen corridor, potentially linking India's production capacity with European markets and strengthening future feedstock availability for European e-fuel producers.
E-Fuels Market Competitive Landscape
The global e-fuels market is moderately fragmented, with established energy companies and specialized technology developers competing through large-scale projects, partnerships, and technology deployment. Among the listed companies, Saudi Aramco, Repsol, HIF Global, Sunfire, and Shell represent the leading players, with the top five holding approximately 35% combined market share.
Major Players in the E-fuels market
- Saudi Arabian Oil Co. (Saudi Aramco)
- AUDI AG
- Repsol
- Sunfire SE
- Electrochaea GmbH
- Uniper SE
- Ørsted A/S
- Yara
- Perstorp
- HIF Global
- INFINIUM
- Electrochaea GmbH
- Siemens Energy
- Shell
- TotalEnergies
- Others
E-Fuels Market News and Recent Developments
May 2025: European Energy and Mitsui Inaugurate Large-Scale Commercial E-Methanol Facility in Denmark
European Energy and Mitsui inaugurated the Kassø e-methanol facility in Aabenraa, Denmark, on May 13, 2025. The plant produces 42,000 tonnes annually and integrates renewable power from the adjacent 304 MW Kassø Solar Park with carbon capture and utilisation, reducing emissions by up to 97% versus fossil-based methanol.
Impact Analysis: The facility demonstrates commercial-scale e-methanol production and provides certified supply to A.P. Moller-Maersk, LEGO Group, and Novo Nordisk, strengthening Europe’s distribution base for renewable methanol across shipping and industrial applications.
July 2025: China State Shipbuilding Corporation Advances USD 584 Million Green Methanol Project in Heilongjiang
Construction began in 2025 on a $584 million wind-hydrogen-storage-methanol project in Shuangyashan, Heilongjiang, developed by China State Shipbuilding Corporation and partners. The facility is designed to produce 119,000 tonnes of e-methanol annually using wind-powered electrolysis and biomass-derived CO2.
Impact Analysis: The project expands China’s large-scale e-methanol capacity and strengthens its northeastern production base. Its integration with wind power supports lower-cost synthetic methanol production while increasing domestic supply potential for China’s growing methanol-fueled shipping sector.
September 2025: HIF Global Selects Electric Hydrogen for Texas E-Fuels Facility
HIF Global selected Electric Hydrogen on September 16, 2025, to supply electrolyzer systems for its Texas e-fuels facility, which is expected to produce approximately 200 million gallons annually. The fuel is intended to decarbonize more than 400,000 vehicles. HIF is also developing facilities across the United States, Uruguay, Chile, Brazil, and Australia, while its Haru Oni plant in Chile remains operational.
Impact Analysis: The partnership strengthens HIF’s commercial-scale project pipeline and demonstrates the role of specialized electrolyzer suppliers in expanding e-fuels production across multiple geographic markets.
2026: Twelve Opens AirPlant One, First Commercial-Scale E-Jet Fuel Facility in the United States
Twelve opened AirPlant One in Moses Lake, Washington, on June 10, 2026, producing approximately 50,000 gallons of E-Jet SAF annually from CO2, water, and renewable electricity, alongside E-Naphtha. Alaska Star Ventures participated in Twelve’s $645 million funding round, while Microsoft supported the scale-up through its Climate Innovation Fund and a SAF offtake agreement.
Impact Analysis: The facility establishes a US commercial e-jet fuel supply chain and demonstrates an offtake-backed model that could support financing and replication of future PtL projects.
- Market Segmentation
- Introduction
- Product Definition
- Research Process
- Assumptions
- Executive Summary
- E-fuels Market Policies, Regulations, and Product Standards
- E-fuels Market Trends & Developments
- E-fuels Market Dynamics
- Growth Factors
- Challenges
- E-fuels Market Hotspot & Opportunities
- E-fuels Market Outlook, 2022-2032
- Market Size & Outlook
- By Revenues (USD Million)
- Market Share & Analysis
- By Fuel Type- Market Size & Forecast 2022-2032, USD Million
- E-Diesel
- E-Gasoline
- E-Kerosene
- E-Methanol
- E-Methane
- Others
- By Physical State- Market Size & Forecast 2022-2032, USD Million
- Liquid
- Gas
- By Application- Market Size & Forecast 2022-2032, USD Million
- Automotive
- Marine
- Industrial
- Railway
- Aviation
- Others
- By Region
- North America
- Europe
- Asia Pacific
- Latin America
- Middle East & Africa
- By Company
- Competition Characteristics
- Market Share & Analysis
- By Fuel Type- Market Size & Forecast 2022-2032, USD Million
- Market Size & Outlook
- North America E-fuels Market Outlook, 2022-2032
- Market Size & Outlook
- By Revenues (USD Million)
- Market Share & Analysis
- By fuel type- Market Size & Forecast 2022-2032, USD Million
- By State- Market Size & Forecast 2022-2032, USD Million
- By Production Method- Market Size & Forecast 2022-2032, USD Million
- By application- Market Size & Forecast 2022-2032, USD Million
- By Country
- The US
- Canada
- Mexico
- The US E-fuels Market Outlook, 2022-2032
- Market Size & Outlook
- By Revenues (USD Million)
- Market Share & Analysis
- By fuel type- Market Size & Forecast 2022-2032, USD Million
- By State- Market Size & Forecast 2022-2032, USD Million
- By Production Method- Market Size & Forecast 2022-2032, USD Million
- By application- Market Size & Forecast 2022-2032, USD Million
- Market Size & Outlook
- Canada E-fuels Market Outlook, 2022-2032
- Market Size & Outlook
- By Revenues (USD Million)
- Market Share & Analysis
- By fuel type- Market Size & Forecast 2022-2032, USD Million
- By State- Market Size & Forecast 2022-2032, USD Million
- By Production Method- Market Size & Forecast 2022-2032, USD Million
- By application- Market Size & Forecast 2022-2032, USD Million
- Market Size & Outlook
- Market Size & Outlook
- Europe E-fuels Market Outlook, 2022-2032
- Market Size & Outlook
- By Revenues (USD Million)
- Market Share & Analysis
- By fuel type- Market Size & Forecast 2022-2032, USD Million
- By State- Market Size & Forecast 2022-2032, USD Million
- By Production Method- Market Size & Forecast 2022-2032, USD Million
- By application- Market Size & Forecast 2022-2032, USD Million
- By Country
- Brazil
- Argentina
- Chile
- Colombia
- Peru
- Ecuador
- Rest of South America
- Brazil E-fuels Market Outlook, 2022-2032
- Market Size & Outlook
- By Revenues (USD Million)
- Market Share & Analysis
- By fuel type- Market Size & Forecast 2022-2032, USD Million
- By State- Market Size & Forecast 2022-2032, USD Million
- By Production Method- Market Size & Forecast 2022-2032, USD Million
- By application- Market Size & Forecast 2022-2032, USD Million
- Market Size & Outlook
- Argentina E-fuels Market Outlook, 2022-2032
- Market Size & Outlook
- By Revenues (USD Million)
- Market Share & Analysis
- By fuel type- Market Size & Forecast 2022-2032, USD Million
- By State- Market Size & Forecast 2022-2032, USD Million
- By Production Method- Market Size & Forecast 2022-2032, USD Million
- By application- Market Size & Forecast 2022-2032, USD Million
- Market Size & Outlook
- Chile E-fuels Market Outlook, 2022-2032
- Market Size & Outlook
- By Revenues (USD Million)
- Market Share & Analysis
- By fuel type- Market Size & Forecast 2022-2032, USD Million
- By State- Market Size & Forecast 2022-2032, USD Million
- By Production Method- Market Size & Forecast 2022-2032, USD Million
- By application- Market Size & Forecast 2022-2032, USD Million
- Market Size & Outlook
- Colombia E-fuels Market Outlook, 2022-2032
- Market Size & Outlook
- By Revenues (USD Million)
- Market Share & Analysis
- By fuel type- Market Size & Forecast 2022-2032, USD Million
- By State- Market Size & Forecast 2022-2032, USD Million
- By Production Method- Market Size & Forecast 2022-2032, USD Million
- By application- Market Size & Forecast 2022-2032, USD Million
- Market Size & Outlook
- Peru E-fuels Market Outlook, 2022-2032
- Market Size & Outlook
- By Revenues (USD Million)
- Market Share & Analysis
- By fuel type- Market Size & Forecast 2022-2032, USD Million
- By State- Market Size & Forecast 2022-2032, USD Million
- By Production Method- Market Size & Forecast 2022-2032, USD Million
- By application- Market Size & Forecast 2022-2032, USD Million
- Market Size & Outlook
- Ecuador E-fuels Market Outlook, 2022-2032
- Market Size & Outlook
- By Revenues (USD Million)
- Market Share & Analysis
- By fuel type- Market Size & Forecast 2022-2032, USD Million
- By State- Market Size & Forecast 2022-2032, USD Million
- By Production Method- Market Size & Forecast 2022-2032, USD Million
- By application- Market Size & Forecast 2022-2032, USD Million
- Market Size & Outlook
- Market Size & Outlook
- Asia Pacific E-fuels Market Outlook, 2022-2032
- Market Size & Outlook
- By Revenues (USD Million)
- Market Share & Analysis
- By fuel type- Market Size & Forecast 2022-2032, USD Million
- By State- Market Size & Forecast 2022-2032, USD Million
- By Production Method- Market Size & Forecast 2022-2032, USD Million
- By application- Market Size & Forecast 2022-2032, USD Million
- By Country
- The UK
- Germany
- France
- Italy
- Spain
- Benelux
- Rest of Europe
- The UK E-fuels Market Outlook, 2022-2032
- Market Size & Outlook
- By Revenues (USD Million)
- Market Share & Analysis
- By fuel type- Market Size & Forecast 2022-2032, USD Million
- By State- Market Size & Forecast 2022-2032, USD Million
- By Production Method- Market Size & Forecast 2022-2032, USD Million
- By application- Market Size & Forecast 2022-2032, USD Million
- Market Size & Outlook
- Germany E-fuels Market Outlook, 2022-2032
- Market Size & Outlook
- By Revenues (USD Million)
- Market Share & Analysis
- By fuel type- Market Size & Forecast 2022-2032, USD Million
- By State- Market Size & Forecast 2022-2032, USD Million
- By Production Method- Market Size & Forecast 2022-2032, USD Million
- By application- Market Size & Forecast 2022-2032, USD Million
- Market Size & Outlook
- France E-fuels Market Outlook, 2022-2032
- Market Size & Outlook
- By Revenues (USD Million)
- Market Share & Analysis
- By fuel type- Market Size & Forecast 2022-2032, USD Million
- By State- Market Size & Forecast 2022-2032, USD Million
- By Production Method- Market Size & Forecast 2022-2032, USD Million
- By application- Market Size & Forecast 2022-2032, USD Million
- Market Size & Outlook
- Italy E-fuels Market Outlook, 2022-2032
- Market Size & Outlook
- By Revenues (USD Million)
- Market Share & Analysis
- By fuel type- Market Size & Forecast 2022-2032, USD Million
- By State- Market Size & Forecast 2022-2032, USD Million
- By Production Method- Market Size & Forecast 2022-2032, USD Million
- By application- Market Size & Forecast 2022-2032, USD Million
- Market Size & Outlook
- Spain E-fuels Market Outlook, 2022-2032
- Market Size & Outlook
- By Revenues (USD Million)
- Market Share & Analysis
- By fuel type- Market Size & Forecast 2022-2032, USD Million
- By State- Market Size & Forecast 2022-2032, USD Million
- By Production Method- Market Size & Forecast 2022-2032, USD Million
- By application- Market Size & Forecast 2022-2032, USD Million
- Market Size & Outlook
- Benelux E-fuels Market Outlook, 2022-2032
- Market Size & Outlook
- By Revenues (USD Million)
- Market Share & Analysis
- By fuel type- Market Size & Forecast 2022-2032, USD Million
- By State- Market Size & Forecast 2022-2032, USD Million
- By Production Method- Market Size & Forecast 2022-2032, USD Million
- By application- Market Size & Forecast 2022-2032, USD Million
- Market Size & Outlook
- Market Size & Outlook
- South America E-fuels Market Outlook, 2022-2032
- Market Size & Outlook
- By Revenues (USD Million)
- Market Share & Analysis
- By fuel type- Market Size & Forecast 2022-2032, USD Million
- By State- Market Size & Forecast 2022-2032, USD Million
- By Production Method- Market Size & Forecast 2022-2032, USD Million
- By application- Market Size & Forecast 2022-2032, USD Million
- By Country
- Saudi Arabia
- The UAE
- South Africa
- Egypt
- Qatar
- Kuwait
- Oman
- Nigeria
- Saudi Arabia E-fuels Market Outlook, 2022-2032
- Market Size & Outlook
- By Revenues (USD Million)
- Market Share & Analysis
- By fuel type- Market Size & Forecast 2022-2032, USD Million
- By State- Market Size & Forecast 2022-2032, USD Million
- By Production Method- Market Size & Forecast 2022-2032, USD Million
- By application- Market Size & Forecast 2022-2032, USD Million
- Market Size & Outlook
- The UAE E-fuels Market Outlook, 2022-2032
- Market Size & Outlook
- By Revenues (USD Million)
- Market Share & Analysis
- By fuel type- Market Size & Forecast 2022-2032, USD Million
- By State- Market Size & Forecast 2022-2032, USD Million
- By Production Method- Market Size & Forecast 2022-2032, USD Million
- By application- Market Size & Forecast 2022-2032, USD Million
- Market Size & Outlook
- South Africa E-fuels Market Outlook, 2022-2032
- Market Size & Outlook
- By Revenues (USD Million)
- Market Share & Analysis
- By fuel type- Market Size & Forecast 2022-2032, USD Million
- By State- Market Size & Forecast 2022-2032, USD Million
- By Production Method- Market Size & Forecast 2022-2032, USD Million
- By application- Market Size & Forecast 2022-2032, USD Million
- Market Size & Outlook
- Egypt E-fuels Market Outlook, 2022-2032
- Market Size & Outlook
- By Revenues (USD Million)
- Market Share & Analysis
- By fuel type- Market Size & Forecast 2022-2032, USD Million
- By State- Market Size & Forecast 2022-2032, USD Million
- By Production Method- Market Size & Forecast 2022-2032, USD Million
- By application- Market Size & Forecast 2022-2032, USD Million
- Market Size & Outlook
- Qatar E-fuels Market Outlook, 2022-2032
- Market Size & Outlook
- By Revenues (USD Million)
- Market Share & Analysis
- By fuel type- Market Size & Forecast 2022-2032, USD Million
- By State- Market Size & Forecast 2022-2032, USD Million
- By Production Method- Market Size & Forecast 2022-2032, USD Million
- By application- Market Size & Forecast 2022-2032, USD Million
- Market Size & Outlook
- Kuwait E-fuels Market Outlook, 2022-2032
- Market Size & Outlook
- By Revenues (USD Million)
- Market Share & Analysis
- By fuel type- Market Size & Forecast 2022-2032, USD Million
- By State- Market Size & Forecast 2022-2032, USD Million
- By Production Method- Market Size & Forecast 2022-2032, USD Million
- By application- Market Size & Forecast 2022-2032, USD Million
- Market Size & Outlook
- Oman E-fuels Market Outlook, 2022-2032
- Market Size & Outlook
- By Revenues (USD Million)
- Market Share & Analysis
- By fuel type- Market Size & Forecast 2022-2032, USD Million
- By State- Market Size & Forecast 2022-2032, USD Million
- By Production Method- Market Size & Forecast 2022-2032, USD Million
- By application- Market Size & Forecast 2022-2032, USD Million
- Market Size & Outlook
- Market Size & Outlook
- Middle East & Africa E-fuels Market Outlook, 2022-2032
- Market Size & Outlook
- By Revenues (USD Million)
- Market Share & Analysis
- By fuel type- Market Size & Forecast 2022-2032, USD Million
- By State- Market Size & Forecast 2022-2032, USD Million
- By Production Method- Market Size & Forecast 2022-2032, USD Million
- By application- Market Size & Forecast 2022-2032, USD Million
- By Country
- China
- Japan
- India
- South Korea
- Australia
- Indonesia
- Thailand
- Vietnam
- New Zealand
- Rest of Asia-Pacific
- China E-fuels Market Outlook, 2022-2032
- Market Size & Outlook
- By Revenues (USD Million)
- Market Share & Analysis
- By fuel type- Market Size & Forecast 2022-2032, USD Million
- By State- Market Size & Forecast 2022-2032, USD Million
- By Production Method- Market Size & Forecast 2022-2032, USD Million
- By application- Market Size & Forecast 2022-2032, USD Million
- Market Size & Outlook
- Japan E-fuels Market Outlook, 2022-2032
- Market Size & Outlook
- By Revenues (USD Million)
- Market Share & Analysis
- By fuel type- Market Size & Forecast 2022-2032, USD Million
- By State- Market Size & Forecast 2022-2032, USD Million
- By Production Method- Market Size & Forecast 2022-2032, USD Million
- By application- Market Size & Forecast 2022-2032, USD Million
- Market Size & Outlook
- India E-fuels Market Outlook, 2022-2032
- Market Size & Outlook
- By Revenues (USD Million)
- Market Share & Analysis
- By fuel type- Market Size & Forecast 2022-2032, USD Million
- By State- Market Size & Forecast 2022-2032, USD Million
- By Production Method- Market Size & Forecast 2022-2032, USD Million
- By application- Market Size & Forecast 2022-2032, USD Million
- Market Size & Outlook
- South Korea E-fuels Market Outlook, 2022-2032
- Market Size & Outlook
- By Revenues (USD Million)
- Market Share & Analysis
- By fuel type- Market Size & Forecast 2022-2032, USD Million
- By State- Market Size & Forecast 2022-2032, USD Million
- By Production Method- Market Size & Forecast 2022-2032, USD Million
- By application- Market Size & Forecast 2022-2032, USD Million
- Market Size & Outlook
- Australia E-fuels Market Outlook, 2022-2032
- Market Size & Outlook
- By Revenues (USD Million)
- Market Share & Analysis
- By fuel type- Market Size & Forecast 2022-2032, USD Million
- By State- Market Size & Forecast 2022-2032, USD Million
- By Production Method- Market Size & Forecast 2022-2032, USD Million
- By application- Market Size & Forecast 2022-2032, USD Million
- Market Size & Outlook
- Indonesia E-fuels Market Outlook, 2022-2032
- Market Size & Outlook
- By Revenues (USD Million)
- Market Share & Analysis
- By fuel type- Market Size & Forecast 2022-2032, USD Million
- By State- Market Size & Forecast 2022-2032, USD Million
- By Production Method- Market Size & Forecast 2022-2032, USD Million
- By application- Market Size & Forecast 2022-2032, USD Million
- Market Size & Outlook
- Thailand E-fuels Market Outlook, 2022-2032
- Market Size & Outlook
- By Revenues (USD Million)
- Market Share & Analysis
- By fuel type- Market Size & Forecast 2022-2032, USD Million
- By State- Market Size & Forecast 2022-2032, USD Million
- By Production Method- Market Size & Forecast 2022-2032, USD Million
- By application- Market Size & Forecast 2022-2032, USD Million
- Market Size & Outlook
- Vietnam E-fuels Market Outlook, 2022-2032
- Market Size & Outlook
- By Revenues (USD Million)
- Market Share & Analysis
- By fuel type- Market Size & Forecast 2022-2032, USD Million
- By State- Market Size & Forecast 2022-2032, USD Million
- By Production Method- Market Size & Forecast 2022-2032, USD Million
- By application- Market Size & Forecast 2022-2032, USD Million
- Market Size & Outlook
- New Zealand E-fuels Market Outlook, 2022-2032
- Market Size & Outlook
- By Revenues (USD Million)
- Market Share & Analysis
- By fuel type- Market Size & Forecast 2022-2032, USD Million
- By State- Market Size & Forecast 2022-2032, USD Million
- By Production Method- Market Size & Forecast 2022-2032, USD Million
- By application- Market Size & Forecast 2022-2032, USD Million
- Market Size & Outlook
- Market Size & Outlook
- E-fuels Market Key Strategic Imperatives for Success & Growth
- Competitive Outlook
- Company Profiles
- Saudi Arabian Oil Co. (Saudi Aramco)
- Business Description
- Product Portfolio
- Collaborations & Alliances
- Recent Developments
- Financial Details
- Others
- AUDI AG
- Business Description
- Product Portfolio
- Collaborations & Alliances
- Recent Developments
- Financial Details
- Others
- Repsol
- Business Description
- Product Portfolio
- Collaborations & Alliances
- Recent Developments
- Financial Details
- Others
- Sunfire SE
- Business Description
- Product Portfolio
- Collaborations & Alliances
- Recent Developments
- Financial Details
- Others
- Electrochaea GmbH
- Business Description
- Product Portfolio
- Collaborations & Alliances
- Recent Developments
- Financial Details
- Others
- Uniper SE
- Business Description
- Product Portfolio
- Collaborations & Alliances
- Recent Developments
- Financial Details
- Others
- Ørsted A/S
- Business Description
- Product Portfolio
- Collaborations & Alliances
- Recent Developments
- Financial Details
- Others
- Yara
- Business Description
- Product Portfolio
- Collaborations & Alliances
- Recent Developments
- Financial Details
- Others
- Perstorp
- Business Description
- Product Portfolio
- Collaborations & Alliances
- Recent Developments
- Financial Details
- Others
- HIF Global
- Business Description
- Product Portfolio
- Collaborations & Alliances
- Recent Developments
- Financial Details
- Others
- INFINIUM
- Business Description
- Product Portfolio
- Collaborations & Alliances
- Recent Developments
- Financial Details
- Others
- Electrochaea GmbH
- Business Description
- Product Portfolio
- Collaborations & Alliances
- Recent Developments
- Financial Details
- Others
- Siemens Energy
- Business Description
- Product Portfolio
- Collaborations & Alliances
- Recent Developments
- Financial Details
- Others
- Shell
- Business Description
- Product Portfolio
- Collaborations & Alliances
- Recent Developments
- Financial Details
- Others
- TotalEnergies
- Business Description
- Product Portfolio
- Collaborations & Alliances
- Recent Developments
- Financial Details
- Others
- Saudi Arabian Oil Co. (Saudi Aramco)
- Company Profiles
- Disclaimer

MarkNtel Advisors follows a robust and iterative research methodology designed to ensure maximum accuracy and minimize deviation in market estimates and forecasts. Our approach combines both bottom-up and top-down techniques to effectively segment and quantify various aspects of the market. A consistent feature across all our research reports is data triangulation, which examines the market from three distinct perspectives to validate findings. Key components of our research process include:
1. Scope & Research Design At the outset, MarkNtel Advisors define the research objectives and formulate pertinent questions. This phase involves determining the type of research—qualitative or quantitative—and designing a methodology that outlines data collection methods, target demographics, and analytical tools. They also establish timelines and budgets to ensure the research aligns with client goals.
2. Sample Selection and Data Collection In this stage, the firm identifies the target audience and determines the appropriate sample size to ensure representativeness. They employ various sampling methods, such as random or stratified sampling, based on the research objectives. Data collection is carried out using tools like surveys, interviews, and observations, ensuring the gathered data is reliable and relevant.
3. Data Analysis and Validation Once data is collected, MarkNtel Advisors undertake a rigorous analysis process. This includes cleaning the data to remove inconsistencies, employing statistical software for quantitative analysis, and thematic analysis for qualitative data. Validation steps are taken to ensure the accuracy and reliability of the findings, minimizing biases and errors.

4. Data Forecast and FinalizationThe final phase involves forecasting future market trends based on the analyzed data. MarkNtel Advisors utilize predictive modeling and time series analysis to anticipate market behaviors. The insights are then compiled into comprehensive reports, featuring visual aids like charts and graphs, and include strategic recommendations to inform client decision-making
We’d love to understand what matters most to you.