
By Power Rating (Upto 20 KVA, 21KVA to 75 KVA, 76 KVA to 375 KVA, 376 KVA to 750 KVA, 751 KVA to 2,000 KVA, Above 2,000 KVA), By Type (Peak Shaving, Standby Power, Prime Power), By End User (Residenti... ... End User (Residential, Hospitality, Commercial Offices, Retail, Data Centers, Healthcare, Telecom & Utilities, Oil & Gas, Government & Transport, Equipment Rental Companies, Mining, Defense), and others Read more
- Energy
- May 2026
- 210
- PDF, Excel, PPT
Africa Diesel Generator Market Key Takeaways
- The Africa Diesel Generator Market was valued at approximately USD 1.54 billion in 2025 and is projected to grow from USD 1.68 billion in 2026 to nearly USD 2.76 billion by 2032.
- The steady growth trajectory is projected, with the industry registering a CAGR of approximately 8.63% through the forecast period.
- Nigeria dominates the regional landscape, accounting for around 23% of the total market share, driven by high demand for reliable backup power solutions.
- By type, standby power generators represent the leading segment, contributing approximately 65% of the overall market, reflecting the region’s dependence on backup electricity amid grid instability.
- In terms of end users, the industrial segment held a significant share of nearly 34% in 2026, supported by growing industrialization and the need for an uninterrupted power supply across manufacturing and processing sectors.
- The competitive landscape remains highly fragmented, with the top five players collectively accounting for around 45% of the total market share, indicating a mix of established companies and regional participants shaping the industry dynamics.
Africa Diesel Generator Market Size and Outlook
The Africa Diesel Generator Market is projected to grow at a compound annual growth rate (CAGR) of approximately 8.63% during the forecast period of 2026–2032. This growth is primarily driven by persistent power reliability challenges across several African economies, where grid instability continues to necessitate dependable backup power solutions. While several countries have made notable strides in improving electricity access, supply consistency remains uneven, reinforcing the structural need for backup power solutions across sectors.
In North Africa, Algeria has achieved near-universal electrification of approximately 99.8%. However, despite strong grid infrastructure, reliability pressures during peak demand periods continue to emerge, particularly during seasonal load surges. Industrial and commercial users increasingly deploy diesel generators as contingency systems to mitigate localized disruptions, highlighting that high electrification does not necessarily equate to uninterrupted supply.
Similarly, in Ghana, electrification levels have reached around 85.9%. Despite this progress, periodic shortages linked to fuel supply constraints and system inefficiencies continue to affect power availability. Businesses, particularly in manufacturing and services, are therefore investing in diesel generators to ensure operational continuity during supply fluctuations.
At a broader level, demand dynamics within the market are evolving toward higher-value applications. The increasing adoption of high-capacity generators is being driven by the expansion of energy-intensive infrastructure. For instance, Visa Inc. announced a USD 1 billion investment plan in Africa, including the development of a data center in South Africa. Such developments underscore the growing need for large-scale, mission-critical backup power systems capable of supporting continuous operations in digital and industrial environments.
Segment-wise, standby power continues to dominate the market, accounting for approximately 65% of total demand. This dominance is rooted in persistent grid instability across major economies such as Nigeria and South Africa, where frequent outages necessitate reliable backup systems across commercial, healthcare, and telecom applications. Concurrently, the industrial segment leads end-user demand with an estimated 34% share, supported by continuous power requirements in mining, manufacturing, and oil & gas operations, particularly in remote or weak-grid regions.
Overall, despite ongoing electrification efforts, reliability challenges and rising power demand will continue to sustain diesel generator adoption. The market is gradually shifting toward high-capacity and mission-critical applications, ensuring the long-term relevance of diesel generators as essential infrastructure across Africa’s evolving energy landscape.
Africa Diesel Generator Market Key Indicators
- As of 2024, nearly 600 million people in Sub-Saharan Africa, about 47% of the population, remain without electricity access, according to the International Energy Agency. This persistent access deficit has widened compared to 2019, compelling enterprises, telecom operators, and healthcare facilities to depend on captive diesel generation, thereby sustaining consistent demand across both low- and high-capacity generator segments.
- In 2024, the World Bank and African Development Bank launched Mission 300, targeting electricity access for 300 million people by 2030. However, achieving this requires 4.2 million new connections per month, exceeding the region’s population growth rate, indicating that off-grid conditions will persist and continue to justify diesel generator deployment.
- Public investment remains structurally insufficient. Government spending across 23 Sub-Saharan African countries reached USD 1.1 billion in 2024 and is projected at USD 1.9 billion in 2025, covering only a fraction of the estimated USD 15 billion annual requirement for universal electrification. This funding gap ensures diesel generators remain the most immediate and scalable solution for critical sectors.
- Africa has 500,000 telecom towers, the majority of which rely on diesel generators due to weak or absent grid connectivity. Energy can account for up to 60% of tower operating costs in remote areas, reinforcing dependence on diesel-based power systems for uninterrupted connectivity.
Africa Diesel Generator Market Scope
| Category | Segments |
|---|---|
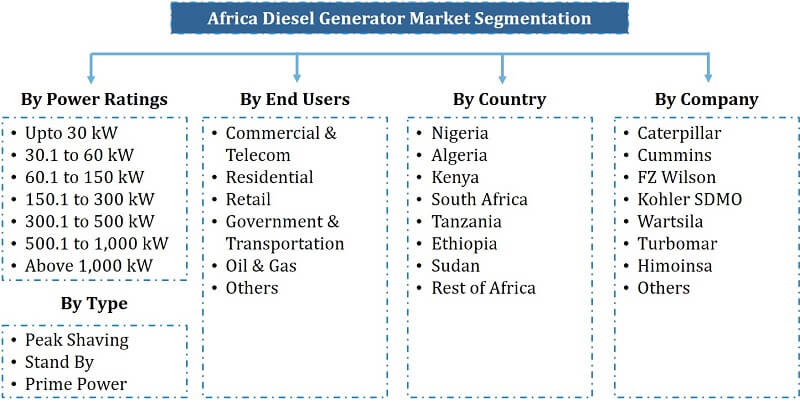
| By Power Rating | Upto 20 KVA, 21KVA to 75 KVA, 76 KVA to 375 KVA, 376 KVA to 750 KVA, 751 KVA to 2,000 KVA, Above 2,000 KVA |
| By Type | Peak Shaving, Standby Power, Prime Power |
| By End User | Residential, Hospitality, Commercial Offices, Retail, Data Centers, Healthcare, Telecom & Utilities, Oil & Gas, Government & Transport, Equipment Rental Companies, Mining, Defense |
Africa Diesel Generator Market Growth Drivers
Structural Grid Instability Driving Backup Power Dependence
Electricity reliability remains a structural constraint across Africa, directly sustaining demand for diesel generators. According to the World Bank, a significant share of businesses in Sub-Saharan Africa experience frequent outages, with firm-level disruption rates among the highest globally. In Nigeria, power supply deficits are particularly acute, only about one-third of installed capacity (13,000 MW) is effectively delivered, forcing widespread reliance on self-generation. As a result, outages impose severe economic costs, with losses estimated at around USD 29 billion annually, while businesses and households spend billions on diesel-based backup systems.
Grid instability is further reinforced by limited access to electricity. Nearly 40% of Nigeria’s population still lacks access to grid power, while urban centers face daily outages lasting several hours. Similarly, in South Africa, persistent load shedding continues to disrupt supply, with utilities cutting up to 3,000 MW during peak shortages due to aging infrastructure and plant breakdowns.
Looking ahead, electrification demand across Africa is expected to rise steadily through 2027, supported by grid expansion and decentralized energy programs led by institutions such as the International Energy Agency. However, infrastructure upgrades require long implementation timelines, ensuring continued reliance on backup power solutions.
Persistent grid unreliability, combined with rising electricity demand, will continue to anchor diesel generators as essential backup infrastructure. As reliability gaps remain unresolved in the near term, this driver will sustain long-term market growth across commercial and industrial sectors.
- Market Segmentation
- Introduction
- Research Process
- Assumption
- Market Definition
- Executive Summary
- Africa Diesel Generator Market Policies, Regulations, Product Standards
- Africa Diesel Generator Market Trends & Developments
- Africa Diesel Generator Production (Thousand Units) Trend 2022-2032
- Africa Diesel Generator Production (Thousand Units) Trend by Type
- Peak Shaving
- Standby Power
- Prime Power
- Company-Wise Production Plants and Statistics
- Africa Diesel Generator Production (Thousand Units) Trend by Type
4.2.1. Installed Production Capacity
4.2.2. Actual Production
4.2.3. Planned Production Target
- Africa Diesel Generator Pricing Analysis 2022-2032
- Africa Diesel Generator Pricing Trend (USD/Units) 2022-2032
- Africa Diesel Generator Pricing Trend (USD/Units) By Regions 2022-2032
- South Africa
- Nigeria
- Kenya
- Algeria
- Angola
- Ethiopia
- Ghana
- Côte d'Ivoire
- Tanzania
- Rest of Africa
- Africa Diesel Generator Pricing Trend (USD/Units) By Type 2022-2032
- Peak Shaving
- Standby Power
- Prime Power
- Africa Diesel Generator Market Dynamics
- Growth Drivers
- Challenges
- Africa Diesel Generator Market Value Chain Analysis
- Africa Diesel Generator Market Hotspot and Opportunities
- Africa Diesel Generator Market Outlook, 2022-2032F
- Market Size & Analysis
- By Revenue (USD Million)
- By Units Sold (Thousand Units)
- Market Share & Analysis
- By Power Rating- (Thousand Units)
- Upto 20 KVA
- 21KVA to 75 KVA
- 76 KVA to 375 KVA
- 376 KVA to 750 KVA
- 751 KVA to 2,000 KVA
- Above 2,000 KVA
- By Type- (Thousand Units)
- Peak Shaving
- Standby Power
- Prime Power
- By End User- (Thousand Units)
- Residential
- Hospitality
- Commercial Offices
- Retail
- Data Centers
- Healthcare
- Telecom & Utilities
- Oil & Gas
- Government & Transport
- Industrial (Manufacturing Facilities, Assembly Units, etc.)
- Equipment Rental Companies
- Mining
- Defense
- Others (Agriculture, Educational Institutes, etc.)
- By Country
- South Africa
- Nigeria
- Kenya
- Algeria
- Angola
- Ethiopia
- Ghana
- Côte d'Ivoire
- Tanzania
- Rest of Africa
- By Company
- Revenue Shares
- Competition Characteristics
- By Power Rating- (Thousand Units)
- Market Size & Analysis
- South Africa Diesel Generator Market Outlook, 2022-2032F
- Market Size & Analysis
- By Revenue (USD Million)
- By Units Sold (Thousand)
- Market Share & Analysis
- By Power Rating- (Thousand Units)
- By Type- (Thousand Units)
- By End User- (Thousand Units)
- Market Size & Analysis
- Nigeria Diesel Generator Market Outlook, 2022-2032F
- Market Size & Analysis
- By Revenue (USD Million)
- By Units Sold (Thousand)
- Market Share & Analysis
- By Power Rating- (Thousand Units)
- By Type- (Thousand Units)
- By End User- (Thousand Units)
- Market Size & Analysis
- Kenya Diesel Generator Market Outlook, 2022-2032F
- Market Size & Analysis
- By Revenue (USD Million)
- By Units Sold (Thousand)
- Market Share & Analysis
- By Power Rating- (Thousand Units)
- By Type- (Thousand Units)
- By End User- (Thousand Units)
- Market Size & Analysis
- Algeria Diesel Generator Market Outlook, 2022-2032F
- Market Size & Analysis
- By Revenue (USD Million)
- By Units Sold (Thousand)
- Market Share & Analysis
- By Power Rating- (Thousand Units)
- By Type- (Thousand Units)
- By End User- (Thousand Units)
- Market Size & Analysis
- Angola Diesel Generator Market Outlook, 2022-2032F
- Market Size & Analysis
- By Revenue (USD Million)
- By Units Sold (Thousand)
- Market Share & Analysis
- By Power Rating- (Thousand Units)
- By Type- (Thousand Units)
- By End User- (Thousand Units)
- Market Size & Analysis
- Ethiopia Diesel Generator Market Outlook, 2022-2032F
- Market Size & Analysis
- By Revenue (USD Million)
- By Units Sold (Thousand)
- Market Share & Analysis
- By Power Rating- (Thousand Units)
- By Type- (Thousand Units)
- By End User- (Thousand Units)
- Market Size & Analysis
- Ghana Diesel Generator Market Outlook, 2022-2032F
- Market Size & Analysis
- By Revenue (USD Million)
- By Units Sold (Thousand)
- Market Share & Analysis
- By Power Rating- (Thousand Units)
- By Type- (Thousand Units)
- By End User- (Thousand Units)
- Market Size & Analysis
- Côte d'Ivoire Diesel Generator Market Outlook, 2022-2032F
- Market Size & Analysis
- By Revenue (USD Million)
- By Units Sold (Thousand)
- Market Share & Analysis
- By Power Rating- (Thousand Units)
- By Type- (Thousand Units)
- By End User- (Thousand Units)
- Market Size & Analysis
- Tanzania Diesel Generator Market Outlook, 2022-2032F
- Market Size & Analysis
- By Revenue (USD Million)
- By Units Sold (Thousand)
- Market Share & Analysis
- By Power Rating- (Thousand Units)
- By Type- (Thousand Units)
- By End User- (Thousand Units)
- Market Size & Analysis
- Africa Diesel Generator Market Key Strategic Imperatives for Success and Growth
- Competitive Outlook
- Company Profiles
- Caterpiller Inc.
- Business Description
- Product Portfolio
- Strategic Alliances or Partnerships
- Recent Developments
- Financial Details
- Others
- Cummins Inc.
- Business Description
- Product Portfolio
- Strategic Alliances or Partnerships
- Recent Developments
- Financial Details
- Others
- Mitsubishi
- Business Description
- Product Portfolio
- Strategic Alliances or Partnerships
- Recent Developments
- Financial Details
- Others
- KOHLER
- Business Description
- Product Portfolio
- Strategic Alliances or Partnerships
- Recent Developments
- Financial Details
- Others
- Yanmar
- Business Description
- Product Portfolio
- Strategic Alliances or Partnerships
- Recent Developments
- Financial Details
- Others
- Generac
- Business Description
- Product Portfolio
- Strategic Alliances or Partnerships
- Recent Developments
- Financial Details
- Others
- MTU
- Business Description
- Product Portfolio
- Strategic Alliances or Partnerships
- Recent Developments
- Financial Details
- Others
- Atlas Copco
- Business Description
- Product Portfolio
- Strategic Alliances or Partnerships
- Recent Developments
- Financial Details
- Others
- Wartsila
- Business Description
- Product Portfolio
- Strategic Alliances or Partnerships
- Recent Developments
- Financial Details
- Others
- Doosan
- Business Description
- Product Portfolio
- Strategic Alliances or Partnerships
- Recent Developments
- Financial Details
- Others
- Kirloskar
- Business Description
- Product Portfolio
- Strategic Alliances or Partnerships
- Recent Developments
- Financial Details
- Others
- AKSA Power
- Business Description
- Product Portfolio
- Strategic Alliances or Partnerships
- Recent Developments
- Financial Details
- Others
- Mitsubishi Heavy Industries
- Business Description
- Product Portfolio
- Strategic Alliances or Partnerships
- Recent Developments
- Financial Details
- Others
- Briggs & Stratton
- Business Description
- Product Portfolio
- Strategic Alliances or Partnerships
- Recent Developments
- Financial Details
- Others
- Jubaili Bros
- Business Description
- Product Portfolio
- Strategic Alliances or Partnerships
- Recent Developments
- Financial Details
- Others
- Generac
- Business Description
- Product Portfolio
- Strategic Alliances or Partnerships
- Recent Developments
- Financial Details
- Others
- Others
- Caterpiller Inc.
- Company Profiles
- Disclaimer
MarkNtel Advisors follows a robust and iterative research methodology designed to ensure maximum accuracy and minimize deviation in market estimates and forecasts. Our approach combines both bottom-up and top-down techniques to effectively segment and quantify various aspects of the market. A consistent feature across all our research reports is data triangulation, which examines the market from three distinct perspectives to validate findings. Key components of our research process include:
1. Scope & Research Design At the outset, MarkNtel Advisors define the research objectives and formulate pertinent questions. This phase involves determining the type of research—qualitative or quantitative—and designing a methodology that outlines data collection methods, target demographics, and analytical tools. They also establish timelines and budgets to ensure the research aligns with client goals.
2. Sample Selection and Data Collection In this stage, the firm identifies the target audience and determines the appropriate sample size to ensure representativeness. They employ various sampling methods, such as random or stratified sampling, based on the research objectives. Data collection is carried out using tools like surveys, interviews, and observations, ensuring the gathered data is reliable and relevant.
3. Data Analysis and Validation Once data is collected, MarkNtel Advisors undertake a rigorous analysis process. This includes cleaning the data to remove inconsistencies, employing statistical software for quantitative analysis, and thematic analysis for qualitative data. Validation steps are taken to ensure the accuracy and reliability of the findings, minimizing biases and errors.

4. Data Forecast and FinalizationThe final phase involves forecasting future market trends based on the analyzed data. MarkNtel Advisors utilize predictive modeling and time series analysis to anticipate market behaviors. The insights are then compiled into comprehensive reports, featuring visual aids like charts and graphs, and include strategic recommendations to inform client decision-making
We’d love to understand what matters most to you.