

By Application (Gasoline, Diesel, Aviation Fuel, Marine and Bunker Fuel, Others), By Type (Deposit Control Additives and Detergents, Cetane Improvers, Lubricity Improvers, Stabilit......y Improvers and Antioxidants, Octane Improvers and Antiknock Additives, Corrosion Inhibitors, Cold-Flow Improvers, Handling, Safety and Quality Additives, Dyes, Markers and Other Fuel Additives), By End User (Automotive, Aviation, Marine, Power Generation, Industrial, Agriculture & Off-Highway, Others), and others Read more
- Chemicals
- Aug 2026
- 150
- PDF, Excel, PPT
US Fuel Additives Market Key Takeaways
- The market is estimated at USD 3.02 billion in 2025 and USD 3.15 billion in 2026, reaching USD 4.03 billion by 2032 with a 4.19% CAGR during forecast period i.e., 2026-32.
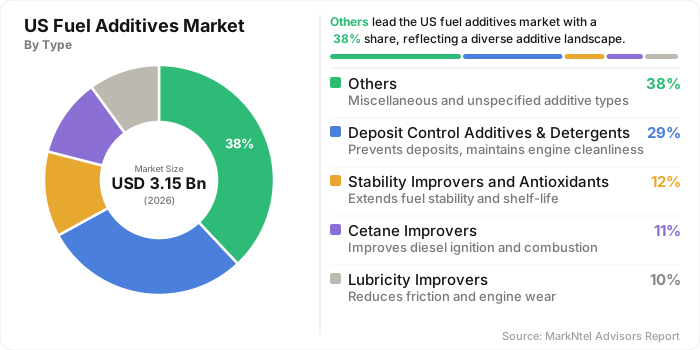
- Deposit control additives and detergents lead by type, accounting for an estimated 29% share in 2026.
- Gasoline lead by application, with an estimated 44% market share in 2026.
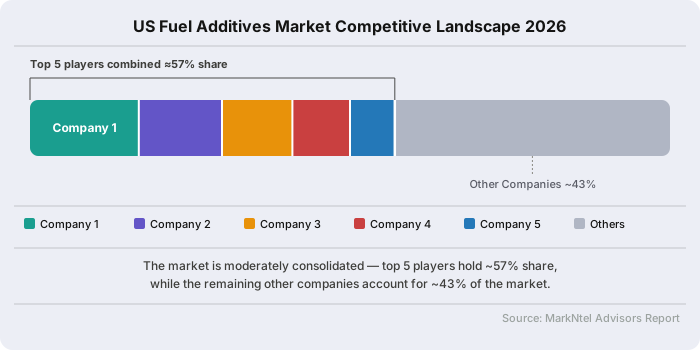
- The market is moderately concentrated, with the top five companies collectively accounting for an estimated 57% share in 2026.
US Fuel Additives Market Size and Outlook
The fuel additives market in the United States was valued at an estimated USD 3.02 billion in 2025 and is projected to reach approximately USD 3.15 billion in 2026. It is forecast to expand at a CAGR of around 4.19% during 2026–2032, reaching nearly USD 4.03 billion by 2032.
Demand is anchored by recurring US fuel consumption across road transport, aviation, marine operations, heating and industry. The US Energy Information Administration reported that the country consumed about 7.5 billion barrels of petroleum products in 2025, of which finished motor gasoline represented 43%, distillate fuel 19% and jet fuel 8%. Low treatment rates across these large fuel pools generate recurring requirements for detergency, lubricity, stability, cold-flow and corrosion control. Revenue is increasingly shaped by formulation intensity as modern injection systems, ultra-low-sulfur fuels and renewable blends require specialized packages.
Through 2032, growth is expected to shift from conventional volume-led demand toward higher-value performance and fuel-quality applications. Deposit control and terminal dosing should remain central, while renewable diesel, aviation, marine and packaged aftermarket treatments create incremental opportunities. Mature gasoline consumption, rising electric vehicle penetration, treatment-cost pressure and lengthy qualification requirements will restrain faster expansion. The forecast therefore reflects moderate volume growth, selective price realization and continued migration toward differentiated formulations supporting engine cleanliness, operability, storage stability and distribution safety.
US Fuel Additives Market Key Indicators
- In 2025, US refineries produced approximately 1.76 billion barrels of ultra-low-sulfur diesel, while domestic consumption reached 1.42 billion barrels, according to the EIA. This large, recurring fuel pool supports demand for lubricity improvers, cetane improvers, detergents, cold-flow agents and corrosion-control additives across transport and industrial uses.
- The FHWA’s Spring 2025 baseline outlook projects total US vehicle miles traveled to grow 0.7% annually from 2023 through 2043, with light-duty travel increasing 0.6%. Combination-truck and single-unit-truck travel are forecast to rise 1.0% and 2.1%, respectively, sustaining additive-treated fuel throughput despite efficiency gains.
- S&P Global Mobility reported that the average US light vehicle reached 12.8 years in 2025, while vehicles in operation increased to 289 million. The aging and expanding fleet enlarges the addressable base for packaged aftermarket cleaners and deposit-control treatments targeting fuel-system cleanliness, drivability and injector performance.
- EIA data show that the four-week average of US jet-fuel production exceeded 2.0 million barrels per day in the week ending May 1, 2026, the first such occurrence on record. Higher refinery output expands treatment requirements for approved stability, corrosion-control, conductivity and distribution-handling additives.
US Fuel Additives Market Regulatory and Fuel-Specification Analysis
Mandatory Fuel Certification and Rising Biofuel Obligations Support Specialized Additive Demand
Fuel-additive demand in the US is partly embedded in compliance rather than determined solely by voluntary performance upgrading. The EPA requires all gasoline and diesel motor-fuel additives to be registered under 40 CFR Part 79, while gasoline must contain detergent additives certified under 40 CFR Part 80, Subpart G. Suppliers must therefore maintain approved formulations, treatment rates and supporting documentation before refiners, terminals or fuel marketers can use their products. The federal 10-parts-per-million gasoline-sulfur standard and 15-parts-per-million ultra-low-sulfur diesel limit further constrain additive composition. They also increase the commercial importance of packages that provide detergency and lubricity without jeopardizing finished-fuel compliance.
Fuel specifications are becoming more complex as renewable blending expands. In March 2026, the EPA’s Renewable Fuel Standard “Set 2” established total applicable biomass-based diesel volumes of 9.07 billion RINs (equivalent to one ethanol-equivalent gallon of renewable fuel) for 2026 and 9.20 billion for 2027. The agency estimated biodiesel and renewable-diesel production and use would need to increase by over 60% compared with 2025. Larger and more varied blend pools create additional requirements for oxidation stability, cold-flow performance, corrosion control, storage integrity and fuel compatibility. Consequently, regulation supports both a recurring compliance floor and value migration toward blend-specific, multifunctional additive packages through 2032.
US Fuel Additives Market Scope
| Category | Segments |
|---|---|
| By Application | Gasoline, Diesel, Aviation Fuel, Marine and Bunker Fuel, Others |
| By Type | Deposit Control Additives and Detergents, Cetane Improvers, Lubricity Improvers, Stability Improvers and Antioxidants, Octane Improvers and Antiknock Additives, Corrosion Inhibitors, Cold-Flow Improvers, Handling, Safety and Quality Additives, Dyes, Markers and Other Fuel Additives |
| By End User | Automotive, Aviation, Marine, Power Generation, Industrial, Agriculture & Off-Highway, Others |
US Fuel Additives Market Growth Drivers
Widespread Direct Injection and Turbocharging Increase Fuel-Treatment Intensity
The increasing technical sensitivity of gasoline powertrains is raising the performance expected from fuel-additive packages even as overall gasoline demand matures. The EPA’s 2025 Automotive Trends Report found that almost 80% of model-year 2024 vehicles used gasoline direct injection or combined direct and port injection, comprising shares of 56% and 23%, respectively. Gasoline turbocharged engines also represented more than 44% of production. These technologies improve efficiency and power density but place greater importance on injector-spray control, combustion cleanliness and knock resistance under elevated pressure and temperature.
Fuel marketers and vehicle owners therefore have stronger incentives to use higher-performance detergent packages and specialized aftermarket treatments that manage injector deposits, combustion-chamber buildup and fuel degradation. The effect is not limited to newly sold vehicles: each model year adds more advanced engines to the operating fleet, extending treatment requirements through the vehicle lifecycle. Companies able to combine deposit control with corrosion protection, stability enhancement and octane support can capture higher revenue per treated gallon than commodity single-function products. Through 2032, broader penetration of direct-injection, combined-injection and turbocharged architectures should consequently support formulation upgrades and recurring demand, partly offsetting efficiency gains and electrification-related pressure on gasoline volumes.
Recent Trends
TOP TIER+ Transition Accelerates Qualification-Led Gasoline Additive Reformulation
US gasoline-additive competition is shifting from meeting statutory minimum detergency toward satisfying higher voluntary performance standards. The revised TOP TIER+ gasoline specification adds tests for direct-injector fouling and stochastic pre-ignition, expanding qualification beyond traditional intake-valve and combustion-chamber deposit control. This change is pushing suppliers to optimize multifunctional packages for injector cleanliness, particulate control and abnormal-combustion protection while retaining compatibility with EPA and California requirements. Fuel marketers must also coordinate testing, treatment rates and terminal conversions before adopting the upgraded packages.
Recent supplier activity shows this transition moving into commercialization. In August 2025, Afton Chemical launched its TOP TIER+-approved HiTEC 65522 series for modern direct-injection engines. In September 2025, BASF announced Keropur AP 225-20, with final specifications planned for the fourth quarter of 2025 and initial deliveries for the first half of 2026, ahead of the January 2027 implementation deadline. These parallel launches indicate that differentiation is increasingly tied to qualification readiness and transition support rather than detergency claims alone. Through 2032, the trend should favor suppliers combining validated performance with flexible terminal dosing and technical assistance, increasing demand for higher-value gasoline-performance packages.
US Fuel Additives Market Opportunities and Challenges
Battery-Electric Adoption Restrains Fuel Volumes While Hybrid Growth Opens Specialized Treatment Opportunities
Battery-electric adoption presents a structural challenge in the United States fuel additives industry because each vehicle removes recurring gasoline consumption from the addressable fuel-treatment pool. The EIA estimated that battery-electric vehicles represented 7.5% of US light-duty vehicle sales in 2025, while electric vehicles accounted for approximately 2% of registered light-duty vehicles in 2024. The existing fleet therefore limits the immediate impact, but continued adoption progressively reduces refinery, terminal and aftermarket demand for gasoline detergents, octane improvers, corrosion inhibitors and other treatments. Efficiency improvements in remaining combustion vehicles add further volume pressure, making product mix and price realization increasingly important to additive suppliers.
Hybrid expansion provides a countervailing opportunity because these vehicles retain combustion engines while reducing their operating frequency. Argonne National Laboratory reported that 212,187 hybrid-electric vehicles were sold in the US during June 2026, increasing 35.8% year over year. Longer or irregular fuel residence periods, particularly in plug-in hybrids, increase the relevance of oxidation stability, corrosion protection and deposit-control performance when engines resume operation. Manufacturers can develop low-treatment-rate, multifunctional packages for fuel marketers and packaged aftermarket channels serving these operating conditions. Hybrid growth will not fully offset displacement from battery-electric vehicles, but it can preserve liquid-fuel demand and support value migration toward specialized formulations through 2032.
Segmentation Insights
Deposit Control Additives and Detergents Lead Through Continuous, Broad-Based Treatment Demand, Accounting for an approx. 29% Market Share in 2026
Deposit control additives and detergents hold the largest functional position in US fuel additives market because they are recurring treatment components rather than occasional corrective products. Refiners and terminal operators dose them into finished gasoline to maintain injector, intake-valve and combustion-chamber cleanliness, while premium packages support higher treat rates and branded performance claims. The category also extends into diesel formulations, where injector cleanliness and spray quality matter across on-road and off-highway equipment. This cross-fuel reach, combined with carrier fluids and complementary corrosion or stability chemistries, gives suppliers more formulation and qualification value than narrower functions such as dyes, markers or cold-flow treatment.
The technical burden reinforces its commercial weight. California’s certification pathway uses ASTM D5598 and ASTM D5500 deposit-control testing, with each procedure running for 10,000 miles, creating meaningful validation costs and favoring performance-proven additive packages. That requirement supports recurring demand for certified formulations and discourages rapid substitution on price alone. Deposit-control products should therefore retain leadership through 2032, although lubricity and cold-flow improvers may advance faster from smaller bases as renewable-fuel blending and increasingly severe diesel-injection conditions create additional fuel-quality requirements. Based on type, the market is segmented into:
- Deposit Control Additives and Detergents
- Cetane Improvers
- Lubricity Improvers
- Stability Improvers and Antioxidants
- Octane Improvers and Antiknock Additives
- Corrosion Inhibitors
- Cold-Flow Improvers
- Handling, Safety and Quality Additives
- Dyes, Markers and Other Fuel Additives
Gasoline Leads Through Nationwide Throughput and Multi-Channel Dosing, Accounting for an Estimated 44% Market Share in 2026
Gasoline is the largest treated-fuel application among the fuel additive demand because the US market combines high throughput with additive use across refinery, terminal and aftermarket channels. Base detergent treatment is supplemented by premium packages, octane support, corrosion protection, antioxidants, metal deactivators and seasonal quality chemistries. This layered dosing model raises additive revenue beyond gallon volume alone. Branded stations also enable fuel marketers to differentiate grades through performance claims, while packaged additives provide a parallel channel for motorists seeking injector cleaning, storage stability or octane enhancement.
The Federal Highway Administration recorded 127.28 billion gallons of highway gasoline use in 2024, illustrating the recurring treatment base behind the segment. Small changes in treat rate, premium-fuel penetration or terminal package specifications can therefore translate into meaningful additive demand. Gasoline should remain the largest application through 2032 as the installed internal-combustion fleet continues to generate high mileage. Aviation fuel is expected to grow faster from a smaller base as traffic expands and thermal-stability, icing-inhibition and handling requirements support specialized products, but its lower absolute volume and narrower additive slate will keep it behind gasoline. Based on application, the market is segmented into:
- Gasoline
- On-Road and Off-Highway Diesel
- Aviation Fuel
- Marine and Bunker Fuels
- Heating Oil and Other Industrial Fuels
US Fuel Additives Market Competitive Analysis
The United States fuel additives market is moderately concentrated, with top five companies holding 57% market share in 2026. The top five companies in the market are Afton Chemical Corporation, BASF SE, Chevron Oronite Company LLC, Innospec Inc. and the Lubrizol Corporation.
Key Companies in the United States Fuel Additives Industry
- Afton Chemical Corporation
- BASF SE
- Baker Hughes Company
- Chevron Oronite Company LLC
- Clariant AG
- Dorf Ketal Chemicals LLC
- Evonik Industries AG
- Infineum International Limited
- Innospec Inc.
- The Lubrizol Corporation
- Others
US Fuel Additives Industry News and Recent Developments
-
August 2025 | Lubrizol Secures TOP TIER+ Certification for UltraZol GA9110 Series
Lubrizol announced that its UltraZol GA9110 Series gasoline performance additive had received certification under the revised TOP TIER+ standard. The series is intended for modern gasoline direct-injection engines and is formulated to address injector cleanliness, deposit control and stochastic pre-ignition while meeting applicable US fuel-additive requirements.
Impact analysis: Certification gives US fuel marketers another qualified package for upgrading premium gasoline formulations. It broadens supplier choice during terminal transitions and increases competition around treat-rate economics, technical support and verified GDI performance, while reinforcing deposit-control additives as a principal area of product differentiation.
- Market Segmentation
- Introduction
- Product Definition
- Research Process
- Assumptions
- Executive Summary
- US Fuel Additives Market Policies, Regulations, and Product Standards
- US Fuel Additives Market Trends & Developments
- US Fuel Additives Market Dynamics
- Growth Factors
- Challenges
- US Fuel Additives Market Hotspot & Opportunities
- US Fuel Additives Market Outlook, 2022-2032
- Market Size & Outlook
- By Revenues (USD Million)
- By Quantity Sold (Thousand Tons)
- Market Segmentation & Outlook
- By Application- Market Size & Forecast 2022-2032, USD Million & Thousand Tons
- Gasoline
- Diesel
- Aviation Fuel
- Marine and Bunker Fuel
- Others
- By Type- Market Size & Forecast 2022-2032, USD Million & Thousand Tons
- Deposit Control Additives and Detergents
- Cetane Improvers
- Lubricity Improvers
- Stability Improvers and Antioxidants
- Octane Improvers and Antiknock Additives
- Corrosion Inhibitors
- Cold-Flow Improvers
- Handling, Safety and Quality Additives
- Dyes, Markers and Other Fuel Additives
- By End User- Market Size & Forecast 2022-2032, USD Million & Thousand Tons
- Automotive
- Aviation
- Marine
- Power Generation
- Industrial
- Agriculture & Off-Highway
- Others
- By Region- Market Size & Forecast 2022-2032, USD Million & Thousand Tons
- Northeast
- Midwest
- South
- West
- By Company
- Competition Characteristics
- Market Share & Analysis
- By Application- Market Size & Forecast 2022-2032, USD Million & Thousand Tons
- Market Size & Outlook
- US Gasoline Additives Market Outlook, 2022-2032
- Market Size & Outlook
- By Revenues (USD Million)
- By Quantity Sold (Thousand Tons)
- Market Segmentation & Outlook
- By Type- Market Size & Forecast 2022-2032, USD Million & Thousand Tons
- By Point of Addition- Market Size & Forecast 2022-2032, USD Million & Thousand Tons
- By Region- Market Size & Forecast 2022-2032, USD Million & Thousand Tons
- Market Size & Outlook
- US Diesel Additives Market Outlook, 2022-2032
- Market Size & Outlook
- By Revenues (USD Million)
- By Quantity Sold (Thousand Tons)
- Market Segmentation & Outlook
- By Type- Market Size & Forecast 2022-2032, USD Million & Thousand Tons
- By Point of Addition- Market Size & Forecast 2022-2032, USD Million & Thousand Tons
- By Region- Market Size & Forecast 2022-2032, USD Million & Thousand Tons
- Market Size & Outlook
- US Aviation Fuel Additives Market Outlook, 2022-2032
- Market Size & Outlook
- By Revenues (USD Million)
- By Quantity Sold (Thousand Tons)
- Market Segmentation & Outlook
- By Type- Market Size & Forecast 2022-2032, USD Million & Thousand Tons
- By Point of Addition- Market Size & Forecast 2022-2032, USD Million & Thousand Tons
- By Region- Market Size & Forecast 2022-2032, USD Million & Thousand Tons
- Market Size & Outlook
- US Marine and Bunker Fuel Additives Market Outlook, 2022-2032
- Market Size & Outlook
- By Revenues (USD Million)
- By Quantity Sold (Thousand Tons)
- Market Segmentation & Outlook
- By Type- Market Size & Forecast 2022-2032, USD Million & Thousand Tons
- By Point of Addition- Market Size & Forecast 2022-2032, USD Million & Thousand Tons
- By Region- Market Size & Forecast 2022-2032, USD Million & Thousand Tons
- Market Size & Outlook
- US Fuel Additives Market Key Strategic Imperatives for Success & Growth
- Competitive Outlook
- Company Profiles
- Afton Chemical Corporation
- Business Description
- Product Portfolio
- Collaborations & Alliances
- Recent Developments
- Financial Details
- Others
- BASF SE
- Business Description
- Product Portfolio
- Collaborations & Alliances
- Recent Developments
- Financial Details
- Others
- Baker Hughes Company
- Business Description
- Product Portfolio
- Collaborations & Alliances
- Recent Developments
- Financial Details
- Others
- Chevron Oronite Company LLC
- Business Description
- Product Portfolio
- Collaborations & Alliances
- Recent Developments
- Financial Details
- Others
- Clariant AG
- Business Description
- Product Portfolio
- Collaborations & Alliances
- Recent Developments
- Financial Details
- Others
- Dorf Ketal Chemicals LLC
- Business Description
- Product Portfolio
- Collaborations & Alliances
- Recent Developments
- Financial Details
- Others
- Evonik Industries AG
- Business Description
- Product Portfolio
- Collaborations & Alliances
- Recent Developments
- Financial Details
- Others
- Infineum International Limited
- Business Description
- Product Portfolio
- Collaborations & Alliances
- Recent Developments
- Financial Details
- Others
- Innospec Inc.
- Business Description
- Product Portfolio
- Collaborations & Alliances
- Recent Developments
- Financial Details
- Others
- The Lubrizol Corporation
- Business Description
- Product Portfolio
- Collaborations & Alliances
- Recent Developments
- Financial Details
- Others
- Others
- Afton Chemical Corporation
- Company Profiles
- Disclaimer

MarkNtel Advisors follows a robust and iterative research methodology designed to ensure maximum accuracy and minimize deviation in market estimates and forecasts. Our approach combines both bottom-up and top-down techniques to effectively segment and quantify various aspects of the market. A consistent feature across all our research reports is data triangulation, which examines the market from three distinct perspectives to validate findings. Key components of our research process include:
1. Scope & Research Design At the outset, MarkNtel Advisors define the research objectives and formulate pertinent questions. This phase involves determining the type of research—qualitative or quantitative—and designing a methodology that outlines data collection methods, target demographics, and analytical tools. They also establish timelines and budgets to ensure the research aligns with client goals.
2. Sample Selection and Data Collection In this stage, the firm identifies the target audience and determines the appropriate sample size to ensure representativeness. They employ various sampling methods, such as random or stratified sampling, based on the research objectives. Data collection is carried out using tools like surveys, interviews, and observations, ensuring the gathered data is reliable and relevant.
3. Data Analysis and Validation Once data is collected, MarkNtel Advisors undertake a rigorous analysis process. This includes cleaning the data to remove inconsistencies, employing statistical software for quantitative analysis, and thematic analysis for qualitative data. Validation steps are taken to ensure the accuracy and reliability of the findings, minimizing biases and errors.

4. Data Forecast and FinalizationThe final phase involves forecasting future market trends based on the analyzed data. MarkNtel Advisors utilize predictive modeling and time series analysis to anticipate market behaviors. The insights are then compiled into comprehensive reports, featuring visual aids like charts and graphs, and include strategic recommendations to inform client decision-making
FILL THE FORM TO INQUIRE BEFORE BUYING THIS REPORT
We offer flexible licensing options to cater to varying organizational needs. Choose the pricing pack that best suits your requirements:
Buy Now Talk to our Consultant
 Request Customization