
By Product Type (Functional Beverages (Sports Drinks, Dairy & Dairy Alternative Drinks, Fruit & Vegetable Juices), Functional Foods, Dietary Supplements), By Distribution Channel (......Online Retail, Specialty Stores, Pharmacies, Others), By End User (Household, Commercial), By Source (Probiotics, Prebiotics, Vitamins, Minerals), and others Read more
- Food & Beverages
- Jun 2026
- 277
- PDF, Excel, PPT
Nutraceutical Products Market Key Takeaways
- Global nutraceutical products market size was valued at USD 611 billion in 2025 and is projected to grow from USD 642 billion in 2026 to USD 889 billion by 2032.
- The industry is projected to reflect sustained growth at a steady CAGR of 5.58% during 2026-2032.
- North America holds the largest share of about 37% in 2026.
- By source, vitamins hold a significant share of about 40% in 2026.
- By distribution channel, supermarkets/ hypermarkets seized a significant share of about 38% in 2026.
- The industry is highly fragmented. However, the top five players collectively account for nearly 12% shares.
Nutraceutical Products Market Size and Outlook
The global nutraceutical products market size was valued at USD 611 billion in 2025 and is projected to grow from USD 642 billion in 2026 to USD 889 billion by 2032. Along with this, the market is estimated to grow at a CAGR of around 5.58% during the forecast period, i.e., 2026-32.
The industry is witnessing strong growth, supported by rising health consciousness, increasing focus on preventive healthcare, and growing concerns over nutritional deficiencies worldwide. According to the World Health Organization (WHO), deficiencies in iron, vitamin A, and iodine remain among the most prevalent micronutrient problems globally, with an estimated 42% of children under five years of age and 40% of pregnant women affected by anemia, emphasizing the need for dietary supplementation and food fortification programs. These trends are encouraging greater consumption of vitamins, minerals, probiotics, and functional foods.
Product innovation and regulatory developments are also strengthening the industry. In 2024, the U.S. Food and Drug Administration (FDA) issued updated guidance for new dietary ingredient notifications and continued to enhance regulatory frameworks for dietary supplements, promoting product quality, transparency, and consumer confidence. Such measures are encouraging manufacturers to invest in scientifically backed formulations and premium nutraceutical offerings.
For instance, Nestlé Health Science has expanded its portfolio by developing specialized nutrition solutions for consumers using GLP-1-based therapies for weight management, addressing the growing need for protein, micronutrient support, and muscle maintenance in individuals undergoing medical weight-loss treatments. This reflects a broader industry shift toward condition-specific and clinically aligned nutrition products that bridge the gap between food and medicine.
In addition, increasing consumer demand for personalized nutrition, plant-based products, and probiotic ingredients is reshaping the competitive landscape. Companies are expanding their portfolios to cater to evolving health preferences and aging populations. Growing investments in research, digital health technologies, and functional ingredients are further accelerating innovation across the sector.
Overall, the outlook for the global nutraceutical market remains highly favorable. Rising nutritional awareness, supportive regulatory initiatives, and continuous product advancements are expected to sustain long-term demand and create significant growth opportunities for market participants in the coming years.
Nutraceutical Products Market Key Indicators
- According to the International Diabetes Federation (IDF), approximately 589 million adults (20–79 years) were living with diabetes globally in 2025, and this figure is projected to reach 853 million by 2050. The growing prevalence of diabetes is increasing demand for nutraceutical products formulated for blood sugar management, metabolic health, and weight control, thereby supporting market growth.
- The World Health Organization (WHO) reports that more than 1 billion people worldwide are living with obesity, including nearly 890 million adults. Rising obesity levels are driving consumer adoption of weight-management supplements, functional foods, protein products, and nutraceutical ingredients aimed at improving metabolic health.
- According to the United Nations, the global population aged 65 years and above exceeded 830 million people and is projected to surpass 1 billion by 2030. Older consumers are among the largest users of nutraceuticals targeting bone health, cognitive health, immunity, cardiovascular wellness, and healthy aging, creating sustained demand across the industry.
- The WHO estimates that cardiovascular diseases (CVDs) account for approximately 20 million deaths annually worldwide. Growing awareness regarding heart health is driving consumption of nutraceutical products containing omega-3 fatty acids, plant sterols, antioxidants, and other heart-health ingredients.
- The global wellness economy exceeded USD 6 trillion, reflecting strong consumer spending on preventive health, nutrition, fitness, and wellness solutions. The shift from treatment-focused healthcare toward preventive care is significantly accelerating demand for nutraceutical products across developed and emerging economies.
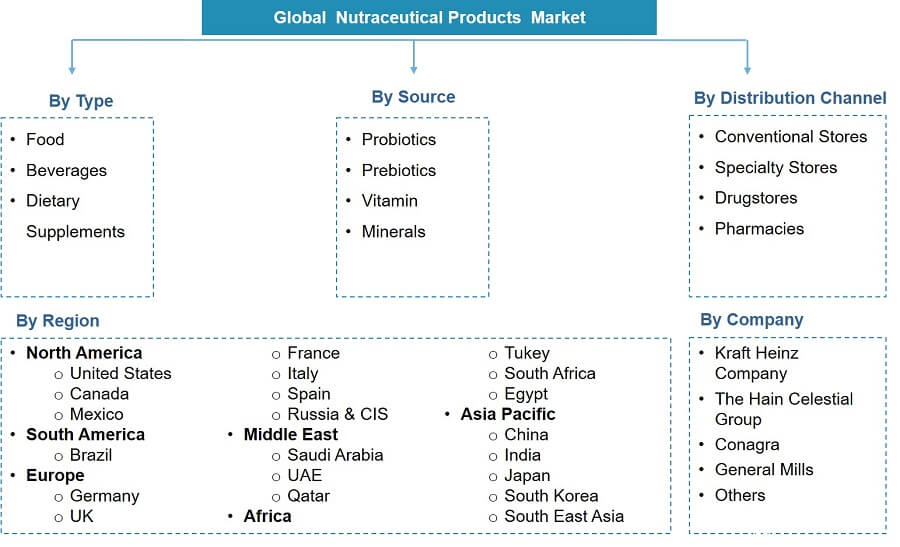
Nutraceutical Products Market Scope
| Category | Segments |
|---|---|
| By Product Type | Functional Beverages (Sports Drinks, Dairy & Dairy Alternative Drinks, Fruit & Vegetable Juices), Functional Foods, Dietary Supplements |
| By Distribution Channel | Online Retail, Specialty Stores, Pharmacies, Others |
| By End User | Household, Commercial |
| By Source | Probiotics, Prebiotics, Vitamins, Minerals |
Nutraceutical Products Market Growth Drivers
Rising Adoption of Preventive Healthcare Fuels Nutraceutical Market Expansion
The growing emphasis on preventive healthcare has become a major driver of the global nutraceutical products industry as consumers increasingly seek to maintain health and reduce the risk of chronic diseases before medical intervention becomes necessary. According to the World Health Organization (WHO), noncommunicable diseases (NCDs) caused more than 43 million deaths globally in 2021, accounting for 75% of all non-pandemic-related deaths, with cardiovascular diseases alone responsible for over 19 million deaths. This rising burden has encouraged consumers to adopt proactive health-management approaches, including the use of dietary supplements, functional foods, and fortified beverages.
Consumer adoption is already evident in mature markets. Data from the U.S. Centers for Disease Control and Prevention (CDC) showed that 60.2% of U.S. adults used at least one dietary supplement during August 2021–August 2023, while 38.7% used two or more supplements, reflecting the growing integration of preventive nutrition into daily lifestyles.
Moreover, governments and international health organizations are expected to intensify investments in preventive health programs to achieve the United Nations Sustainable Development Goal of reducing premature NCD mortality by 2030. Expanded screening initiatives, healthy-aging strategies, and nutrition-focused public health campaigns are likely to further increase demand for nutraceutical products worldwide.
Consequently, preventive healthcare is transforming nutraceuticals from optional wellness products into essential components of long-term health management. This shift is expected to sustain consumer demand and accelerate market expansion in the coming years.
- Market Segmentation
- Introduction
- Product Definition
- Research Process
- Assumptions
- Executive Summary
- Global Nutraceutical Products Market Policies, Regulations, and Product Standards
- Global Nutraceutical Products Production Trend 2022-2032
- Global Nutraceutical Products Production Trend By Type of Product
- Functional Beverages
- Functional Foods
- Dietary Supplements
- Company Wise Production Plants and Statistics
- Installed Production Capacity
- Actual Production
- Planned Production Target
- Global Nutraceutical Products Production Trend By Type of Product
- Global Nutraceutical Products Pricing Analysis 2022-2032
- Global Nutraceutical Products Pricing Trend (USD) 2022-2032
- Global Nutraceutical Products Pricing Trend (USD) By Regions 2022-2032
- North America
- Europe
- Latin America
- Asia Pacific
- Middle East & Africa
- Global Nutraceutical Products Pricing Trend (USD) By Product Type 2022-2032
- Functional Beverages
- Functional Foods
- Dietary Supplements
- Global Nutraceutical Products Market Trends & Developments
- Global Nutraceutical Products Market Dynamics
- Growth Factors
- Challenges
- Global Nutraceutical Products Market Hotspot & Opportunities
- Global Nutraceutical Products Market Outlook, 2022-2032F
- Market Size & Outlook
- By Revenues (USD Million)
- Market Share & Analysis
- By Product Type- Market Size & Forecast 2022-2032, USD Million
- Functional Beverages
- Sports Drinks
- Dairy & Dairy Alternative Drinks
- Fruit & Vegetable Juices
- Functional Foods
- Dietary Supplements
- Functional Beverages
- By Distribution Channel- Market Size & Forecast 2022-2032, USD Million
- Online Retail
- Specialty Stores
- Pharmacies
- Others
- By End User- Market Size & Forecast 2022-2032, USD Million
- Household
- Commercial
- By Source- Market Size & Forecast 2022-2032, USD Million
- Probiotics
- Prebiotics
- Vitamins
- Minerals
- By Region
- North America
- South America
- Europe
- The Middle East & Africa
- Asia Pacific
- By Company
- Competition Characteristics
- Market Share & Analysis
- By Product Type- Market Size & Forecast 2022-2032, USD Million
- Market Size & Outlook
- North America Nutraceutical Products Market Outlook, 2022-2032F
- Market Size & Outlook
- By Revenues (USD Million)
- Market Share & Analysis
- By Product Type- Market Size & Forecast 2022-2032, USD Million
- By Distribution Channel- Market Size & Forecast 2022-2032, USD Million
- By End User- Market Size & Forecast 2022-2032, USD Million
- By Source- Market Size & Forecast 2022-2032, USD Million
- By Country
- The US
- Canada
- Mexico
- The US Nutraceutical Products Market Outlook, 2022-2032F
- Market Size & Outlook
- By Revenues (USD Million)
- Market Share & Analysis
- By Product Type- Market Size & Forecast 2022-2032, USD Million
- By Distribution Channel- Market Size & Forecast 2022-2032, USD Million
- By End User- Market Size & Forecast 2022-2032, USD Million
- By Source- Market Size & Forecast 2022-2032, USD Million
- Market Size & Outlook
- Canada Nutraceutical Products Market Outlook, 2022-2032F
- Market Size & Outlook
- By Revenues (USD Million)
- Market Share & Analysis
- By Product Type- Market Size & Forecast 2022-2032, USD Million
- By Distribution Channel- Market Size & Forecast 2022-2032, USD Million
- By End User- Market Size & Forecast 2022-2032, USD Million
- By Source- Market Size & Forecast 2022-2032, USD Million
- Market Size & Outlook
- Mexico Nutraceutical Products Market Outlook, 2022-2032F
- Market Size & Outlook
- By Revenues (USD Million)
- Market Share & Analysis
- By Product Type- Market Size & Forecast 2022-2032, USD Million
- By Distribution Channel- Market Size & Forecast 2022-2032, USD Million
- By End User- Market Size & Forecast 2022-2032, USD Million
- By Source- Market Size & Forecast 2022-2032, USD Million
- Market Size & Outlook
- Market Size & Outlook
- South America Nutraceutical Products Market Outlook, 2022-2032F
- Market Size & Outlook
- By Revenues (USD Million)
- Market Share & Analysis
- By Product Type- Market Size & Forecast 2022-2032, USD Million
- By Distribution Channel- Market Size & Forecast 2022-2032, USD Million
- By End User- Market Size & Forecast 2022-2032, USD Million
- By Source- Market Size & Forecast 2022-2032, USD Million
- By Country
- Brazil
- Argentina
- Chile
- Colombia
- Peru
- Rest of South America
- Brazil Nutraceutical Products Market Outlook, 2022-2032F
- Market Size & Outlook
- By Revenues (USD Million)
- Market Share & Analysis
- By Product Type- Market Size & Forecast 2022-2032, USD Million
- By Distribution Channel- Market Size & Forecast 2022-2032, USD Million
- By End User- Market Size & Forecast 2022-2032, USD Million
- By Source- Market Size & Forecast 2022-2032, USD Million
- Market Size & Outlook
- Argentina Nutraceutical Products Market Outlook, 2022-2032F
- Market Size & Outlook
- By Revenues (USD Million)
- Market Share & Analysis
- By Product Type- Market Size & Forecast 2022-2032, USD Million
- By Distribution Channel- Market Size & Forecast 2022-2032, USD Million
- By End User- Market Size & Forecast 2022-2032, USD Million
- By Source- Market Size & Forecast 2022-2032, USD Million
- Market Size & Outlook
- Chile Nutraceutical Products Market Outlook, 2022-2032F
- Market Size & Outlook
- By Revenues (USD Million)
- Market Share & Analysis
- By Product Type- Market Size & Forecast 2022-2032, USD Million
- By Distribution Channel- Market Size & Forecast 2022-2032, USD Million
- By End User- Market Size & Forecast 2022-2032, USD Million
- By Source- Market Size & Forecast 2022-2032, USD Million
- Market Size & Outlook
- Colombia Nutraceutical Products Market Outlook, 2022-2032F
- Market Size & Outlook
- By Revenues (USD Million)
- Market Share & Analysis
- By Product Type- Market Size & Forecast 2022-2032, USD Million
- By Distribution Channel- Market Size & Forecast 2022-2032, USD Million
- By End User- Market Size & Forecast 2022-2032, USD Million
- By Source- Market Size & Forecast 2022-2032, USD Million
- Market Size & Outlook
- Market Size & Outlook
- Europe Nutraceutical Products Market Outlook, 2022-2032F
- Market Size & Outlook
- By Revenues (USD Million)
- Market Share & Analysis
- By Product Type- Market Size & Forecast 2022-2032, USD Million
- By Distribution Channel- Market Size & Forecast 2022-2032, USD Million
- By End User- Market Size & Forecast 2022-2032, USD Million
- By Source- Market Size & Forecast 2022-2032, USD Million
- By Country
- The UK
- Germany
- France
- Italy
- Spain
- Netherlands
- Rest of Europe
- The UK Nutraceutical Products Market Outlook, 2022-2032F
- Market Size & Outlook
- By Revenues (USD Million)
- Market Share & Analysis
- By Product Type- Market Size & Forecast 2022-2032, USD Million
- By Distribution Channel- Market Size & Forecast 2022-2032, USD Million
- By End User- Market Size & Forecast 2022-2032, USD Million
- By Source- Market Size & Forecast 2022-2032, USD Million
- Market Size & Outlook
- Germany Nutraceutical Products Market Outlook, 2022-2032F
- Market Size & Outlook
- By Revenues (USD Million)
- Market Share & Analysis
- By Product Type- Market Size & Forecast 2022-2032, USD Million
- By Distribution Channel- Market Size & Forecast 2022-2032, USD Million
- By End User- Market Size & Forecast 2022-2032, USD Million
- By Source- Market Size & Forecast 2022-2032, USD Million
- Market Size & Outlook
- France Nutraceutical Products Market Outlook, 2022-2032F
- Market Size & Outlook
- By Revenues (USD Million)
- Market Share & Analysis
- By Product Type- Market Size & Forecast 2022-2032, USD Million
- By Distribution Channel- Market Size & Forecast 2022-2032, USD Million
- By End User- Market Size & Forecast 2022-2032, USD Million
- By Source- Market Size & Forecast 2022-2032, USD Million
- Market Size & Outlook
- Italy Nutraceutical Products Market Outlook, 2022-2032F
- Market Size & Outlook
- By Revenues (USD Million)
- Market Share & Analysis
- By Product Type- Market Size & Forecast 2022-2032, USD Million
- By Distribution Channel- Market Size & Forecast 2022-2032, USD Million
- By End User- Market Size & Forecast 2022-2032, USD Million
- By Source- Market Size & Forecast 2022-2032, USD Million
- Market Size & Outlook
- Spain Nutraceutical Products Market Outlook, 2022-2032F
- Market Size & Outlook
- By Revenues (USD Million)
- Market Share & Analysis
- By Product Type- Market Size & Forecast 2022-2032, USD Million
- By Distribution Channel- Market Size & Forecast 2022-2032, USD Million
- By End User- Market Size & Forecast 2022-2032, USD Million
- By Source- Market Size & Forecast 2022-2032, USD Million
- Market Size & Outlook
- Netherlands Nutraceutical Products Market Outlook, 2022-2032F
- Market Size & Outlook
- By Revenues (USD Million)
- Market Share & Analysis
- By Product Type- Market Size & Forecast 2022-2032, USD Million
- By Distribution Channel- Market Size & Forecast 2022-2032, USD Million
- By End User- Market Size & Forecast 2022-2032, USD Million
- By Source- Market Size & Forecast 2022-2032, USD Million
- Market Size & Outlook
- Market Size & Outlook
- The Middle East & Africa Nutraceutical Products Market Outlook, 2022-2032F
- Market Size & Outlook
- By Revenues (USD Million)
- Market Share & Analysis
- By Product Type- Market Size & Forecast 2022-2032, USD Million
- By Distribution Channel- Market Size & Forecast 2022-2032, USD Million
- By End User- Market Size & Forecast 2022-2032, USD Million
- By Source- Market Size & Forecast 2022-2032, USD Million
- By Country
- Saudi Arabia
- The UAE
- South Africa
- Egypt
- Qatar
- Kuwait
- Rest of Middle East & Africa
- Saudi Arabia Nutraceutical Products Market Outlook, 2022-2032F
- Market Size & Outlook
- By Revenues (USD Million)
- Market Share & Analysis
- By Product Type- Market Size & Forecast 2022-2032, USD Million
- By Distribution Channel- Market Size & Forecast 2022-2032, USD Million
- By End User- Market Size & Forecast 2022-2032, USD Million
- By Source- Market Size & Forecast 2022-2032, USD Million
- Market Size & Outlook
- The UAE Nutraceutical Products Market Outlook, 2022-2032F
- Market Size & Outlook
- By Revenues (USD Million)
- Market Share & Analysis
- By Product Type- Market Size & Forecast 2022-2032, USD Million
- By Distribution Channel- Market Size & Forecast 2022-2032, USD Million
- By End User- Market Size & Forecast 2022-2032, USD Million
- By Source- Market Size & Forecast 2022-2032, USD Million
- Market Size & Outlook
- South Africa Nutraceutical Products Market Outlook, 2022-2032F
- Market Size & Outlook
- By Revenues (USD Million)
- Market Share & Analysis
- By Product Type- Market Size & Forecast 2022-2032, USD Million
- By Distribution Channel- Market Size & Forecast 2022-2032, USD Million
- By End User- Market Size & Forecast 2022-2032, USD Million
- By Source- Market Size & Forecast 2022-2032, USD Million
- Market Size & Outlook
- Egypt Nutraceutical Products Market Outlook, 2022-2032F
- Market Size & Outlook
- By Revenues (USD Million)
- Market Share & Analysis
- By Product Type- Market Size & Forecast 2022-2032, USD Million
- By Distribution Channel- Market Size & Forecast 2022-2032, USD Million
- By End User- Market Size & Forecast 2022-2032, USD Million
- By Source- Market Size & Forecast 2022-2032, USD Million
- Market Size & Outlook
- Qatar Nutraceutical Products Market Outlook, 2022-2032F
- Market Size & Outlook
- By Revenues (USD Million)
- Market Share & Analysis
- By Product Type- Market Size & Forecast 2022-2032, USD Million
- By Distribution Channel- Market Size & Forecast 2022-2032, USD Million
- By End User- Market Size & Forecast 2022-2032, USD Million
- By Source- Market Size & Forecast 2022-2032, USD Million
- Market Size & Outlook
- Kuwait Nutraceutical Products Market Outlook, 2022-2032F
- Market Size & Outlook
- By Revenues (USD Million)
- Market Share & Analysis
- By Product Type- Market Size & Forecast 2022-2032, USD Million
- By Distribution Channel- Market Size & Forecast 2022-2032, USD Million
- By End User- Market Size & Forecast 2022-2032, USD Million
- By Source- Market Size & Forecast 2022-2032, USD Million
- Market Size & Outlook
- Oman Nutraceutical Products Market Outlook, 2022-2032F
- Market Size & Outlook
- By Revenues (USD Million)
- Market Share & Analysis
- By Product Type- Market Size & Forecast 2022-2032, USD Million
- By Distribution Channel- Market Size & Forecast 2022-2032, USD Million
- By End User- Market Size & Forecast 2022-2032, USD Million
- By Source- Market Size & Forecast 2022-2032, USD Million
- Market Size & Outlook
- Market Size & Outlook
- Asia Pacific Nutraceutical Products Market Outlook, 2022-2032F
- Market Size & Outlook
- By Revenues (USD Million)
- Market Share & Analysis
- By Product Type- Market Size & Forecast 2022-2032, USD Million
- By Distribution Channel- Market Size & Forecast 2022-2032, USD Million
- By End User- Market Size & Forecast 2022-2032, USD Million
- By Source- Market Size & Forecast 2022-2032, USD Million
- By Country
- China
- Japan
- India
- South Korea
- Australia
- Rest of Asia-Pacific
- China Nutraceutical Products Market Outlook, 2022-2032F
- Market Size & Outlook
- By Revenues (USD Million)
- Market Share & Analysis
- By Product Type- Market Size & Forecast 2022-2032, USD Million
- By Distribution Channel- Market Size & Forecast 2022-2032, USD Million
- By End User- Market Size & Forecast 2022-2032, USD Million
- By Source- Market Size & Forecast 2022-2032, USD Million
- Market Size & Outlook
- Japan Nutraceutical Products Market Outlook, 2022-2032F
- Market Size & Outlook
- By Revenues (USD Million)
- Market Share & Analysis
- By Product Type- Market Size & Forecast 2022-2032, USD Million
- By Distribution Channel- Market Size & Forecast 2022-2032, USD Million
- By End User- Market Size & Forecast 2022-2032, USD Million
- By Source- Market Size & Forecast 2022-2032, USD Million
- Market Size & Outlook
- India Nutraceutical Products Market Outlook, 2022-2032F
- Market Size & Outlook
- By Revenues (USD Million)
- Market Share & Analysis
- By Product Type- Market Size & Forecast 2022-2032, USD Million
- By Distribution Channel- Market Size & Forecast 2022-2032, USD Million
- By End User- Market Size & Forecast 2022-2032, USD Million
- By Source- Market Size & Forecast 2022-2032, USD Million
- Market Size & Outlook
- South Korea Nutraceutical Products Market Outlook, 2022-2032F
- Market Size & Outlook
- By Revenues (USD Million)
- Market Share & Analysis
- By Product Type- Market Size & Forecast 2022-2032, USD Million
- By Distribution Channel- Market Size & Forecast 2022-2032, USD Million
- By End User- Market Size & Forecast 2022-2032, USD Million
- By Source- Market Size & Forecast 2022-2032, USD Million
- Market Size & Outlook
- Australia Nutraceutical Products Market Outlook, 2022-2032F
- Market Size & Outlook
- By Revenues (USD Million)
- Market Share & Analysis
- By Product Type- Market Size & Forecast 2022-2032, USD Million
- By Distribution Channel- Market Size & Forecast 2022-2032, USD Million
- By End User- Market Size & Forecast 2022-2032, USD Million
- By Source- Market Size & Forecast 2022-2032, USD Million
- Market Size & Outlook
- Indonesia Nutraceutical Products Market Outlook, 2022-2032F
- Market Size & Outlook
- By Revenues (USD Million)
- Market Share & Analysis
- By Product Type- Market Size & Forecast 2022-2032, USD Million
- By Distribution Channel- Market Size & Forecast 2022-2032, USD Million
- By End User- Market Size & Forecast 2022-2032, USD Million
- By Source- Market Size & Forecast 2022-2032, USD Million
- Market Size & Outlook
- Market Size & Outlook
- Global Nutraceutical Products Market Key Strategic Imperatives for Success & Growth
- Competitive Outlook
- Company Profiles
- Archer Daniels Midland Company (ADM)
- Business Description
- Product Portfolio
- Collaborations & Alliances
- Recent Developments
- Financial Details
- Others
- BASF SE
- Business Description
- Product Portfolio
- Collaborations & Alliances
- Recent Developments
- Financial Details
- Others
- Cargill, Incorporated
- Business Description
- Product Portfolio
- Collaborations & Alliances
- Recent Developments
- Financial Details
- Others
- Danone S.A.
- Business Description
- Product Portfolio
- Collaborations & Alliances
- Recent Developments
- Financial Details
- Others
- International Flavors & Fragrances Inc. (IFF)
- Business Description
- Product Portfolio
- Collaborations & Alliances
- Recent Developments
- Financial Details
- Others
- General Mills, Inc.
- Business Description
- Product Portfolio
- Collaborations & Alliances
- Recent Developments
- Financial Details
- Others
- DSM-Firmenich AG (formerly Koninklijke DSM N.V.)
- Business Description
- Product Portfolio
- Collaborations & Alliances
- Recent Developments
- Financial Details
- Others
- Nestlé S.A.
- Business Description
- Product Portfolio
- Collaborations & Alliances
- Recent Developments
- Financial Details
- Others
- PepsiCo, Inc.
- Business Description
- Product Portfolio
- Collaborations & Alliances
- Recent Developments
- Financial Details
- Others
- Yakult Honsha Co., Ltd.
- Business Description
- Product Portfolio
- Collaborations & Alliances
- Recent Developments
- Financial Details
- Others
- Kellanova (formerly Kellogg Company)
- Business Description
- Product Portfolio
- Collaborations & Alliances
- Recent Developments
- Financial Details
- Others
- Herbalife Nutrition Ltd. (Herbalife International of America, Inc.)
- Business Description
- Product Portfolio
- Collaborations & Alliances
- Recent Developments
- Financial Details
- Others
- Abbott Laboratories
- Business Description
- Product Portfolio
- Collaborations & Alliances
- Recent Developments
- Financial Details
- Others
- Reckitt Benckiser Group plc
- Business Description
- Product Portfolio
- Collaborations & Alliances
- Recent Developments
- Financial Details
- Others
- Omega Protein Corporation
- Business Description
- Product Portfolio
- Collaborations & Alliances
- Recent Developments
- Financial Details
- Others
- Others
- Archer Daniels Midland Company (ADM)
- Company Profiles
- Disclaimer
MarkNtel Advisors follows a robust and iterative research methodology designed to ensure maximum accuracy and minimize deviation in market estimates and forecasts. Our approach combines both bottom-up and top-down techniques to effectively segment and quantify various aspects of the market. A consistent feature across all our research reports is data triangulation, which examines the market from three distinct perspectives to validate findings. Key components of our research process include:
1. Scope & Research Design At the outset, MarkNtel Advisors define the research objectives and formulate pertinent questions. This phase involves determining the type of research—qualitative or quantitative—and designing a methodology that outlines data collection methods, target demographics, and analytical tools. They also establish timelines and budgets to ensure the research aligns with client goals.
2. Sample Selection and Data Collection In this stage, the firm identifies the target audience and determines the appropriate sample size to ensure representativeness. They employ various sampling methods, such as random or stratified sampling, based on the research objectives. Data collection is carried out using tools like surveys, interviews, and observations, ensuring the gathered data is reliable and relevant.
3. Data Analysis and Validation Once data is collected, MarkNtel Advisors undertake a rigorous analysis process. This includes cleaning the data to remove inconsistencies, employing statistical software for quantitative analysis, and thematic analysis for qualitative data. Validation steps are taken to ensure the accuracy and reliability of the findings, minimizing biases and errors.

4. Data Forecast and FinalizationThe final phase involves forecasting future market trends based on the analyzed data. MarkNtel Advisors utilize predictive modeling and time series analysis to anticipate market behaviors. The insights are then compiled into comprehensive reports, featuring visual aids like charts and graphs, and include strategic recommendations to inform client decision-making
FILL THE FORM TO INQUIRE BEFORE BUYING THIS REPORT
We offer flexible licensing options to cater to varying organizational needs. Choose the pricing pack that best suits your requirements:
Buy Now