U.S. Honey Market Research Report: Forecast (2026-2032)
U.S. Honey Market - By Product Type- (Clover Honey, Alfalfa Honey, Buckwheat Honey, Wildflower Honey, Orange Blossom Honey, Manuka Honey, Sourwood Honey, Tupelo Honey, Avocado Hone...y, Date Honey, Infused/Flavored Honey (e.g., Hot Honey, Vanilla, Cinnamon), Raw & Unfiltered Honey, Other Specialty Honeys), By Processing Type- (Organic, Conventional), By Packaging Type- (Glass Jars, Bottles, Pouches, Tubs, Single-Serve Packs, Bulk Packaging, Others), By Distribution Channel- (Supermarkets/Hypermarkets, Grocery Retailers, Convenience Stores, Specialty Stores (Natural/Organic Food Stores), Online Retail/E-Commerce, Direct-to-Consumer (Farmers’ Markets, Producer Websites), Others), and others Read more
- Food & Beverages
- Jun 2025
- Pages 169
- Report Format: PDF, Excel, PPT
Market Insights & Analysis: U.S. Honey Market (2026-32):
The U.S. Honey Market size was valued at around USD 2.5 billion in 2025 and is projected to reach USD 3.65 billion by 2032. Along with this, the market is estimated to grow at a CAGR of around 6.50% during the forecast period, i.e., 2026-32. The United States Honey Market growth is due to the increasing inclination of consumers towards organic products, health benefits, high nutritional value, growing diabetic patients, financial support to small-scale firms, standardization of honey quality, versatility across the pharma, cosmetic & skincare industry, government support, and others.
The honey market in the US is emerging due to its functionality and therapeutic value. The honey from the last many centuries is used for wound healing, in the cough & sore throat, improving digestive health & metabolism, etc. It is due to its properties, antibacterial & antifungal, and the richness in amino acids, iron, zinc, antioxidants like flavonoids, polyphenols, and others, thus increasing its utility across other sectors. The innovations in honey have increased its integration into the skincare industry due to the high concentration of these properties, and growing consumer preference towards natural products has offered an opportunity for the growth of cosmetic companies. Numerous companies like Burt’s Bees and Farmacy offer honey-infused cleansers and moisturizers, an alternative to synthetic products, hence increasing the demand for honey in the skincare industry of the US.
Moreover, the increasing shift of US citizens towards natural sweeteners and the eco-friendly organic honey products, with the standardization of the honey, and the stringent regulatory norms on the adulterated honey, further boost the demand for honey in the US, thus boosting the market growth in the country.
U.S. Honey Market Scope:
| Category | Segments |
|---|---|
| By Product Type | Clover Honey, Alfalfa Honey, Buckwheat Honey, Wildflower Honey, Orange Blossom Honey, Manuka Honey, Sourwood Honey, Tupelo Honey, Avocado Honey, Date Honey, Infused/Flavored Honey (e.g., Hot Honey, Vanilla, Cinnamon), Raw & Unfiltered Honey, Other Specialty Honeys), |
| By Processing Type | Organic,Conventional), |
| By Packaging Type | Glass Jars, Bottles, Pouches, Tubs, Single-Serve Packs, Bulk Packaging, Others), |
| By Distribution Channel | Supermarkets/Hypermarkets, Grocery Retailers, Convenience Stores, Specialty Stores (Natural/Organic Food Stores), Online Retail/E-Commerce, Direct-to-Consumer (Farmers’ Markets, Producer Websites), Others), and others |
U.S. Honey Market Driver:
Increasing Diabetic Cases to Drive Market Growth – The demand for honey has surged due to the health benefits and composition, like a lower glycemic index, rich in vitamins and minerals, antibacterial & anti-inflammatory properties, high amount of antioxidants, contains prebiotics, and digestive enzymes. The diabetic cases in the US are rising with the rising rate of obesity, lack of exercise, poor diet, aging population, genetic factors, and others. According to the Centers for Disease Control and Prevention (CDC), over 38.4 million US individuals were diagnosed with diabetes in 2024. As a result, the patients are advised to avoid the consumption of sugar and sugary foods and beverages, which spike the glucose level.
The increasing diagnosis and awareness about the growing cases of diabetes and its adverse effects on the heart and other organs have pushed the US population to shift towards honey as a sweetening agent. As the honey has a lower glycemic index, it does not spike the glucose and blood sugar levels. Further, the honey reduces the inflammation, and the other properties, like digestive enzymes, antioxidants, etc., make it appealing to the masses, resulting in an increase in the demand for honey in the United States.

U.S. Honey Market Opportunity:
Government’s Legislative & Financial Support – The government is supporting the market growth by offering financial assistance programs, research funds, acts, etc., to help the beekeepers in managing the risks and to integrate advanced bee farming practices. The US government and the Department of Agriculture oversee the domestic and imported honey market, initiated in 2016 and is in force to date, which supports the small-scale honey farms and suppliers. Under this legislative norm, any business or individual supplying less than 125 tons of honey to the US annually is exempted from the tax of around USD30 per ton. Similarly, the Farm Bill 2018 of the US government was initiated in 2019 and in effect in 2025, offering loans to farmers at a lower rate of interest. Thus, such programs and initiatives support the small-scale domestic and honey importers in the US market.
Additionally, the Honey Integrity Act of the US, introduced in 2025, ensures the authenticity through the regular monitoring of the quality, adulteration, and imposes strict standards on the honey to protect the rights of the domestic producers from unfair practices, improving the product transparency. Thus, the incentives and other financial support initiatives, along with the Honey Integrity Act, offer an opportunity for growth in the United States Honey Industry.
U.S. Honey Market Challenge:
Declining Bee Population to Hinder Further Growth – The bee population is declining at a faster rate due to climate change, loss of natural habitat, excessive usage of pesticides harms the reproductive cycle of bees, pathogens & pesticides attacking the bees' colonies, monoculture farming, fragmentation of wildflower meadows, and others.
These factors have resulted in the decline of the bee population, which has eventually negatively impacted the honey production and food service industry of the US. A spike of about 20% in the loss of commercial honey bee colonies is noted in 2025 from the last decade. It is observed that due to the excessive usage of pesticides, nutritional deficiency, along with the climatic conditions, hinder the reproduction of the honey bees. The reduced honey bee population, a pollinator for the production of honey, is a direct threat to the honey industry and related food services in the United States. Thus, the declining rate of bees is driven by habitat loss, usage of pesticides, undernutrition, and environmental conditions, posing a threat to the further growth & expansion of the honey industry in the USA.
U.S. Honey Market Trend:
Inclination of Consumers Towards Organic & Raw Honey – The growing inclination of consumers towards organic products has increased due to the health benefits, growing disturbances in the ecological balance, food transparency, increasing social media influence, government support, etc. The food industry of the US is inclining towards organic food with the projected CAGR of around 5% from 2023 to 2028. The honey is one of the crucial elements in the food industry of the US; thus, the demand for organic and raw honey has increased in the commercial food industry and for domestic use. As per the US Retail Nielsen Data, the volume sales of organic honey have increased by 9.1%, whereas those of conventional honey increased by 7.4%, in 2024. This data and statistics depict the growing adoption of organic honey over others.
This inclination of consumers toward minimally processed and chemical-free organic and raw honey is further increased by the presence of natural enzymes, vitamins, and antioxidants, which are absent in conventional honey. Thus, seeking it as a healthier alternative to refined sugar and artificial sweeteners, the US citizens are inclined towards it, hence increasing its demand in the country.
U.S. Honey Market (2026-32): Segmentation Analysis
The U.S. Honey Market study of MarkNtel Advisors evaluates & highlights the major trends and influencing factors in each segment. It includes predictions for the period 2026–2032 at the national level. Based on the analysis, the market has been further classified as:
Based on Product Type:
- Clover Honey
- Alfalfa Honey
- Buckwheat Honey
- Wildflower Honey
- Orange Blossom Honey
- Manuka Honey
- Sourwood Honey
- Tupelo Honey
- Avocado Honey
- Date Honey
- Infused/Flavored Honey (e.g., Hot Honey, Vanilla, Cinnamon)
- Organic Honey
- Raw & Unfiltered Honey
- Other Specialty Honeys
Based on product type, the wildflower honey holds the largest market share of around 35%. This market share is due to the widespread availability, convenient transit, local production, distinctive taste, contains a large variety of nutrients, support for domestic producers, etc. Moreover, the wildflower honey is produced from the nectar collected from a wide range of flowers, having a distinctive taste and properties, offering a wide range of sweetness and flavors to various cuisines and dishes. It has distinctive regional flavors depending on the flowers grown in the region, and offers an authentic, minimally processed, and nutrient-rich honey in the US.
Additionally, the wildflower honey, as compared to a specialty honey, is easily accessible and is relatively low-cost, and is produced from sustainable practices. It supports the local and small-scale domestic honey producers and strengthens the direct-to-consumer channel. Thus, the majority of consumers in the US are inclined towards wildflower honey, hence increasing its market share.
Based on Packaging Type:
- Glass Jars
- Bottles
- Pouches
- Tubs
- Single-Serve Packs
- Bulk Packaging
- Other Packaging Types
The glass jar packaging holds the largest market share of about 48%. This is due to the premium quality, easier accessibility to the population, urbanization, transparency, eco-friendliness, hygiene, etc. The packaging of honey in glass jars is a common practice in the honey industry of the US, as they are air-tight, which seals the honey and prevents contact with moisture, air, or any other contaminant. The minimized contact of honey with moisture and air improves the shelf life and keeps it fresh by eliminating the spoilage agents. The glass is non-reactive and does not leach chemicals into the honey, thus keeping the honey clean and hygienic from the chemicals.
Moreover, the transparency of the glass jar offers the consumers the visibility of the inside content, providing consumer satisfaction on the quality, clarity, and consistency of the honey. It has an aesthetic visual appeal, resulting in a feeling of premium honey. Further, the glass is a recyclable and reusable material; thus, it is nature-friendly, aligning with the US government’s sustainable goals. Therefore, the transparency, better inspection, aesthetic appeal, and prevention of contamination and leaching of chemicals into the honey increase the demand for fresh and chemical-free honey stored in glass jars in the United States.
US Honey Industry Recent Development:
- 2024: Local Hive Honey (Rice’s Honey LLC) launched USDA Organic Hive™ Honey distribution at Albertsons stores, marking a significant step in expanding organic-certified honey availability and meeting rising consumer demand for clean and sustainably sourced products nationwide.
- 2024: Sioux Honey Association Co‑op introduced the Sue Bee® Sea Salt Honey (“Swalty”), a savory-sweet flavored honey infused with premium sea salt. This launch not only expands their Infusions™ lineup but also taps into the growing “sweet‑salty fusion” trend—offering consumers a versatile drizzle for ice cream, popcorn, charcuterie, and sports fuel—reinforcing Sue Bee’s innovation in premium honey experiences.
Gain a Competitive Edge with Our U.S. Honey Market Report
- U.S. Honey Market by MarkNtel Advisors provides a detailed & thorough analysis of market size & share, growth rate, competitive landscape, and key players. This comprehensive analysis helps businesses gain a holistic understanding of the market dynamics & make informed decisions.
- This report also highlights current market trends & future projections, allowing businesses to identify emerging opportunities & potential challenges. By understanding market forecasts, companies can align their strategies & stay ahead of the competition.
- U.S. Honey Market Report aids in assessing & mitigating risks associated with entering or operating in the market. By understanding market dynamics, regulatory frameworks, and potential challenges, businesses can develop strategies to minimize risks & optimize their operations.
*Reports Delivery Format - Market research studies from MarkNtel Advisors are offered in PDF, Excel and PowerPoint formats. Within 24 hours of the payment being successfully received, the report will be sent to your email address.
Frequently Asked Questions
- Market Segmentation
- Introduction
- Product Definition
- Research Process
- Assumptions
- Executive Summary
- U.S. Honey Market Policies, Regulations, and Product Standards
- U.S. Honey Market Supply Chain Analysis
- U.S. Honey Market Trends & Developments
- U.S. Honey Market Dynamics
- Growth Drivers
- Challenges
- U.S. Honey Market Hotspot & Opportunities
- U.S. Honey Market Outlook, 2021–2032F
- Market Size & Outlook
- By Revenues (USD Million)
- By Volume (Thousand Tons)
- Market Share & Outlook
- By Product Type- (Thousand Tons)
- Clover Honey
- Alfalfa Honey
- Buckwheat Honey
- Wildflower Honey
- Orange Blossom Honey
- Manuka Honey
- Sourwood Honey
- Tupelo Honey
- Avocado Honey
- Date Honey
- Infused/Flavored Honey (e.g., Hot Honey, Vanilla, Cinnamon)
- Raw & Unfiltered Honey
- Other Specialty Honeys
- By Processing Type- (Thousand Tons)
- Organic
- Conventional
- By Packaging Type- (Thousand Tons)
- Glass Jars
- Bottles
- Pouches
- Tubs
- Single-Serve Packs
- Bulk Packaging
- Others
- By Distribution Channel- (Thousand Tons)
- Supermarkets/Hypermarkets
- Grocery Retailers
- Convenience Stores
- Specialty Stores (Natural/Organic Food Stores)
- Online Retail/E-Commerce
- Direct-to-Consumer (Farmers’ Markets, Producer Websites)
- Others
- By End-User- (Thousand Tons)
- Household
- Food & Beverage Industry
- Pharmaceuticals & Healthcare
- Cosmetics & Personal Care
- Others (e.g., Foodservice, Institutional)
- By Company
- Company Revenue Shares
- Competitor Characteristics
- By Product Type- (Thousand Tons)
- Market Size & Outlook
- U.S. Organic Honey Market Outlook, 2021–2032F
- Market Size & Outlook
- By Revenues (USD Million)
- By Volume (Thousand Tons)
- Market Share & Outlook
- By Product Type- (Thousand Tons)
- By Packaging Type- (Thousand Tons)
- By Distribution Channel- (Thousand Tons)
- By End-User- (Thousand Tons)
- Market Size & Outlook
- U.S. Conventional Honey Market Outlook, 2021–2032F
- Market Size & Outlook
- By Revenues (USD Million)
- By Volume (Thousand Tons)
- Market Share & Outlook
- By Product Type- (Thousand Tons)
- By Packaging Type- (Thousand Tons)
- By Distribution Channel- (Thousand Tons)
- By End-User- (Thousand Tons)
- Market Size & Outlook
- U.S. Honey Market Key Strategic Imperatives for Success & Growth
- Competition Outlook
- Company Profiles
- Sioux Honey Association Co-op (Sue Bee Honey)
- Business Description
- Product Portfolio
- Strategic Alliances or Partnerships
- Recent Developments
- Financial Details
- Others
- Barkman Honey LLC
- Business Description
- Product Portfolio
- Strategic Alliances or Partnerships
- Recent Developments
- Financial Details
- Others
- Dutch Gold Honey Inc.
- Business Description
- Product Portfolio
- Strategic Alliances or Partnerships
- Recent Developments
- Financial Details
- Others
- Golden Heritage Foods (GHF)
- Business Description
- Product Portfolio
- Strategic Alliances or Partnerships
- Recent Developments
- Financial Details
- Others
- Nature Nate’s Honey Co.
- Business Description
- Product Portfolio
- Strategic Alliances or Partnerships
- Recent Developments
- Financial Details
- Others
- Local Hive Honey (Rice’s Honey LLC)
- Business Description
- Product Portfolio
- Strategic Alliances or Partnerships
- Recent Developments
- Financial Details
- Others
- Bee Maid Honey Limited
- Business Description
- Product Portfolio
- Strategic Alliances or Partnerships
- Recent Developments
- Financial Details
- Others
- GloryBee Inc.
- Business Description
- Product Portfolio
- Strategic Alliances or Partnerships
- Recent Developments
- Financial Details
- Others
- Savannah Bee Company
- Business Description
- Product Portfolio
- Strategic Alliances or Partnerships
- Recent Developments
- Financial Details
- Others
- Miller Honey Company
- Business Description
- Product Portfolio
- Strategic Alliances or Partnerships
- Recent Developments
- Financial Details
- Others
- Others
- Sioux Honey Association Co-op (Sue Bee Honey)
- Company Profiles
- Disclaimer
MarkNtel Advisors follows a robust and iterative research methodology designed to ensure maximum accuracy and minimize deviation in market estimates and forecasts. Our approach combines both bottom-up and top-down techniques to effectively segment and quantify various aspects of the market. A consistent feature across all our research reports is data triangulation, which examines the market from three distinct perspectives to validate findings. Key components of our research process include:
1. Scope & Research Design At the outset, MarkNtel Advisors define the research objectives and formulate pertinent questions. This phase involves determining the type of research—qualitative or quantitative—and designing a methodology that outlines data collection methods, target demographics, and analytical tools. They also establish timelines and budgets to ensure the research aligns with client goals.
2. Sample Selection and Data Collection In this stage, the firm identifies the target audience and determines the appropriate sample size to ensure representativeness. They employ various sampling methods, such as random or stratified sampling, based on the research objectives. Data collection is carried out using tools like surveys, interviews, and observations, ensuring the gathered data is reliable and relevant.
3. Data Analysis and Validation Once data is collected, MarkNtel Advisors undertake a rigorous analysis process. This includes cleaning the data to remove inconsistencies, employing statistical software for quantitative analysis, and thematic analysis for qualitative data. Validation steps are taken to ensure the accuracy and reliability of the findings, minimizing biases and errors.
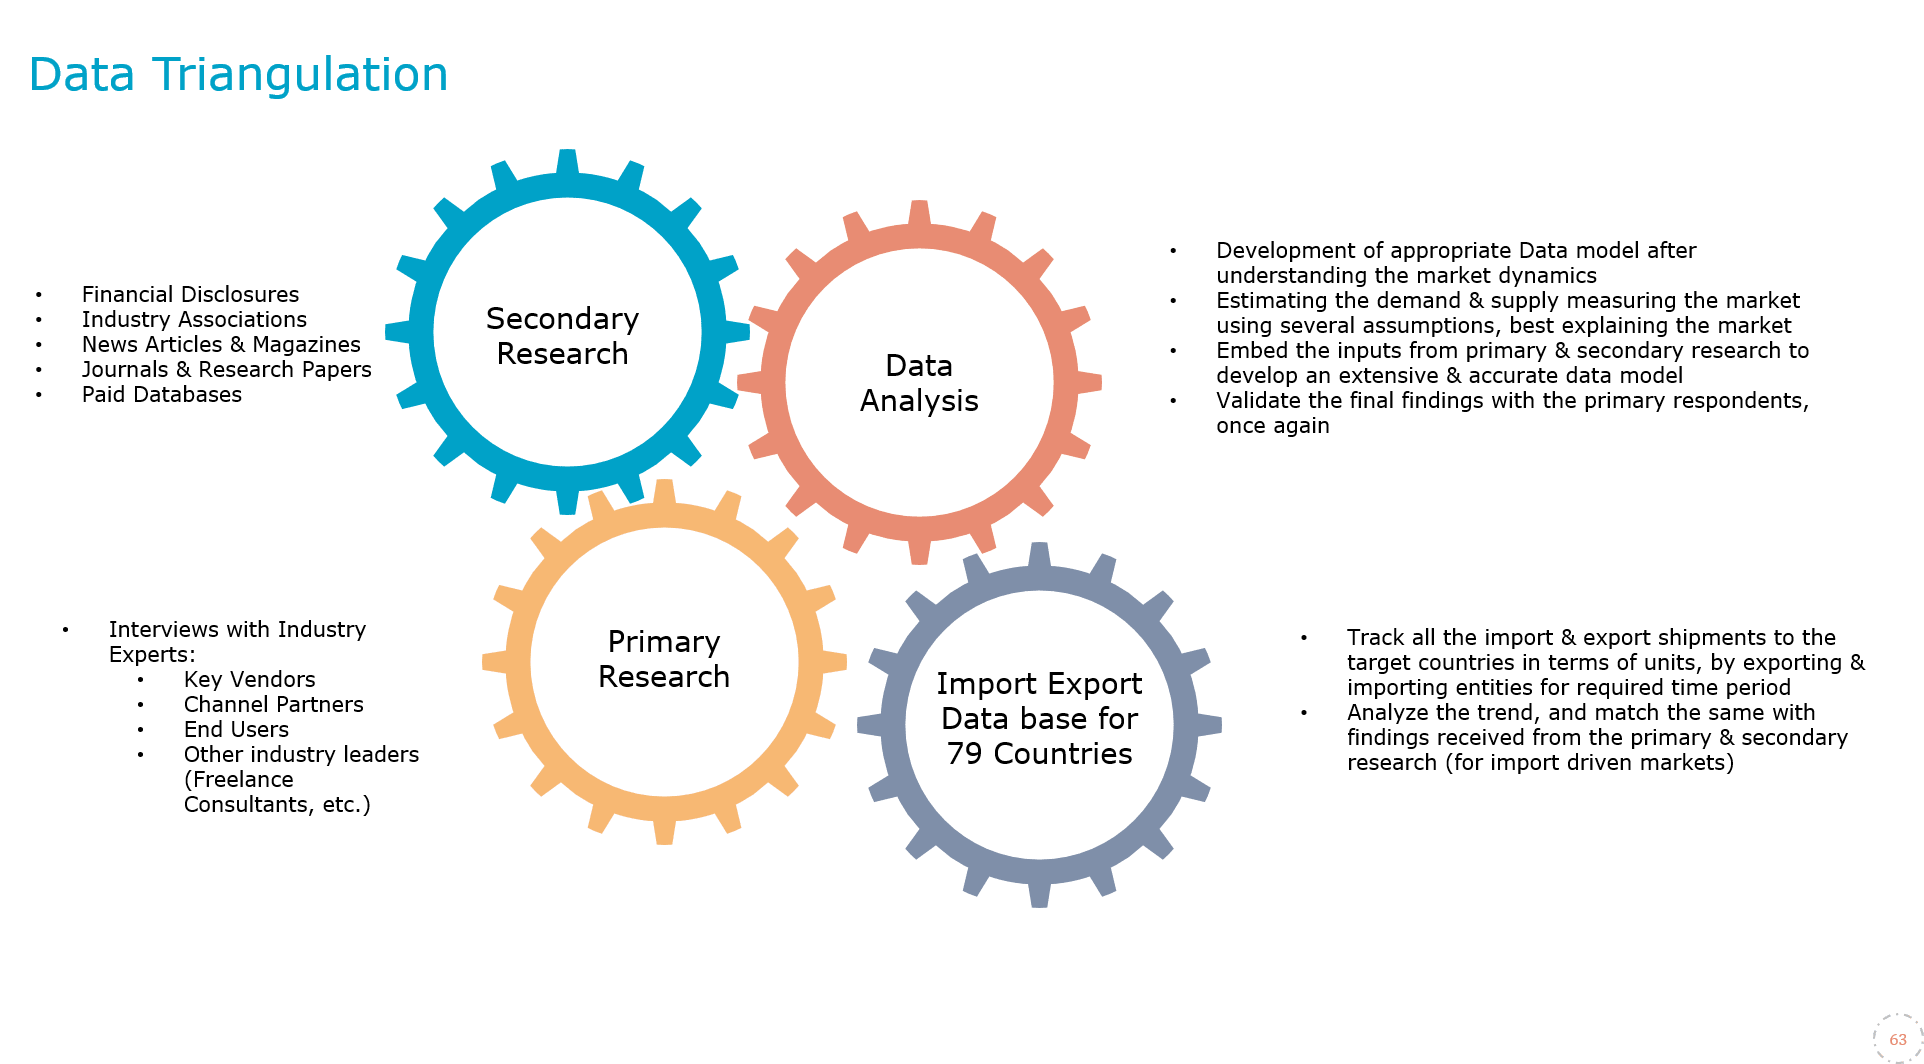
4. Data Forecast and FinalizationThe final phase involves forecasting future market trends based on the analyzed data. MarkNtel Advisors utilize predictive modeling and time series analysis to anticipate market behaviors. The insights are then compiled into comprehensive reports, featuring visual aids like charts and graphs, and include strategic recommendations to inform client decision-making

