US Data Center Water Cooling Market Research Report: Trends & Forecast (2026-2032)
By Product Type (Chillers, Cooling Towers, Cooling Distribution Units (CDUs), Heat Exchangers, Chilled-Water CRAHs, Pumps & Water Circulation Systems, Water Treatment & Filtration ... Equipment, Other Equipment), By Technology (Chilled-Water Cooling, Evaporative & Adiabatic Cooling, Direct-to-Chip Liquid Cooling, Other Water-Based Cooling Technologies), By Service Type (Installation & Commissioning, Maintenance & Repair, Water Treatment & Management Services, Other Services), By Data Center Type (Hyperscale Data Centers, Colocation Data Centers, Enterprise Data Centers, Edge Data Centers), By End-User Vertical (IT & Cloud Services, BFSI, Healthcare & Life Sciences, Government & Defense, Telecommunications, Other Verticals), and others Read more
- Environment
- Aug 2026
- Pages 145
- Report Format: PDF, Excel, PPT
US Data Center Water Cooling Market
Projected 16.5% CAGR from 2026 to 2032
Study Period
2026-2032
Market Size (2026)
USD 3.21 Billion
Market Size (2032)
USD 8.05 Billion
Base Year
2025
Projected CAGR
16.5%
Leading Segments
By Product Type: Chillers
US Data Center Water Cooling Market Key Takeaways
- The US data center water cooling market was valued at USD 2.63 billion in 2025 and is projected to grow from USD 3.21 billion in 2026 to USD 8.05 billion by 2032.
- The industry is projected to witness steady growth at a CAGR of 16.5% during 2026–2032.
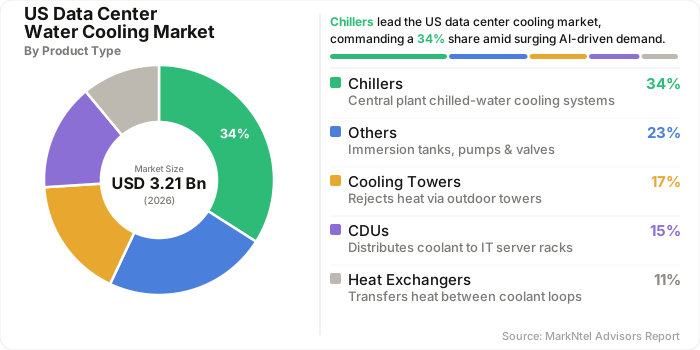
- Chillers remain the dominant product segment, accounting for an estimated 34.0% share in 2026.
- IT & Cloud Services lead the end-user segment, accounting for an estimated 48.5% share in 2026.
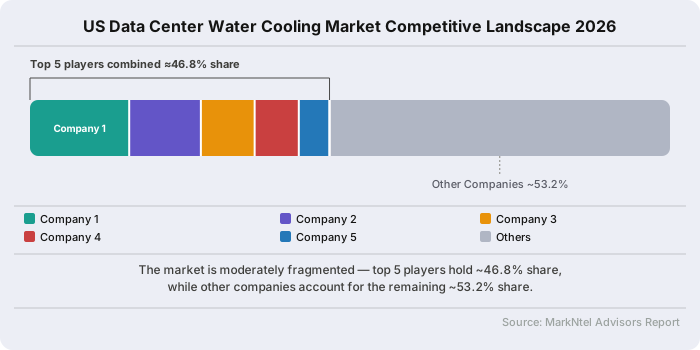
- The market is moderately fragmented, with the top players collectively accounting for an estimated 46.8% share in 2026.
US Data Center Water Cooling Market Size and Outlook
The United States data center water cooling market was valued at USD 2.63 billion in 2025 and is projected to grow from USD 3.21 billion in 2026 to USD 8.05 billion by 2032, registering a CAGR of 16.5% during 2026–2032. The market is supported by increasing deployment of high-density computing infrastructure and the transition toward liquid-based thermal management in AI-focused data centers.
According to the U.S. Department of Energy’s Federal Energy Management Program, the 2024 update to its Best Practices Guide for Energy-Efficient Data Center Design expands guidance to data centers with higher rack power densities and liquid-cooling systems, reflecting the industry's shift toward advanced thermal-management architectures. This development strengthens the technical case for water-based cooling equipment as AI workloads increase rack-level heat loads.
The Interstate Commission on the Potomac River Basin, data centers are projected to account for 25% of Washington Metropolitan Area water consumption by 2035, compared with 8% in 2025. The projected increase highlights the growing water-management challenge around major data-center clusters and supports investment in more efficient cooling infrastructure, including closed-loop and lower-water-consumption systems.
US Data Center Water Cooling Market Key Indicators
- As per the U.S. Department of Energy's Lawrence Berkeley National Laboratory, the installed base of data-center storage devices is projected to reach nearly 340 million drives by 2028, while the share of flash storage increases from 25% in 2023 to 41% in 2028. The growing storage infrastructure increases equipment density and electricity consumption, supporting additional cooling requirements across data-center facilities.
- According to Lawrence Berkeley National Laboratory, 8-GPU servers are projected to surpass 5 kW in annual average power by 2026, while an example NVIDIA B100-class server configuration reaches a rated power of 12.2 kW. The increasing power density of AI servers translates into greater heat-rejection requirements, accelerating the deployment of liquid cooling, CDUs, heat exchangers, and chilled-water systems.
- The U.S. Department of Energy's Lawrence Berkeley National Laboratory, hyperscale and colocation facilities housed approximately 74% of U.S. data-center servers in 2023, with this share projected to reach 85% by 2028.4 The concentration of servers in large-scale facilities supports greater deployment of centralized chillers, cooling distribution units, water circulation systems, and other high-capacity cooling infrastructure.
- According to U.S. Census Bureau data, U.S. data-center construction spending reaches an annualized USD 41 billion in 2025, representing a 32% year-over-year increase and a 344% increase from 2020. The rapid expansion of physical data-center infrastructure enlarges the installed base requiring cooling systems and creates additional opportunities for chillers, CDUs, heat exchangers, pumps, and water-cooling equipment.
US Data Center Water Cooling Market Scope
| Category | Segments |
|---|---|
| By Product Type | Chillers, Cooling Towers, Cooling Distribution Units (CDUs), Heat Exchangers, Chilled-Water CRAHs, Pumps & Water Circulation Systems, Water Treatment & Filtration Equipment, Other Equipment |
| By Technology | Chilled-Water Cooling, Evaporative & Adiabatic Cooling, Direct-to-Chip Liquid Cooling, Other Water-Based Cooling Technologies |
| By Service Type | Installation & Commissioning, Maintenance & Repair, Water Treatment & Management Services, Other Services |
| By Data Center Type | Hyperscale Data Centers, Colocation Data Centers, Enterprise Data Centers, Edge Data Centers |
| By End-User Vertical | IT & Cloud Services, BFSI, Healthcare & Life Sciences, Government & Defense, Telecommunications, Other Verticals |
US Data Center Water Cooling Market Growth Driver
Growing Adoption of High-Thermal-Density AI Hardware
The market growth is driven by the increasing deployment of high-performance CPUs and GPUs that generate substantial heat as AI workloads become more compute-intensive. For instance, NVIDIA’s GB200 NVL72 integrates 72 Blackwell GPUs and 36 Grace CPUs in a rack-scale, liquid-cooled architecture designed for large-scale AI training and inference. This increasing rack density is accelerating demand for direct-to-chip cooling, cooling distribution units (CDUs), heat exchangers, and chilled-water infrastructure.
The growing thermal requirements of AI hardware are also encouraging data-center operators to adopt more efficient liquid-cooling technologies. For instance, Supermicro’s liquid-cooled NVIDIA HGX H100 platform incorporates an 80 kW CDU and reports up to 40% lower data-center power consumption compared with air-cooled installations. In addition, Supermicro’s DLC-2 platform supports liquid inlet temperatures of up to 45°C, enabling lower water consumption and reducing dependence on mechanical chilling. These developments are increasing the adoption of advanced water-cooling infrastructure across U.S. hyperscale, colocation, and enterprise data centers.
Recent Trend
Growing Adoption of Closed-Loop Direct-to-Chip Cooling Reduces Water Consumption
Data-center operators are increasingly adopting closed-loop liquid cooling to support high-density AI workloads while reducing dependence on evaporative cooling. According to Microsoft, its average data-center Water Usage Effectiveness (WUE) improves to 0.27 L/kWh in 2025, compared with 2.3 L/kWh in its early data-center generations. Approximately 90% of its owned data-center fleet in 2025 operates with low- to zero-water cooling systems, while its newer AI facilities use closed-loop direct-to-chip cooling without operational water evaporation.1 This shift is increasing demand for efficient liquid-cooling infrastructure.
The trend is also translating into higher-capacity commercial cooling equipment. For instance, Modine expanded its Airedale coolant distribution unit portfolio in March 2025 from its initial 1 MW configuration to a standardized range of 400 kW to 2 MW, specifically responding to growing demand for direct-to-chip cooling in hyperscale, colocation, and edge data centers. Microsoft further reports that its Fairwater AI data centers support approximately 140 kW per rack and 1,360 kW per row through facility-wide closed-loop liquid cooling. These developments are accelerating demand for CDUs, heat exchangers, pumps, manifolds, and facility-side water-cooling systems.
The US Data Center Water Cooling Market Opportunities and Challenges
Regional Water Stress Creates Demand for Water-Efficient Cooling Infrastructure
Data-center clusters in water-constrained regions are facing increasing pressure to limit potable-water consumption as AI infrastructure expands. According to an analysis of Loudoun County records by the Piedmont Environmental Council, potable-water consumption by data centers, excluding reclaimed-water use, reaches nearly 952 million gallons in 2025, representing approximately a threefold increase over four years.1 The rising demand places greater pressure on hyperscale and colocation operators to reduce freshwater dependence and adopt lower-withdrawal cooling architectures.
This challenge is creating an opportunity for closed-loop liquid cooling, CDUs, and water-efficient thermal-management equipment that can reduce makeup-water requirements while supporting high-density AI workloads. For instance, Modine Manufacturing has committed approximately USD 100 million to expand its U.S. liquid-cooling manufacturing capacity, strengthening its ability to supply CDUs and related thermal-management systems. The expansion supports faster deployment of closed-loop cooling infrastructure, linking regional water constraints with growing demand for advanced water-cooling equipment across U.S. data-center clusters.
Segmentation Insights
High-Capacity Thermal Infrastructure Positions Chillers at the Core of Data Center Cooling
Chillers command the largest share of the United States data center water cooling industry, at an estimated 34.0% in 2026. They serve as the primary cooling source in centralized chilled-water plants, supplying CRAHs, heat exchangers, and CDUs. According to the U.S. Department of Energy, U.S. data-center electricity consumption is projected to reach 325–580 TWh by 2028, increasing the thermal load requiring removal. This expansion supports continued investment in high-capacity and redundant chiller systems across hyperscale and AI-focused facilities.
Chillers generate the highest revenue because large data centers require multiple high-capacity units, while the rapid expansion of AI infrastructure is increasing cooling requirements per facility. A new factor supporting future chiller demand is the shift toward higher-temperature chilled-water operation, which improves system efficiency and reduces dependence on mechanical cooling. Johnson Controls' YORK YDAM platform provides up to 3.5 MW of cooling capacity for high-density, multistory data centers, demonstrating the industry's move toward larger, space-efficient chiller systems. This trend creates opportunities for high-capacity, energy-efficient chiller upgrades and retrofits. Based on product type, the industry is segmented into:
- Chillers
- Cooling Towers
- Cooling Distribution Units (CDUs)
- Heat Exchangers
- Chilled-Water CRAHs
- Pumps & Water Circulation Systems
- Water Treatment & Filtration Equipment
- Others`
AI-Driven Compute Expansion Makes IT & Cloud Services the Cooling Demand Engine
IT & Cloud Services command the largest share of the US data center water cooling industry, at an estimated 48.5% in 2026. The dominance reflects the concentration of hyperscale cloud and AI infrastructure within this end-user group, where operators continuously expand computing capacity to support cloud services, AI models, and data-intensive applications. Microsoft, for instance, operates more than 400 data centers across 70 regions and added more than 2 GW of new capacity in FY2025. This expanding infrastructure directly supports demand for advanced cooling systems.
The growth of AI and cloud infrastructure is expected to sustain IT & Cloud Services as the largest cooling-demand end user. DOE estimates that U.S. data-center power demand could reach approximately 80 GW by 2030, compared with 25 GW in 2024, reflecting substantial capacity expansion to support AI and digital services. As new hyperscale facilities and AI-focused campuses are deployed, operators require larger and more efficient chillers, CDUs, heat exchangers, pumps, and water-circulation systems, creating significant opportunities for water-cooling equipment suppliers through 2032. By the end-user segmentation, the industry is segmented into:
- IT & Cloud Services
- BFSI
- Healthcare & Life Sciences
- Government & Defense
- Telecommunications
- Other Verticals
US Data Center Water Cooling Market Competitive Analysis
The US Data Center Water Cooling Market is moderately fragmented, with the top five companies collectively holding an estimated 46.8% share in 2026 (analyst-derived estimate). Leadership is driven by proprietary CDU and cold-plate engineering, broad portfolio integration across power and thermal systems, deep original-equipment-manufacturer partnerships with AI accelerator vendors, and long-term facility service and maintenance contracts with hyperscale operators.
Top Companies in the US Data Center Water Cooling industry:
- Vertiv Group Corp.
- Schneider Electric SE
- Johnson Controls International plc
- STULZ GmbH
- Rittal GmbH & Co. KG
- Mitsubishi Electric Corporation
- Trane Technologies plc
- Carrier Global Corporation
- Daikin Industries, Ltd.
- Modine Manufacturing Company
The US Data Center Water Cooling Industry News and Recent Developments
February 2026: Johnson Controls Launches YORK YDAM High-Density Chiller19
Johnson Controls launched the YORK YDAM air-cooled magnetic-bearing centrifugal chiller for high-density, multistory data centers and AI factories. The system provides up to 3.5 MW of cooling capacity and up to 20% greater capacity density than competing solutions, while using no onsite cooling water. The product is designed to reduce footprint and support high-density thermal loads.
Impact Analysis: The launch strengthens the supplier's high-density chiller portfolio and demonstrates how data-center operators are balancing water availability, land constraints, and thermal capacity. It also increases competitive pressure on conventional chiller suppliers to improve capacity density and efficiency.
October 2024: Schneider Electric Acquires Motivair to Expand Cold Plate and CDU Manufacturing Capabilities
Schneider Electric completed its acquisition of Motivair Corporation for approximately USD 850 million, adding cold plate technology and coolant distribution unit manufacturing to its data center infrastructure portfolio. The acquisition strengthens Schneider's ability to deliver integrated liquid cooling systems directly to hyperscale and colocation customers deploying high-density AI accelerator racks.
Impact Analysis: The acquisition consolidates cold-plate and CDU manufacturing under a top-tier power-and-cooling infrastructure vendor, intensifying competition with other integrated suppliers and accelerating the availability of factory-integrated liquid cooling systems for hyperscale AI deployments across the US market.
November 2025: Vertiv Agrees to Acquire Purge Rite for Approximately USD 1.0 Billion
Vertiv announced an agreement to acquire Purge Rite Intermediate for approximately USD 1.0 billion in cash, with up to USD 250 million in additional earn-out, to enhance its liquid cooling and thermal-management services for AI and high-performance data centers.
Impact Analysis: The acquisition expands Vertiv's service-side liquid cooling capabilities, strengthening recurring commissioning, flushing, and maintenance revenue streams tied to CDU and cold-plate deployments, and reinforcing its position as a leading integrated liquid cooling infrastructure and services provider in the US market.
Frequently Asked Questions
- Market Segmentation
- Introduction
- Product Definition
- Research Process
- Assumptions
- Executive Summary
- US Data Center Water Cooling Market Policies, Regulations, and Product Standards
- US Data Center Water Cooling Market Trends & Developments
- US Data Center Water Cooling Market Dynamics
- Growth Factors
- Challenges
- US Data Center Water Cooling Market Hotspot & Opportunities
- US Data Center Water Cooling Market Outlook, 2022-2032
- Market Size & Outlook
- By Revenues (USD Million)
- Market Share & Analysis
- By Product Type- Market Size & Forecast 2022-2032, USD Million
- Chillers
- Cooling Towers
- Cooling Distribution Units (CDUs)
- Heat Exchangers
- Chilled-Water CRAHs
- Pumps & Water Circulation Systems
- Water Treatment & Filtration Equipment
- Other Equipment
- By Technology- Market Size & Forecast 2022-2032, USD Million
- Chilled-Water Cooling
- Evaporative & Adiabatic Cooling
- Direct-to-Chip Liquid Cooling
- Other Water-Based Cooling Technologies
- By Service Type- Market Size & Forecast 2022-2032, USD Million
- Installation & Commissioning
- Maintenance & Repair
- Water Treatment & Management Services
- Other Services
- By Data Center Type- Market Size & Forecast 2022-2032, USD Million
- Hyperscale Data Centers
- Colocation Data Centers
- Enterprise Data Centers
- Edge Data Centers
- By End-User Vertical- Market Size & Forecast 2022-2032, USD Million
- IT & Cloud Services
- BFSI
- Healthcare & Life Sciences
- Government & Defense
- Telecommunications
- Other Verticals
- By Region- Market Size & Forecast 2022-2032, USD Million
- Northeast
- Midwest
- South
- West
- By Company
- Competition Characteristics
- Market Share & Analysis
- By Product Type- Market Size & Forecast 2022-2032, USD Million
- Market Size & Outlook
- US Chillers Market Outlook, 2022-2032
- Market Size & Outlook
- By Revenues (USD Million)
- Market Segmentation & Analysis
- By Technology- Market Size & Forecast 2022-2032, USD Million
- By Service Type- Market Size & Forecast 2022-2032, USD Million
- By Data Center Type- Market Size & Forecast 2022-2032, USD Million
- By End-User Vertical- Market Size & Forecast 2022-2032, USD Million
- By Region- Market Size & Forecast 2022-2032, USD Million
- Market Size & Outlook
- US Cooling Towers Market Outlook, 2022-2032
- Market Size & Outlook
- By Revenues (USD Million)
- Market Segmentation & Analysis
- By Technology- Market Size & Forecast 2022-2032, USD Million
- By Service Type- Market Size & Forecast 2022-2032, USD Million
- By Data Center Type- Market Size & Forecast 2022-2032, USD Million
- By End-User Vertical- Market Size & Forecast 2022-2032, USD Million
- By Region- Market Size & Forecast 2022-2032, USD Million
- Market Size & Outlook
- US Cooling Distribution Units (CDUs) Market Outlook, 2022-2032
- Market Size & Outlook
- By Revenues (USD Million)
- Market Segmentation & Analysis
- By Technology- Market Size & Forecast 2022-2032, USD Million
- By Service Type- Market Size & Forecast 2022-2032, USD Million
- By Data Center Type- Market Size & Forecast 2022-2032, USD Million
- By End-User Vertical- Market Size & Forecast 2022-2032, USD Million
- By Region- Market Size & Forecast 2022-2032, USD Million
- Market Size & Outlook
- US Heat Exchangers Market Outlook, 2022-2032
- Market Size & Outlook
- By Revenues (USD Million)
- Market Segmentation & Analysis
- By Technology- Market Size & Forecast 2022-2032, USD Million
- By Service Type- Market Size & Forecast 2022-2032, USD Million
- By Data Center Type- Market Size & Forecast 2022-2032, USD Million
- By End-User Vertical- Market Size & Forecast 2022-2032, USD Million
- By Region- Market Size & Forecast 2022-2032, USD Million
- Market Size & Outlook
- US Chilled-Water CRAHs Market Outlook, 2022-2032
- Market Size & Outlook
- By Revenues (USD Million)
- Market Segmentation & Analysis
- By Technology- Market Size & Forecast 2022-2032, USD Million
- By Service Type- Market Size & Forecast 2022-2032, USD Million
- By Data Center Type- Market Size & Forecast 2022-2032, USD Million
- By End-User Vertical- Market Size & Forecast 2022-2032, USD Million
- By Region- Market Size & Forecast 2022-2032, USD Million
- Market Size & Outlook
- US Pumps & Water Circulation Systems Market Outlook, 2022-2032
- Market Size & Outlook
- By Revenues (USD Million)
- Market Segmentation & Analysis
- By Technology- Market Size & Forecast 2022-2032, USD Million
- By Service Type- Market Size & Forecast 2022-2032, USD Million
- By Data Center Type- Market Size & Forecast 2022-2032, USD Million
- By End-User Vertical- Market Size & Forecast 2022-2032, USD Million
- By Region- Market Size & Forecast 2022-2032, USD Million
- Market Size & Outlook
- US Water Treatment & Filtration Equipment Systems Market Outlook, 2022-2032
- Market Size & Outlook
- By Revenues (USD Million)
- Market Segmentation & Analysis
- By Technology- Market Size & Forecast 2022-2032, USD Million
- By Service Type- Market Size & Forecast 2022-2032, USD Million
- By Data Center Type- Market Size & Forecast 2022-2032, USD Million
- By End-User Vertical- Market Size & Forecast 2022-2032, USD Million
- By Region- Market Size & Forecast 2022-2032, USD Million
- Market Size & Outlook
- US Data Center Water Cooling Market Key Strategic Imperatives for Success & Growth
- Competitive Outlook
- Company Profiles
- Vertiv Group Corp.
- Business Description
- Product Portfolio
- Collaborations & Alliances
- Recent Developments
- Financial Details
- Others
- Schneider Electric SE
- Business Description
- Product Portfolio
- Collaborations & Alliances
- Recent Developments
- Financial Details
- Others
- Johnson Controls International plc
- Business Description
- Product Portfolio
- Collaborations & Alliances
- Recent Developments
- Financial Details
- Others
- STULZ GmbH
- Business Description
- Product Portfolio
- Collaborations & Alliances
- Recent Developments
- Financial Details
- Others
- Rittal GmbH & Co. KG
- Business Description
- Product Portfolio
- Collaborations & Alliances
- Recent Developments
- Financial Details
- Others
- Mitsubishi Electric Corporation
- Business Description
- Product Portfolio
- Collaborations & Alliances
- Recent Developments
- Financial Details
- Others
- Trane Technologies plc
- Business Description
- Product Portfolio
- Collaborations & Alliances
- Recent Developments
- Financial Details
- Others
- Carrier Global Corporation
- Business Description
- Product Portfolio
- Collaborations & Alliances
- Recent Developments
- Financial Details
- Others
- Daikin Industries, Ltd.
- Business Description
- Product Portfolio
- Collaborations & Alliances
- Recent Developments
- Financial Details
- Others
- Modine Manufacturing Company
- Business Description
- Product Portfolio
- Collaborations & Alliances
- Recent Developments
- Financial Details
- Others
- Vertiv Group Corp.
- Company Profiles
- Disclaimer
MarkNtel Advisors follows a robust and iterative research methodology designed to ensure maximum accuracy and minimize deviation in market estimates and forecasts. Our approach combines both bottom-up and top-down techniques to effectively segment and quantify various aspects of the market. A consistent feature across all our research reports is data triangulation, which examines the market from three distinct perspectives to validate findings. Key components of our research process include:
1. Scope & Research Design At the outset, MarkNtel Advisors define the research objectives and formulate pertinent questions. This phase involves determining the type of research—qualitative or quantitative—and designing a methodology that outlines data collection methods, target demographics, and analytical tools. They also establish timelines and budgets to ensure the research aligns with client goals.
2. Sample Selection and Data Collection In this stage, the firm identifies the target audience and determines the appropriate sample size to ensure representativeness. They employ various sampling methods, such as random or stratified sampling, based on the research objectives. Data collection is carried out using tools like surveys, interviews, and observations, ensuring the gathered data is reliable and relevant.
3. Data Analysis and Validation Once data is collected, MarkNtel Advisors undertake a rigorous analysis process. This includes cleaning the data to remove inconsistencies, employing statistical software for quantitative analysis, and thematic analysis for qualitative data. Validation steps are taken to ensure the accuracy and reliability of the findings, minimizing biases and errors.

4. Data Forecast and FinalizationThe final phase involves forecasting future market trends based on the analyzed data. MarkNtel Advisors utilize predictive modeling and time series analysis to anticipate market behaviors. The insights are then compiled into comprehensive reports, featuring visual aids like charts and graphs, and include strategic recommendations to inform client decision-making
We offer flexible licensing options to cater to varying organizational needs. Choose the pricing pack that best suits your requirements:
Buy Now Inquire Before Buying
 Request Customization
 Talk to our Consultant