Renewable Energy Market Research Report: Forecast (2026-2032)
By Source (Solar Energy, Wind Energy, Hydropower, Bioenergy, Others), By Application (Power Generation, Heating & Cooling, Transportation Fuels), By End User (Residential, Commerci ... al, Industrial), and others Read more
- Energy
- Jul 2026
- Pages 338
- Report Format: PDF, Excel, PPT
Renewable Energy Market
Projected 12.9% CAGR from 2026 to 2032
Study Period
2026-2032
Market Size (2026)
USD 2.78 Trillion
Market Size (2032)
USD 5.78 Trillion
Largest Region
Asia Pacific
Projected CAGR
12.9%
Leading Segments
By Source Type: Solar Energy
Renewable Energy Market Key Takeaways
- The Global Renewable Energy Market was valued at USD 1.88 Trillion in 2025 and is projected to grow from USD 2.78 Trillion in 2026 to USD 5.78 Trillion by 2032. registering a strong CAGR of 12.9% during 2026–2032.
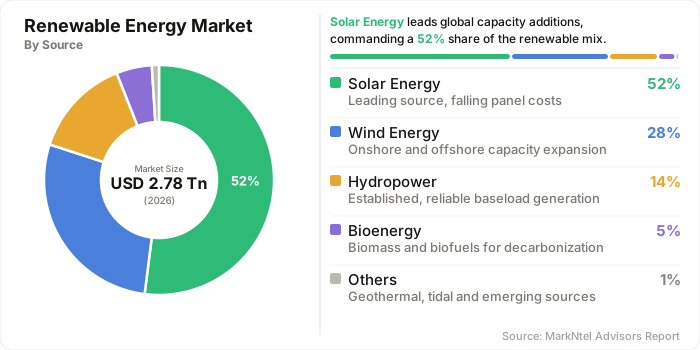
- By source, Solar Energy dominates the market with 52% share in 2026.
- By end user, the Industrial segment leads the market with 55% share in 2026.
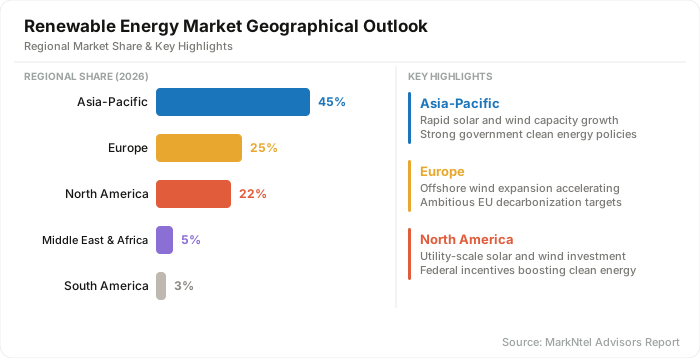
- Asia Pacific holds the largest regional share of 45% in 2026.
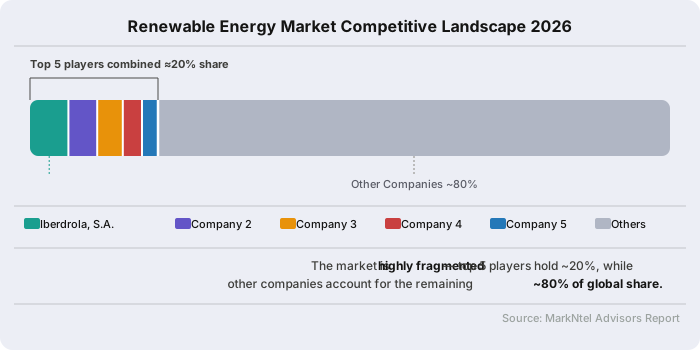
- The competitive landscape remains highly fragmented, with the top 5 players accounting for only 2% of total market share.
Renewable Energy Market Size & Outlook
The Global Renewable Energy Market was valued at USD 1.88 Trillion in 2025 and is projected to grow from USD 2.78 Trillion in 2026 to USD 5.78 Trillion by 2032. The industry is projected to witness steady growth at a CAGR of 12.9% during the forecast period, driven by large-scale clean energy deployment, electrification trends, and global decarbonization commitments. The market growth is primarily supported by accelerating investments in solar, wind, and grid modernization infrastructure across major economies, reinforcing the shift toward renewable power generation systems and low-carbon energy transition frameworks.
The expansion trajectory is strongly supported by rising global clean energy investment flows and structural energy reallocation. According to the International Energy Agency (IEA), global energy investment in clean technologies reached nearly USD 1.7 trillion in 2024, with renewable generation assets accounting for the majority share. This reflects a decisive shift in capital allocation away from fossil fuel dependency toward utility-scale renewable projects, distributed generation systems, and integrated energy storage solutions, driven by long-term energy security and sustainability goals.
Market momentum is further reinforced by rapidly increasing installed renewable capacity across major regions. According to the International Renewable Energy Agency (IRENA), global renewable energy capacity surpassed 3,870 GW in 2024, led by solar PV and wind energy expansion. This surge highlights accelerating deployment intensity, particularly in Asia Pacific, where China and India are scaling large renewable corridors and hybrid energy projects. The growing penetration of clean energy infrastructure development is significantly reshaping global power systems, increasing reliance on flexible grid networks and storage-enabled renewable integration.
The outlook is further strengthened by the structural transformation of electricity systems worldwide. As electrification of transport, industrial processes, and digital infrastructure accelerates, renewable energy is expected to dominate incremental power capacity additions through 2030. This transition is reinforcing the adoption of hybrid renewable systems, smart grid technologies, and cross-border energy trade mechanisms, positioning the global renewable energy market as the central pillar of future energy system transformation.
Renewable Energy Market Key Indicators
- According to IRENA, the global renewable power base reaches 5,149 GW at the end of 2025, with renewables accounting for 49% of total installed power capacity and 85.6% of annual global power additions. This confirms that renewable energy is no longer a niche buildout market; it is the dominant source of new capacity growth in the global power system.
- Based on IEA report, global renewable capacity additions reach 800 GW in 2025, rising 16% year on year, with solar PV contributing more than three-quarters of additions and wind about one-fifth. This indicates that solar remains the primary volume engine of the market, while wind continues to serve as the second major scaling technology.
- From IEA’s analysis World Energy Investment 2025, total energy investment rises to USD 3.3 trillion in 2025, while around USD 2.2 trillion flows into renewables, nuclear, grids, storage, low-emissions fuels, efficiency, and electrification about twice the capital allocated to oil, gas, and coal. This shows that the investment center of gravity continues shifting toward clean power and enabling infrastructure.
- As per OPEC, global oil demand growth remains forecast at 1.4 million barrels per day in 2025 and 1.4 million barrels per day in 2026. This persistent fossil-fuel demand keeps the transition market commercially relevant, because utilities and investors continue to face a parallel need for lower-carbon supply expansion and fuel diversification.
- According to the IAEA, global operational nuclear power capacity stands at 377 GW(e) across 417 reactors at the end of 2024, and nuclear electricity generation exceeds 417.5 TWh in 2024. This matters for renewable energy because nuclear remains an important firm low-carbon resource that supports grid balancing as variable renewables scale.
Renewable Energy Market Scope
| Category | Segments |
|---|---|
| By Source | Solar Energy, Wind Energy, Hydropower, Bioenergy, Others |
| By Application | Power Generation, Heating & Cooling, Transportation Fuels |
| By End User | Residential, Commercial, Industrial |
Renewable Energy Market Growth Driver
Rising Energy Security Concerns Accelerating Renewable Energy Deployment
Growing energy security concerns are prompting governments to accelerate investments in domestic renewable energy resources to reduce reliance on imported fossil fuels and strengthen long-term power system resilience. As geopolitical uncertainties and fuel price volatility continue to influence global energy markets, countries are prioritizing renewable energy investments, clean power infrastructure, and diversified electricity generation portfolios. According to the International Energy Agency (IEA), renewable energy is expected to account for the majority of new power capacity additions through 2030, supported by national energy security strategies and favorable policy frameworks across major economies.
The strategic importance of renewable energy is also reflected in global investment patterns. As per IEA, solar energy investment alone is projected to reach approximately USD 450 billion in 2025, making it the largest recipient of energy-sector capital globally. Governments and utilities are increasingly deploying utility-scale renewable projects, expanding renewable capacity expansion initiatives, and integrating solar-plus-storage projects to improve grid reliability. These developments are reinforcing renewable energy’s role as a critical pillar of economic stability, energy independence, and sustainable power generation worldwide.
Recent Trend
Government-Led Energy Transition Policies Accelerating Renewable Energy Deployment
Government-backed clean energy programs are emerging as a major trend shaping the global renewable energy market, as countries increasingly combine industrial policy, energy security objectives, and decarbonization targets to accelerate deployment. Rather than relying solely on incentives, governments are now introducing comprehensive frameworks covering project approvals, grid modernization, domestic manufacturing, and clean technology development. This policy-driven shift is strengthening clean energy deployment, expanding renewable infrastructure investments, and creating favorable conditions for large-scale renewable project execution across both developed and emerging economies.
The trend is becoming more evident through large-scale public funding commitments and national energy transition programs introduced during 2024–2026. According to the International Energy Agency (IEA), global spending on electricity grids is expected to exceed USD 400 billion in 2025 as governments prioritize transmission expansion and system flexibility to support growing renewable penetration. Simultaneously, major economies are increasing support for smart grid modernization, energy transition initiatives, and low-carbon industrial development through competitive auctions, manufacturing incentives, and public-private partnerships. These measures are accelerating renewable energy adoption while enhancing grid reliability and long-term power system resilience worldwide.
Renewable Energy Market Opportunities and Challenges
Rising Electricity Demand and Grid Infrastructure Constraints Creating Renewable Energy Opportunities
The rapid expansion of renewable energy projects is increasingly constrained by grid infrastructure limitations and interconnection delays. According to the International Energy Agency (IEA), around 1,650 GW of solar and wind projects worldwide remain in grid connection queues, reflecting growing pressure on transmission networks. As renewable deployment accelerates, grid integration challenges, transmission infrastructure constraints, and system congestion are delaying project commissioning in several major markets, creating a significant hurdle for renewable energy developers and utilities.
At the same time, rising electricity consumption is creating substantial growth opportunities for the renewable energy sector. The IEA projects global electricity demand to increase by nearly 4% annually through 2027, driven by industrial expansion, electrification, and data center development. To capitalize on this trend, GE Vernova introduced its GridOS platform in 2024 to enhance renewable integration and grid management. Growing demand for renewable power generation, distributed renewable energy systems, and smart grid solutions is expected to support long-term market expansion.
Renewable Energy Market Segmentation
Solar-Led Renewable Energy Mix Reshaping Global Power Generation Landscape
Solar energy dominates the global mix with an estimated 52% share, supported by sustained capacity expansion and strong policy-backed deployment. According to the International Energy Agency (IEA), global solar PV capacity reached nearly 2.2 TW in 2024, driven by large-scale installations across China, the United States, and India. This rapid expansion reflects accelerating renewable power generation buildout and the increasing role of solar in achieving national energy transition targets across major economies.
In terms of annual deployment momentum, solar PV contributes the majority of new renewable installations, adding approximately 500+ GW in 2024, significantly ahead of other clean energy technologies. This growth is supported by declining technology costs, improved grid integration, and rising utility-scale renewable projects globally. The expansion of hybrid solar-plus-storage systems further strengthens solar’s position as a central pillar of clean energy infrastructure development, particularly in high-demand electricity markets. Based on source type, the industry is segmented into:
- Solar Energy
- Wind Energy
- Hydropower
- Bioenergy
- Others
Industrial Electrification Driving Renewable Energy Demand Across Global End-Use Markets
The Industrial segment dominates the renewable energy market with an estimated 55% share, driven by large-scale decarbonization programs across energy-intensive industries such as steel, cement, chemicals, refining, and data centers. The IEA industry accounts for nearly 37% of global final energy use in 2024, making it the single largest end-use sector for electricity and heat demand. This structural demand base is increasingly being met through renewable power generation, corporate power purchase agreements (PPAs), and direct renewable sourcing, reinforcing industrial leadership in clean energy adoption.
This dominance is further strengthened by rapid corporate procurement and policy-backed electrification trends. In 2024, The American Clean Power Association (ACP) alone, the clean energy industry invested nearly USD 80 billion to deploy nearly 49 GW of new clean energy projects and build 45 manufacturing facilities, with industrial buyers representing a major share of these agreements. In addition, initiatives such as industrial hydrogen integration and electrified manufacturing processes are expanding renewable penetration in heavy industries. Growing adoption of clean energy procurement strategies and utility-scale renewable projects continues to position the industrial segment as the primary demand driver in the global renewable energy ecosystem. Based on End User industry is segmented into:
- Residential
- Commercial
- Industrial
Renewable Energy Market Geographical Outlook
The Asia Pacific, dominating region for the global renewable energy market accounts for approximately 45% of global market share, making it the dominant regional hub for clean energy expansion. According to China’s National Energy Administration (NEA), China’s renewable energy sector is valued at nearly USD 1.2 trillion in 2024, supported by large-scale investments in solar PV manufacturing, wind farms, and grid infrastructure. China added over 300 GW of renewable capacity in 2024, reinforcing its leadership in renewable power generation and utility-scale deployment across global energy markets.
India is also emerging as a major growth engine in the region, with the Ministry of New and Renewable Energy (MNRE) estimating its renewable energy market at around USD 120–130 billion in 2024. With installed capacity exceeding 190 GW, India continues to expand aggressively through solar parks, wind corridors, and hybrid projects supported by competitive auctions and policy incentives. Japan’s Ministry of Economy, Trade and Industry (METI) places its renewable energy market at approximately USD 90–100 billion in 2024, driven by offshore wind expansion, rooftop solar adoption, and hydrogen-based energy transition initiatives.
Collectively, Asia Pacific’s dominance is reinforced by strong country-level momentum and coordinated energy transition strategies. China leads in large-scale deployment, India accelerates capacity addition through cost-competitive procurement, and Japan focuses on advanced clean technologies. This synergy is strengthening clean energy infrastructure development and expanding utility-scale renewable projects, positioning Asia Pacific as the primary driver of global renewable energy growth and long-term market expansion.
Renewable Energy Market Competitive Analysis
The Global Renewable Energy Market is highly fragmented, with the top 5 companies holding only 2% market share, reflecting intense competition among utilities, independent power producers, and technology-driven renewable developers. Market leadership is shaped by large-scale project execution, offshore wind expansion, solar capacity buildout, and long-term power purchase agreements across major global regions. The competitive environment remains dynamic, with strong emphasis on utility-scale renewable projects, renewable energy developers, and diversified clean energy portfolios.
Leading Companies in the Global Renewable Energy Market
- Iberdrola
- Ørsted A/S
- NextEra Energy, Inc.
- Enel Green Power S.p.A.
- Vestas Wind Systems A/S
- Siemens Gamesa Renewable Energy
- General Electric (GE Vernova)
- Acciona S.A.
- Canadian Solar Inc.
- EDF Renewables
- Lightsource bp
- Adani Green Energy Limited
- Tata Power Renewable Energy Limited
- Enterprize Energy
- JSW Energy Limited
Renewable Energy Industry News and Recent Developments
2025 Iberdrola Accelerates Global Hybrid Renewable Expansion Strategy Across Wind, Solar, and Storage Assets
Iberdrola is expanding its diversified renewable portfolio across Europe, the UK, and international markets, with a strong focus on hybrid wind-solar projects and offshore wind development. The company is increasingly integrating energy storage systems to optimize asset performance and improve long-term grid stability across its operating regions.
Impact Analysis: This strategy reinforces Iberdrola’s position in utility-scale renewable projects and supports the transition toward multi-technology energy systems. The hybridization of assets improves efficiency, enhances energy dispatch flexibility, and strengthens resilience against market volatility, while supporting long-term decarbonization goals in key developed markets.
2025 Adani Green Energy Expands One of the World’s Largest Renewable Energy Parks in Gujarat, India
Adani Green Energy continues rapid expansion of its Khavda renewable energy park, targeting multi-gigawatt solar and wind capacity additions. The project is aligned with India’s national renewable energy targets and represents one of the largest integrated renewable infrastructure developments globally.
Impact Analysis: This expansion significantly boosts India’s position in utility-scale renewable projects and strengthens Asia Pacific’s dominance in global capacity additions. It also enhances domestic supply chain development, improves energy security, and accelerates large-scale deployment of solar and wind infrastructure, supporting long-term clean energy transition initiatives across the region.
Frequently Asked Questions
- Market Segmentation
- Introduction
- Product Definition
- Research Process
- Assumptions
- Executive Summary
- Global Renewable Energy Market Policies, Regulations, and Product Standards
- Global Renewable Energy Market Trends & Developments
- Global Renewable Energy Market Dynamics
- Growth Factors
- Challenges
- Global Renewable Energy Market Hotspot & Opportunities
- Global Renewable Energy Market Outlook, 2022-2032F
- Market Size & Outlook
- By Revenues (USD Million)
- By Installed Capacity (MW)
- Market Segmentation & Outlook
- By Source- Market Size & Forecast 2022-2032, USD Million & MW
- Solar Energy
- Wind Energy
- Hydropower
- Bioenergy
- Others
- By Application- Market Size & Forecast 2022-2032, USD Million & MW
- Power Generation
- Heating & Cooling
- Transportation Fuels
- By End User- Market Size & Forecast 2022-2032, USD Million & MW
- Residential
- Commercial
- Industrial
- By Region
- North America
- South America
- Europe
- Middle East & Africa
- Asia Pacific
- By Company
- Competition Characteristics
- Market Share & Analysis
- By Source- Market Size & Forecast 2022-2032, USD Million & MW
- Market Size & Outlook
- North America Renewable Energy Market Outlook, 2022-2032F
- Market Size & Outlook
- By Revenues (USD Million)
- By Installed Capacity (MW)
- Market Segmentation & Outlook
- By Source- Market Size & Forecast 2022-2032, USD Million & MW
- By Application- Market Size & Forecast 2022-2032, USD Million & MW
- By End User- Market Size & Forecast 2022-2032, USD Million & MW
- By Country
- The US
- Canada
- Mexico
- The US Renewable Energy Market Outlook, 2022-2032F
- Market Size & Outlook
- By Revenues (USD Million)
- By Installed Capacity (MW)
- Market Segmentation & Outlook
- By Source- Market Size & Forecast 2022-2032, USD Million & MW
- By Application- Market Size & Forecast 2022-2032, USD Million & MW
- By End User- Market Size & Forecast 2022-2032, USD Million & MW
- Market Size & Outlook
- Canada Renewable Energy Market Outlook, 2022-2032F
- Market Size & Outlook
- By Revenues (USD Million)
- By Installed Capacity (MW)
- Market Segmentation & Outlook
- By Source- Market Size & Forecast 2022-2032, USD Million & MW
- By Application- Market Size & Forecast 2022-2032, USD Million & MW
- By End User- Market Size & Forecast 2022-2032, USD Million & MW
- Market Size & Outlook
- Mexico Renewable Energy Market Outlook, 2022-2032F
- Market Size & Outlook
- By Revenues (USD Million)
- By Installed Capacity (MW)
- Market Segmentation & Outlook
- By Source- Market Size & Forecast 2022-2032, USD Million & MW
- By Application- Market Size & Forecast 2022-2032, USD Million & MW
- By End User- Market Size & Forecast 2022-2032, USD Million & MW
- Market Size & Outlook
- Market Size & Outlook
- South America Renewable Energy Market Outlook, 2022-2032F
- Market Size & Outlook
- By Revenues (USD Million)
- By Installed Capacity (MW)
- Market Segmentation & Outlook
- By Source- Market Size & Forecast 2022-2032, USD Million & MW
- By Application- Market Size & Forecast 2022-2032, USD Million & MW
- By End User- Market Size & Forecast 2022-2032, USD Million & MW
- By Country
- Brazil
- Argentina
- Chile
- Rest of South America
- Brazil Renewable Energy Market Outlook, 2022-2032F
- Market Size & Outlook
- By Revenues (USD Million)
- By Installed Capacity (MW)
- Market Segmentation & Outlook
- By Source- Market Size & Forecast 2022-2032, USD Million & MW
- By Application- Market Size & Forecast 2022-2032, USD Million & MW
- By End User- Market Size & Forecast 2022-2032, USD Million & MW
- Market Size & Outlook
- Argentina Renewable Energy Market Outlook, 2022-2032F
- Market Size & Outlook
- By Revenues (USD Million)
- By Installed Capacity (MW)
- Market Segmentation & Outlook
- By Source- Market Size & Forecast 2022-2032, USD Million & MW
- By Application- Market Size & Forecast 2022-2032, USD Million & MW
- By End User- Market Size & Forecast 2022-2032, USD Million & MW
- Market Size & Outlook
- Chile Renewable Energy Market Outlook, 2022-2032F
- Market Size & Outlook
- By Revenues (USD Million)
- By Installed Capacity (MW)
- Market Segmentation & Outlook
- By Source- Market Size & Forecast 2022-2032, USD Million & MW
- By Application- Market Size & Forecast 2022-2032, USD Million & MW
- By End User- Market Size & Forecast 2022-2032, USD Million & MW
- Market Size & Outlook
- Market Size & Outlook
- Europe Renewable Energy Market Outlook, 2022-2032F
- Market Size & Outlook
- By Revenues (USD Million)
- By Installed Capacity (MW)
- Market Segmentation & Outlook
- By Source- Market Size & Forecast 2022-2032, USD Million & MW
- By Application- Market Size & Forecast 2022-2032, USD Million & MW
- By End User- Market Size & Forecast 2022-2032, USD Million & MW
- By Country
- The UK
- Germany
- France
- Italy
- Spain
- Rest of Europe
- The UK Renewable Energy Market Outlook, 2022-2032F
- Market Size & Outlook
- By Revenues (USD Million)
- Market Segmentation & Outlook
- By Source- Market Size & Forecast 2022-2032, USD Million & MW
- By Application- Market Size & Forecast 2022-2032, USD Million & MW
- By End User- Market Size & Forecast 2022-2032, USD Million & MW
- Market Size & Outlook
- Germany Renewable Energy Market Outlook, 2022-2032F
- Market Size & Outlook
- By Revenues (USD Million)
- Market Segmentation & Outlook
- By Source- Market Size & Forecast 2022-2032, USD Million & MW
- By Application- Market Size & Forecast 2022-2032, USD Million & MW
- By End User- Market Size & Forecast 2022-2032, USD Million & MW
- Market Size & Outlook
- France Renewable Energy Market Outlook, 2022-2032F
- Market Size & Outlook
- By Revenues (USD Million)
- By Installed Capacity (MW)
- Market Segmentation & Outlook
- By Source- Market Size & Forecast 2022-2032, USD Million & MW
- By Application- Market Size & Forecast 2022-2032, USD Million & MW
- By End User- Market Size & Forecast 2022-2032, USD Million & MW
- Market Size & Outlook
- Italy Renewable Energy Market Outlook, 2022-2032F
- Market Size & Outlook
- By Revenues (USD Million)
- Market Segmentation & Outlook
- By Source- Market Size & Forecast 2022-2032, USD Million & MW
- By Application- Market Size & Forecast 2022-2032, USD Million & MW
- By End User- Market Size & Forecast 2022-2032, USD Million & MW
- Market Size & Outlook
- Spain Renewable Energy Market Outlook, 2022-2032F
- Market Size & Outlook
- By Revenues (USD Million)
- By Installed Capacity (MW)
- Market Segmentation & Outlook
- By Source- Market Size & Forecast 2022-2032, USD Million & MW
- By Application- Market Size & Forecast 2022-2032, USD Million & MW
- By End User- Market Size & Forecast 2022-2032, USD Million & MW
- Market Size & Outlook
- Market Size & Outlook
- Middle East & Africa Renewable Energy Market Outlook, 2022-2032F
- Market Size & Outlook
- By Revenues (USD Million)
- By Installed Capacity (MW)
- Market Segmentation & Outlook
- By Source- Market Size & Forecast 2022-2032, USD Million & MW
- By Application- Market Size & Forecast 2022-2032, USD Million & MW
- By End User- Market Size & Forecast 2022-2032, USD Million & MW
- By Country
- Saudi Arabia
- The UAE
- South Africa
- Rest of Middle East & Africa
- Saudi Arabia Renewable Energy Market Outlook, 2022-2032F
- Market Size & Outlook
- By Revenues (USD Million)
- Market Segmentation & Outlook
- By Source- Market Size & Forecast 2022-2032, USD Million & MW
- By Application- Market Size & Forecast 2022-2032, USD Million & MW
- By End User- Market Size & Forecast 2022-2032, USD Million & MW
- Market Size & Outlook
- The UAE Renewable Energy Market Outlook, 2022-2032F
- Market Size & Outlook
- By Revenues (USD Million)
- By Installed Capacity (MW)
- Market Segmentation & Outlook
- By Source- Market Size & Forecast 2022-2032, USD Million & MW
- By Application- Market Size & Forecast 2022-2032, USD Million & MW
- By End User- Market Size & Forecast 2022-2032, USD Million & MW
- Market Size & Outlook
- South Africa Renewable Energy Market Outlook, 2022-2032F
- Market Size & Outlook
- By Revenues (USD Million)
- By Installed Capacity (MW)
- Market Segmentation & Outlook
- By Source- Market Size & Forecast 2022-2032, USD Million & MW
- By Application- Market Size & Forecast 2022-2032, USD Million & MW
- By End User- Market Size & Forecast 2022-2032, USD Million & MW
- Market Size & Outlook
- Market Size & Outlook
- Asia Pacific Renewable Energy Market Outlook, 2022-2032F
- Market Size & Outlook
- By Revenues (USD Million)
- By Installed Capacity (MW)
- Market Segmentation & Outlook
- By Source- Market Size & Forecast 2022-2032, USD Million & MW
- By Application- Market Size & Forecast 2022-2032, USD Million & MW
- By End User- Market Size & Forecast 2022-2032, USD Million & MW
- By Country
- China
- Japan
- India
- South Korea
- Australia
- Rest of Asia-Pacific
- China Renewable Energy Market Outlook, 2022-2032F
- Market Size & Outlook
- By Revenues (USD Million)
- By Installed Capacity (MW)
- Market Segmentation & Outlook
- By Source- Market Size & Forecast 2022-2032, USD Million & MW
- By Application- Market Size & Forecast 2022-2032, USD Million & MW
- By End User- Market Size & Forecast 2022-2032, USD Million & MW
- Market Size & Outlook
- Japan Renewable Energy Market Outlook, 2022-2032F
- Market Size & Outlook
- By Revenues (USD Million)
- By Installed Capacity (MW)
- Market Segmentation & Outlook
- By Source- Market Size & Forecast 2022-2032, USD Million & MW
- By Application- Market Size & Forecast 2022-2032, USD Million & MW
- By End User- Market Size & Forecast 2022-2032, USD Million & MW
- Market Size & Outlook
- India Renewable Energy Market Outlook, 2022-2032F
- Market Size & Outlook
- By Revenues (USD Million)
- By Installed Capacity (MW)
- Market Segmentation & Outlook
- By Source- Market Size & Forecast 2022-2032, USD Million & MW
- By Application- Market Size & Forecast 2022-2032, USD Million & MW
- By End User- Market Size & Forecast 2022-2032, USD Million & MW
- Market Size & Outlook
- South Korea Renewable Energy Market Outlook, 2022-2032F
- Market Size & Outlook
- By Revenues (USD Million)
- By Installed Capacity (MW)
- Market Segmentation & Outlook
- By Source- Market Size & Forecast 2022-2032, USD Million & MW
- By Application- Market Size & Forecast 2022-2032, USD Million & MW
- By End User- Market Size & Forecast 2022-2032, USD Million & MW
- Market Size & Outlook
- Australia Renewable Energy Market Outlook, 2022-2032F
- Market Size & Outlook
- By Revenues (USD Million)
- By Installed Capacity (MW)
- Market Segmentation & Outlook
- By Source- Market Size & Forecast 2022-2032, USD Million & MW
- By Application- Market Size & Forecast 2022-2032, USD Million & MW
- By End User- Market Size & Forecast 2022-2032, USD Million & MW
- Market Size & Outlook
- Market Size & Outlook
- Global Renewable Energy Market Key Strategic Imperatives for Success & Growth
- Competitive Outlook
- Company Profiles
- Iberdrola, S.A.
- Business Description
- Product Portfolio
- Collaborations & Alliances
- Recent Developments
- Financial Details
- Others
- NextEra Energy, Inc.
- Business Description
- Product Portfolio
- Collaborations & Alliances
- Recent Developments
- Financial Details
- Others
- Ørsted A/S
- Business Description
- Product Portfolio
- Collaborations & Alliances
- Recent Developments
- Financial Details
- Others
- Vestas Wind Systems A/S
- Business Description
- Product Portfolio
- Collaborations & Alliances
- Recent Developments
- Financial Details
- Others
- GE Vernova Inc.
- Business Description
- Product Portfolio
- Collaborations & Alliances
- Recent Developments
- Financial Details
- Others
- Enel Green Power S.p.A.
- Business Description
- Product Portfolio
- Collaborations & Alliances
- Recent Developments
- Financial Details
- Others
- ACCIONA, S.A.
- Business Description
- Product Portfolio
- Collaborations & Alliances
- Recent Developments
- Financial Details
- Others
- Canadian Solar Inc.
- Business Description
- Product Portfolio
- Collaborations & Alliances
- Recent Developments
- Financial Details
- Others
- Adani Green Energy Limited
- Business Description
- Product Portfolio
- Collaborations & Alliances
- Recent Developments
- Financial Details
- Others
- Tata Power Renewable Energy Limited
- Business Description
- Product Portfolio
- Collaborations & Alliances
- Recent Developments
- Financial Details
- Others
- Brookfield Renewable Partners L.P.
- Business Description
- Product Portfolio
- Collaborations & Alliances
- Recent Developments
- Financial Details
- Others
- RWE Renewables GmbH
- Business Description
- Product Portfolio
- Collaborations & Alliances
- Recent Developments
- Financial Details
- Others
- ReNew Energy Global plc
- Business Description
- Product Portfolio
- Collaborations & Alliances
- Recent Developments
- Financial Details
- Others
- ACWA Power Company
- Business Description
- Product Portfolio
- Collaborations & Alliances
- Recent Developments
- Financial Details
- Others
- Iberdrola, S.A.
- Company Profiles
- Disclaimer
MarkNtel Advisors follows a robust and iterative research methodology designed to ensure maximum accuracy and minimize deviation in market estimates and forecasts. Our approach combines both bottom-up and top-down techniques to effectively segment and quantify various aspects of the market. A consistent feature across all our research reports is data triangulation, which examines the market from three distinct perspectives to validate findings. Key components of our research process include:
1. Scope & Research Design At the outset, MarkNtel Advisors define the research objectives and formulate pertinent questions. This phase involves determining the type of research—qualitative or quantitative—and designing a methodology that outlines data collection methods, target demographics, and analytical tools. They also establish timelines and budgets to ensure the research aligns with client goals.
2. Sample Selection and Data Collection In this stage, the firm identifies the target audience and determines the appropriate sample size to ensure representativeness. They employ various sampling methods, such as random or stratified sampling, based on the research objectives. Data collection is carried out using tools like surveys, interviews, and observations, ensuring the gathered data is reliable and relevant.
3. Data Analysis and Validation Once data is collected, MarkNtel Advisors undertake a rigorous analysis process. This includes cleaning the data to remove inconsistencies, employing statistical software for quantitative analysis, and thematic analysis for qualitative data. Validation steps are taken to ensure the accuracy and reliability of the findings, minimizing biases and errors.

4. Data Forecast and FinalizationThe final phase involves forecasting future market trends based on the analyzed data. MarkNtel Advisors utilize predictive modeling and time series analysis to anticipate market behaviors. The insights are then compiled into comprehensive reports, featuring visual aids like charts and graphs, and include strategic recommendations to inform client decision-making
We offer flexible licensing options to cater to varying organizational needs. Choose the pricing pack that best suits your requirements:
Buy Now Inquire Before Buying
 Request Customization
 Talk to our Consultant