UAE Paints And Coatings Market Research Report: Forecast (2026-2032)
UAE Paints And Coatings Market - By Product Type (Sawdust Briquettes, Rice Husk Briquettes, Others), By Distribution Channel (Supermarkets/Hypermarkets, Online Retail, Specialty St...ores, Online Retail, Direct Industrial Supply, Others), By End User (Household, Commercial), and others Read more
- Chemicals
- Nov 2025
- Pages 138
- Report Format: PDF, Excel, PPT
UAE Paints And Coatings Market
Projected 8.05% CAGR from 2026 to 2032
Study Period
2026-2032
Market Size (2025)
USD 601 Million
Market Size (2032)
USD 885 Million
Base Year
2025
Projected CAGR
8.05%
Leading Segments
By Formulation: Water-borne
UAE Paints And Coatings Market Size: Forecast (2026- 2032)
The UAE Paints and Coatings Market size is valued at around USD 601 million in 2025 and is projected to reach USD 885 million by 2032. Along with this, the market is estimated to grow at a CAGR of around 8.05% during the forecast period, i.e., 2026-32.
UAE Paints And Coatings Market Key Takeaways:
- The UAE has a large and active construction pipeline driven by city masterplans and rapid real estate activity. Major developers are expanding in-house construction capacity to meet demand, which supports sustained consumption of decorative and protective paints across residential and commercial projects.
- Regulatory and policy push is shifting the market toward low-emission and local solutions. Municipal green building rules and emirate product certification requirements set maximum volatile organic compound limits for interior and exterior paints. National industrial programs and the Country Value scheme encourage local manufacture and procurement, which is expanding domestic coatings production and import substitution.
UAE Paints And Coatings Market Key Trends & Developments:
- May 30, 2025: Federal climate legislation requiring measurement, reporting, and verified emissions reduction became effective. The law increases compliance requirements for manufacturers and downstream users and accelerates the adoption of waterborne and other low-VOC technologies across the coatings value chain.
- August 26, 2024: A new powder coatings plant opened in the UAE to serve both domestic and export markets. The facility highlights industry moves to localize higher-value coating production and meet demand for durable, low-emission finishes, used in construction, aluminum systems, furniture, and industrial equipment.
UAE Paints And Coatings Market Scope:
| Category | Segments |
|---|---|
| By Product Type | Sawdust Briquettes, Rice Husk Briquettes, Others |
| By Distribution Channel | Supermarkets/Hypermarkets, Online Retail, Specialty Stores, Online Retail, Direct Industrial Supply, Others), |
| By End User | Household, Commercial), and others |
UAE Paints And Coatings Market Drivers:
Rapid Construction and Infrastructure Expansion
The UAE continues to invest heavily in large-scale infrastructure, commercial, and residential developments under national plans aimed at urban growth and tourism. This growing construction activity directly increases demand for architectural paints and coatings for interior and exterior surfaces. For instance, the UAE’s construction market size reached USD100.7 billion in 2023, making architectural coatings the single largest demand segment in the country.
Stricter Environmental and VOC Regulations
Municipal and federal regulations are enforcing tighter limits on volatile organic compounds in paints to improve indoor air quality and public health. Developers and public projects are required to use low-VOC or eco-friendly coatings. Dubai’s Green Building Regulations mandate that paints used in projects must comply with tested low-VOC standards. This regulatory push is compelling for manufacturers to reformulate and drive the adoption of premium and sustainable coatings.

UAE Paints And Coatings Market Trends:
Rapid shift to low VOC and sustainable coatings
UAE policy and corporate climate targets are pushing a fast shift from solvent-based to waterborne and powder coatings. Government net zero commitments and emirate-level green building rules make low-emission formulations a compliance necessity while health-conscious end users and international investors drive demand for certified products. Manufacturers are reformulating because tighter emissions rules raise the cost of non-compliant product lines and create premium opportunities for sustainable offerings. For instance, the Dubai Municipality Technical Guide for Paints and Varnishes sets VOC and heavy metal limits and requires certification for paints used in construction projects.
Localization of production and value chain integration
There is a clear industry move to localize higher-value coating manufacture and strengthen domestic supply chains to capture government procurement and reduce import risk. The “In Country Value Program” and industrial policy incentives make local production financially attractive, while construction backlog and developer strategies to bring work in-house create predictable demand for locally supplied coatings. The underlying reason is greater control of timelines and cost-plus national priorities to keep spending inside the economy. For instance, the UAE National In-Country Value program targets redirecting procurement to local manufacturing and services.
UAE Paints And Coatings Market Challenges:
Feedstock price volatility and import dependence
The paints and coatings industry in the UAE faces a major challenge from volatile global feedstock prices and heavy reliance on imported resins, pigments, and solvents, which squeeze margins and complicate planning. Petrochemical feedstock costs move with oil and gas markets and are sensitive to geopolitical shocks and shipping disruptions, which in turn raise input costs for local formulators. Smaller domestic producers have limited hedging capacity, so cost spikes force either margin erosion or price rises that slow project uptake. For instance, 2021 to 2022 had shortages of resin when PVDF and other resins surged in price and availability tightened worldwide.
UAE Paints And Coatings Market (2026-32) Segmentation Analysis
The UAE Paints and Coatings Market Report and Forecast 2026-2032 offers a detailed analysis of the market based on the following segments:
Based on Formulation
- Water borne
- Solvent borne
- Powder
- Radiation cured and other advanced chemistries
Water-borne coatings currently lead formulation technology in the UAE, with almost half the market by value in 2024. This lead emerges because regulations on volatile organic compounds make water-borne systems more compliant and attractive for architectural and interior applications. Additionally, end users prefer low odor and faster drying for residential and commercial projects in warm climates. For instance, the UAE paints and coatings market saw water-borne systems capture about 47.35% in 2024, per industry reports.
Based on Resin Chemistry
- Acrylic and latex systems
- Alkyd and enamel systems
- Epoxy systems
- Polyurethane systems
- Polyester and others
Acrylic resin systems are the top resin chemistry in the UAE’s paint and coating market because they deliver a strong balance of durability, UV resistance, gloss retention, and cost effectiveness, especially for exterior and decorative surfaces exposed to harsh sunlight. These resins are also well-suited to water-borne systems, thereby aligning with regulatory and environmental trends. For instance, acrylic resins accounted for about 46.27 percent of market share by resin type in 2024, according to credible sources.
Leading Manufacturers Of The UAE Paints And Coatings Market:
- National Paints Factories Co. Ltd.
National Paints is a regional powerhouse founded in Jordan in 1969 that has a large production facility in Sharjah, UAE. The Sharjah plant is among the largest in the Middle East, serving decorative automotive, marine, industrial, and wood coatings segments. National Paints is highly vertically integrated and expanding its powder coatings and protective coatings technology under certified quality schemes.
- Jotun UAE Ltd Llc
Jotun UAE is part of the global Norwegian group that offers decorative, protective marine, and powder coatings. It has manufacturing presence in Dubai and Abu Dhabi and enjoys a strong reputation for producing coatings adapted to local climatic conditions, such as high UV and humidity. Its local R&D and technical service capability make it a go-to for large infrastructure and landmark projects.
- Shaji Paints
Shaji Paints is a local UAE manufacturer with a production plant in Umm Al Quwain capable of producing a substantial volume of coatings every month. It supplies architectural, automotive, industrial coatings, and auto refinishes, plus wood coatings. It has multiple distribution centers for fast delivery and an in-house R&D lab for product development and quality testing.
AkzoNobel, Baltimore Paint Manufacturing LLC, Berger Paints Emirates Ltd., Caparol Paints LLC, Kansai Paint Middle East, MAS Paints, Uz Paints, and others are the key players of the UAE Paints and Coatings Market
UAE Paints And Coatings Market (2026-32): Region Projection
The market for Paints and Coatings in the UAE is dominated by Dubai and Abu Dhabi, owing to their concentration of high-value real estate, commercial projects, and infrastructure investments. Dubai’s rapid urban expansion and landmark developments like Dubai Creek Harbor and Al Maktoum City ingest large volumes of decorative and protective coatings. Abu Dhabi’s industrial zone growth and energy sector maintenance necessitate heavy use of corrosion-resistant and specialty coatings. For instance, the Khalifa Economic Zones in Abu Dhabi are creating localized demand for industrial coatings in adjacent facilities.
*Reports Delivery Format - Market research studies from MarkNtel Advisors are offered in PDF, Excel and PowerPoint formats. Within 24 hours of the payment being successfully received, the report will be sent to your email address.
Frequently Asked Questions
- Market Segmentation
- Introduction
- Product Definition
- Research Process
- Assumptions
- Executive Summary
- UAE Paints and Coatings Market Policies, Regulations, and Product Standards
- UAE Paints and Coatings Market Supply Chain Analysis
- UAE Paints and Coatings Market Trends & Developments
- UAE Paints and Coatings Market Dynamics
- Growth Drivers
- Challenges
- UAE Paints and Coatings Market Hotspot & Opportunities
- UAE Paints and Coatings Market Outlook, 2020-2032
- Market Size & Outlook
- By Revenues (USD Million)
- By Volume (Tons)
- Market Share and Forecast
- By Type
- Architectural – Market Size & Forecast 2020-2032, USD Million & Million Tons
- Industrial – Market Size & Forecast 2020-2032, USD Million & Million Tons
- Special purpose – Market Size & Forecast 2020-2032, USD Million & Million Tons
- By Formulation
- Water borne – Market Size & Forecast 2020-2032, USD Million & Million Tons
- Solvent borne – Market Size & Forecast 2020-2032, USD Million & Million Tons
- Powder – Market Size & Forecast 2020-2032, USD Million & Million Tons
- Radiation cured and other advanced chemistries – Market Size & Forecast 2020-2032, USD Million & Million Tons
- By Resin Chemistry
- Acrylic and latex systems – Market Size & Forecast 2020-2032, USD Million & Million Tons
- Alkyd and enamel systems – Market Size & Forecast 2020-2032, USD Million & Million Tons
- Epoxy systems – Market Size & Forecast 2020-2032, USD Million & Million Tons
- Polyurethane systems – Market Size & Forecast 2020-2032, USD Million & Million Tons
- Polyester and others – Market Size & Forecast 2020-2032, USD Million & Million Tons
- By Application - Market Size & Forecast 2020-2032, USD Million & Million Tons & Million Tons
- Residential– Market Size & Forecast 2020-2032, USD Million & Million Tons
- Commercial– Market Size & Forecast 2020-2032, USD Million & Million Tons
- Industrial– Market Size & Forecast 2020-2032, USD Million & Million Tons
- Automotive– Market Size & Forecast 2020-2032, USD Million & Million Tons
- Infrastructure– Market Size & Forecast 2020-2032, USD Million & Million Tons
- By Region
- Abu Dhabi & Al Ain
- Dubai
- Sharjah & Northern Emirates
- By Company
- Company Revenue Shares
- Competitor Characteristics
- By Type
- Market Size & Outlook
- UAE Architectural Paints and Coatings Market Outlook, 2020-2032
- Market Size & Outlook
- By Revenues (USD Million)
- By Volume (Tons)
- Market Share and Forecast
- By Resin Chemistry – Market Size & Forecast 2020-2032, USD Million & Million Tons
- By End-User – Market Size & Forecast 2020-2032, USD Million & Million Tons
- Market Size & Outlook
- UAE Industrial Paints and Coatings Market Outlook, 2020–2032
- Market Size & Outlook
- By Revenues (USD Million)
- Market Share and Forecast
- By Resin Chemistry – Market Size & Forecast 2020-2032, USD Million & Million Tons
- By End-User – Market Size & Forecast 2020-2032, USD Million & Million Tons
- Market Size & Outlook
- UAE Special Purpose Paints and Coatings Market Outlook, 2020–2032
- Market Size & Outlook
- By Revenues (USD Million)
- Market Share and Forecast
- By Resin Chemistry – Market Size & Forecast 2020-2032, USD Million & Million Tons
- By End-User – Market Size & Forecast 2020-2032, USD Million & Million Tons
- Market Size & Outlook
- UAE Paints and Coatings Market Key Strategic Imperatives for Success & Growth
- Competition Outlook
- Company Profiles
- PPG Industries Inc.
- Business Description
- Product Portfolio
- Strategic Alliances or Partnerships
- Recent Developments
- Financial Details
- Others
- AkzoNobel N.V.
- Business Description
- Product Portfolio
- Strategic Alliances or Partnerships
- Recent Developments
- Financial Details
- Others
- Coatings GmbH
- Business Description
- Product Portfolio
- Strategic Alliances or Partnerships
- Recent Developments
- Financial Details
- Others
- RPM International Inc.
- Business Description
- Product Portfolio
- Strategic Alliances or Partnerships
- Recent Developments
- Financial Details
- Others
- Axalta Coating Systems Ltd.
- Business Description
- Product Portfolio
- Strategic Alliances or Partnerships
- Recent Developments
- Financial Details
- Others
- Nippon Paint Holdings Group
- Business Description
- Product Portfolio
- Strategic Alliances or Partnerships
- Recent Developments
- Financial Details
- Others
- Kansai Paint Co., Ltd
- Business Description
- Product Portfolio
- Strategic Alliances or Partnerships
- Recent Developments
- Financial Details
- Others
- Hempel A/S
- Business Description
- Product Portfolio
- Strategic Alliances or Partnerships
- Recent Developments
- Financial Details
- Others
- Jotun A/S
- Business Description
- Product Portfolio
- Strategic Alliances or Partnerships
- Recent Developments
- Financial Details
- Others
- Masco Corporation
- Business Description
- Product Portfolio
- Strategic Alliances or Partnerships
- Recent Developments
- Financial Details
- Others
- Others
- PPG Industries Inc.
- Company Profiles
- Disclaimer
MarkNtel Advisors follows a robust and iterative research methodology designed to ensure maximum accuracy and minimize deviation in market estimates and forecasts. Our approach combines both bottom-up and top-down techniques to effectively segment and quantify various aspects of the market. A consistent feature across all our research reports is data triangulation, which examines the market from three distinct perspectives to validate findings. Key components of our research process include:
1. Scope & Research Design At the outset, MarkNtel Advisors define the research objectives and formulate pertinent questions. This phase involves determining the type of research—qualitative or quantitative—and designing a methodology that outlines data collection methods, target demographics, and analytical tools. They also establish timelines and budgets to ensure the research aligns with client goals.
2. Sample Selection and Data Collection In this stage, the firm identifies the target audience and determines the appropriate sample size to ensure representativeness. They employ various sampling methods, such as random or stratified sampling, based on the research objectives. Data collection is carried out using tools like surveys, interviews, and observations, ensuring the gathered data is reliable and relevant.
3. Data Analysis and Validation Once data is collected, MarkNtel Advisors undertake a rigorous analysis process. This includes cleaning the data to remove inconsistencies, employing statistical software for quantitative analysis, and thematic analysis for qualitative data. Validation steps are taken to ensure the accuracy and reliability of the findings, minimizing biases and errors.
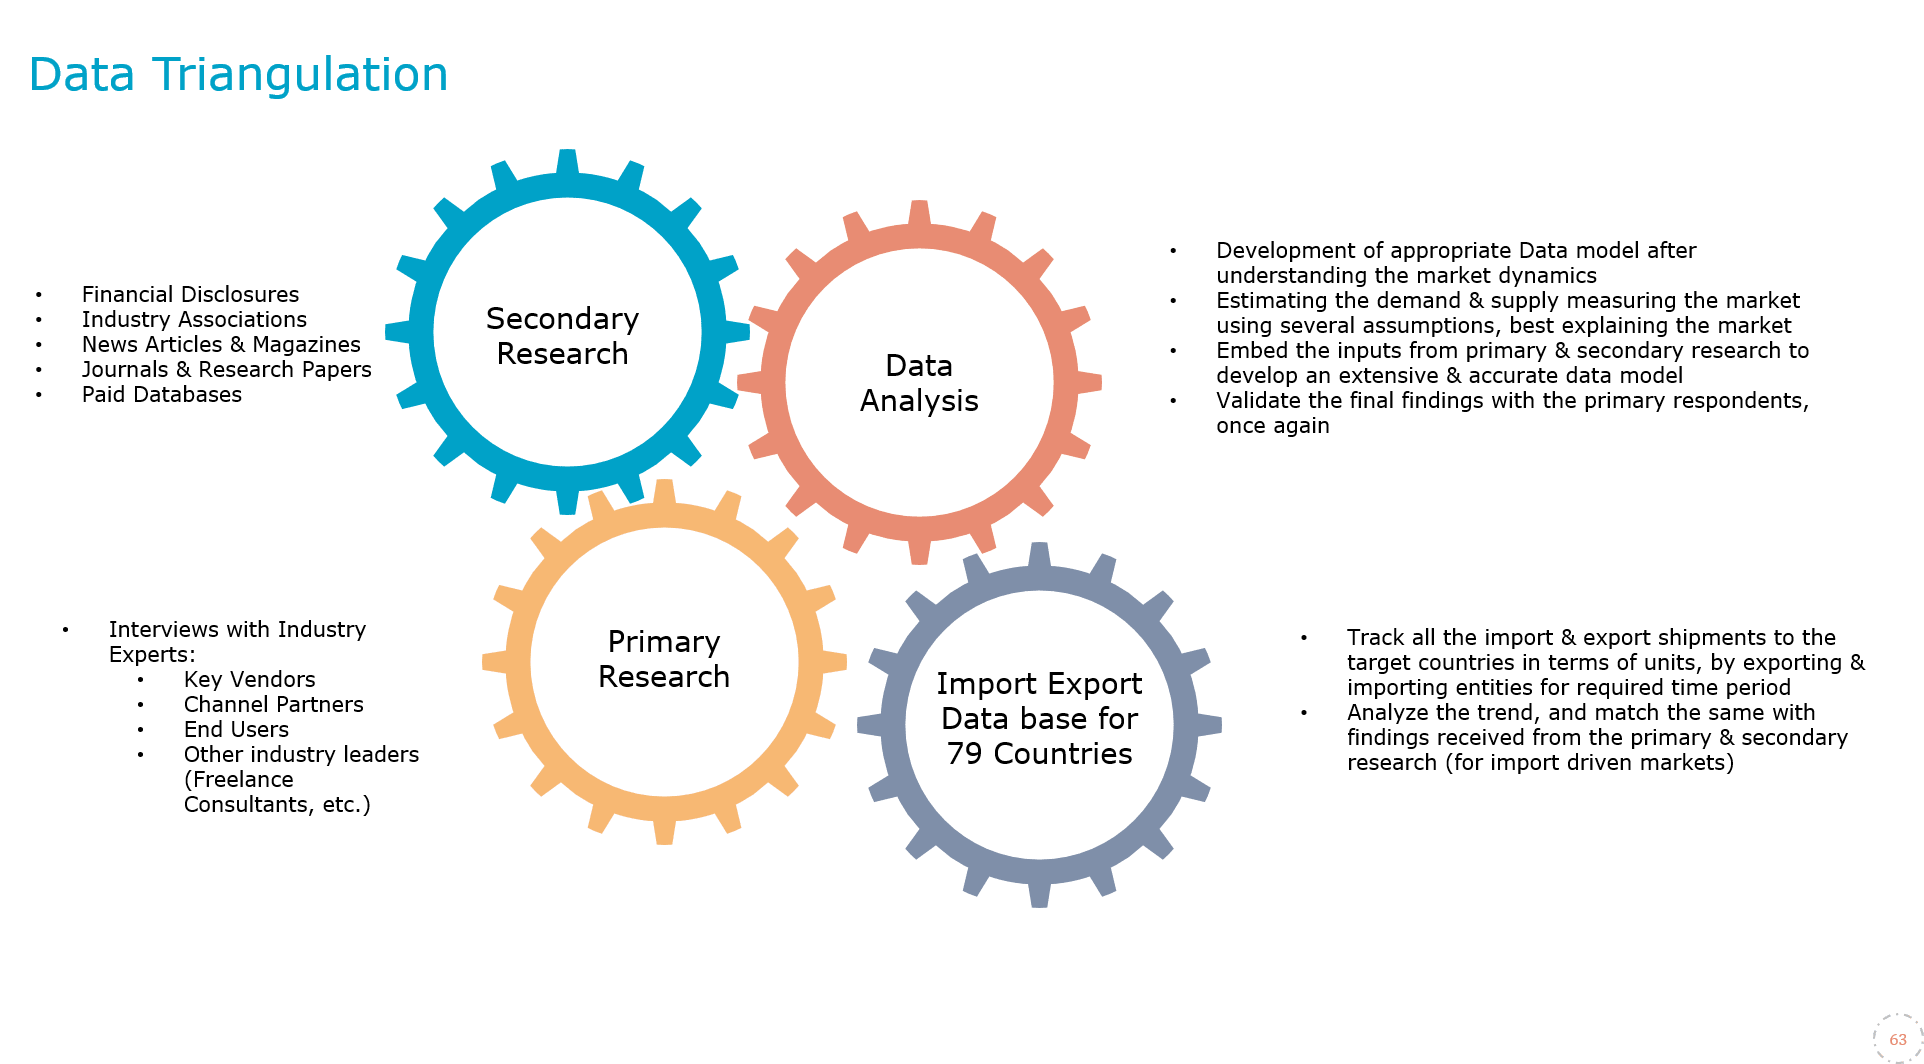
4. Data Forecast and FinalizationThe final phase involves forecasting future market trends based on the analyzed data. MarkNtel Advisors utilize predictive modeling and time series analysis to anticipate market behaviors. The insights are then compiled into comprehensive reports, featuring visual aids like charts and graphs, and include strategic recommendations to inform client decision-making

