
Russia Micronutrient Fertilizer Market Research Report: Growth Drivers & Forecast (2026-2032)
By Product Type (Zinc, Boron, Iron, Manganese, Copper, Molybdenum, Others), By Form (Chelated, Non-Chelated), By Application Mode (Soil Application, Foliar Application, Fertigation ... ), By Crop Type (Field Crops, Horticultural Crops, Turf & Ornamental) Read more
- Chemicals
- Mar 2026
- Pages 175
- Report Format: PDF, Excel, PPT
Russia Micronutrient Fertilizer Market
Projected 6.04% CAGR from 2026 to 2032
Study Period
2026-2032
Market Size (2026)
USD 190.02 Million
Market Size (2032)
USD 270.16 Million
Base Year
2025
Projected CAGR
6.04%
Leading Segments
By Product Type: Zinc
Russia Micronutrient Fertilizer Market Report Key Takeaways:
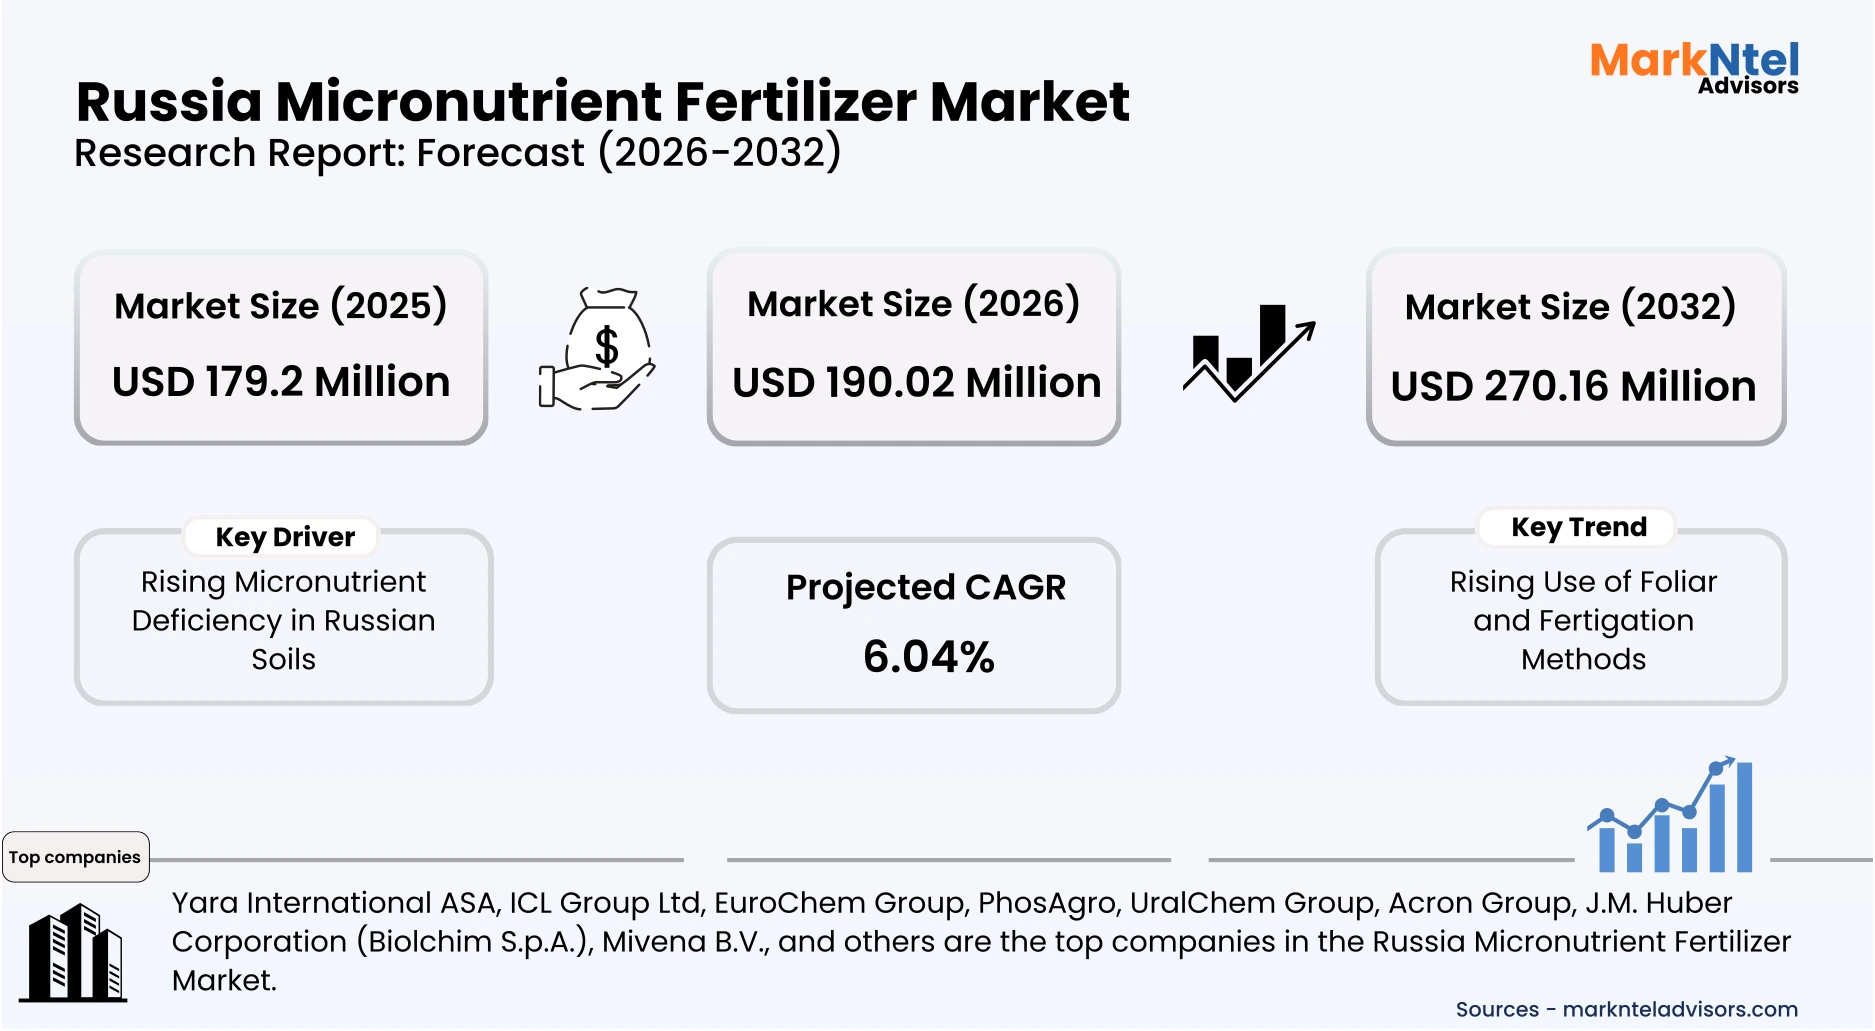
- The Russia Micronutrient Fertilizer Market size was valued at around USD 179.2 million in 2025 and is projected to grow from USD 190.02 million in 2026 to USD 270.16 million by 2032, exhibiting a CAGR of 6.04% during 2026-32.
- By Product Type, the Zinc segment represented a significant share of about 33% in the Russia Micronutrient Fertilizer Market in 2026.
- By Application Mode, the Soil Application segment seized a significant share of about 92% in the Russia Micronutrient Fertilizer Market in 2026.
- Leading Micronutrient Fertilizer companies in the Russia market are Yara International ASA, ICL Group Ltd, EuroChem Group, PhosAgro, UralChem Group, Acron Group, J.M. Huber Corporation (Biolchim S.p.A.), Mivena B.V., and Others.
Market Insights & Analysis: Russia Micronutrient Fertilizer Market (2026-32):
The Russia Micronutrient Fertilizer Market size was valued at around USD 179.2 million in 2025 and is projected grow from USD 190.02 million in 2026 to USD 270.16 million by 2032, exhibiting a CAGR of 6.04% during the forecast period, i.e., 2026-32.
Russia’s micronutrient fertilizer market has expanded alongside the country’s strengthening position in global agriculture and grain exports. According to the Food and Agriculture Organization, Russia continues to rank among the world’s leading wheat exporters, accounting for over 20% of global shipments in recent years. This export-driven production model has increased reliance on balanced fertilization, particularly as long-term soil studies from the Russian Academy of Sciences highlight persistent micronutrient deficiencies in arable land.
Current demand is supported by high agricultural production and government-backed output targets. Russia’s grain harvest reached approximately 139.4 million tons in 2025, up from around 130 million tons in 2024, as reported by the Ministry of Agriculture of Russia via TAS S. Field crops such as wheat and barley dominate fertilizer consumption, while greenhouse and horticulture segments are expanding under controlled-environment agriculture initiatives, increasing the adoption of precision nutrient application methods.
Government policies continue to reinforce fertilizer demand through agricultural modernization programs. Russia’s state support includes subsidies, concessional loans, and initiatives aimed at improving soil fertility and boosting agro-industrial productivity. National development strategies emphasize export growth and food security, while infrastructure investments in rail and port logistics have improved fertilizer distribution efficiency across key agricultural regions.
Industry players are aligning with these policies through product innovation and capacity expansion. Companies such as PhosAgro and EuroChem Group are expanding production of value-added fertilizers, including micronutrient-enriched formulations. For instance, PhosAgro reported a 7.1% increase in domestic fertilizer supplies in the first half of 2024, reflecting rising local demand and strengthening distribution capacity within Russia . Their investments in domestic manufacturing, export networks, and sustainable product development support long-term market growth, with future demand expected to be driven by continued farm modernization and efficiency-focused nutrient management practices.
Russia Micronutrient Fertilizer Market Recent Developments:
- 2025 : Russia-based PhosAgro increased fertilizer exports by 10% YoY to 4.3 million tons (Jan–May 2025), reflecting strong demand for advanced and nutrient-enriched fertilizers. This expansion strengthens domestic supply chains and supports micronutrient adoption through integrated product portfolios.
Russia Micronutrient Fertilizer Market Scope:
| Category | Segments |
|---|---|
| By Product Type | (Zinc, Boron, Iron, Manganese, Copper, Molybdenum, Others), |
| By Form | (Chelated, Non-Chelated), |
| By Application Mode | (Soil Application, Foliar Application, Fertigation), |
| By Crop Type | (Field Crops, Horticultural Crops, Turf & Ornamental) |
Russia Micronutrient Fertilizer Market Driver:
Rising Micronutrient Deficiency in Russian Soils
Micronutrient deficiency has emerged as a structural constraint in Russian agriculture due to prolonged intensive cultivation and imbalanced fertilizer application. Scientific studies from the Russian Academy of Sciences identify deficiencies of zinc, boron, and copper across major arable regions. The Food and Agriculture Organization recognizes nutrient imbalance as a major threat to soil health that directly affects food production . This challenge has intensified as continuous cereal cultivation accelerates nutrient extraction without proportional replenishment.
The impact is measurable through increased reliance on corrective nutrient inputs across dominant end-user segments. Field crops such as wheat and barley occupy a substantial share of cultivated land and are highly sensitive to micronutrient availability. Peer-reviewed agronomic research confirms that micronutrient deficiencies act as yield-limiting factors in cereal-based systems. Consequently, farmers in key agricultural regions are adopting micronutrient fertilizers to restore soil fertility and maintain stable crop output.
This driver expands market volume by generating recurring and non-substitutable demand for micronutrient inputs. Soil nutrient depletion requires continuous replenishment, ensuring sustained consumption across production cycles rather than temporary adoption. Government-backed soil fertility initiatives and input support mechanisms further strengthen uptake by improving accessibility and encouraging balanced fertilization practices. Increasing adoption of soil testing and precision agriculture technologies is enabling targeted nutrient application, reinforcing long-term demand growth and market expansion.
Russia Micronutrient Fertilizer Market Trend:
Rising Use of Foliar and Fertigation Methods
The adoption of foliar and fertigation methods in Russia has accelerated alongside the expansion of controlled-environment agriculture and precision farming practices. Government-supported greenhouse development has increased significantly, with over 340 greenhouse complexes operating across the country as of 2025, as reported by industry news citing the Ministry of Agriculture of Russia . These systems inherently rely on fertigation for nutrient delivery, driving structural demand for water-soluble micronutrients and precision application techniques.
This trend is reshaping input delivery models and product innovation across the agricultural value chain. Fertigation enables uniform nutrient distribution through irrigation systems, while foliar spraying supports rapid correction of deficiencies during critical growth stages. The Food and Agriculture Organization emphasizes that precision nutrient management improves efficiency and reduces losses, reinforcing the shift toward targeted application methods. As a result, manufacturers are increasingly developing specialized formulations tailored for these delivery systems.
The trend is expected to persist due to continued policy support and technological advancement in agriculture. Russia allocated approximately USD 46 million in 2026 to support greenhouse expansion and vegetable production, further strengthening the adoption of fertigation-based systems . Additionally, increasing use of soil testing and digital farming tools is enabling data-driven nutrient application. These structural changes indicate a long-term transition toward precision-based fertilization, sustaining demand for foliar and fertigation-compatible micronutrient products.
Russia Micronutrient Fertilizer Market Opportunity:
Precision Farming Expansion
The expansion of precision farming in Russia presents a compelling opportunity driven by increasing digitalization of agriculture and policy-backed modernization. The Ministry of Agriculture of Russia has prioritized digital agriculture and efficiency improvements under national agro-industrial development programs. According to the Food and Agriculture Organization, precision technologies improve input efficiency and crop productivity through targeted nutrient management. This structural shift has accelerated as farmers seek to optimize yields while reducing input losses and environmental impact.
This opportunity translates directly into demand for micronutrient fertilizers through data-driven application practices. Precision farming tools such as soil testing, remote sensing, and variable-rate technology enable accurate identification of micronutrient deficiencies at the field level. As a result, farmers increasingly adopt targeted micronutrient formulations rather than uniform bulk application. Peer-reviewed agronomic studies confirm that site-specific nutrient management improves fertilizer-use efficiency and crop performance, reinforcing demand for specialized and water-soluble micronutrient products.
The opportunity is particularly advantageous for new entrants due to the technology-driven and service-oriented nature of precision agriculture. Unlike traditional fertilizer markets dominated by scale, precision farming favors innovation, customization, and integration with digital platforms. Smaller players can differentiate through tailored formulations, advisory services, and compatibility with precision tools. This lowers entry barriers and enables scalable growth, as demand shifts toward high-efficiency, data-driven nutrient solutions aligned with modern agricultural practices.
Russia Micronutrient Fertilizer Market Challenge:
High Cost of Advanced Micronutrient Fertilizers
The high cost of advanced micronutrient fertilizers, particularly chelated and water-soluble formulations, remains a structural barrier in Russia due to input cost pressures and import dependencies. According to the Food and Agriculture Organization, specialty fertilizers require higher processing and formulation costs compared to conventional nutrients. Additionally, currency volatility and trade restrictions have increased the cost of imported raw materials and additives used in high-efficiency fertilizers. This has elevated overall product pricing, particularly for precision-compatible micronutrient solutions.
The impact is evident in farmer adoption behavior and purchasing decisions across key agricultural regions. Russian agriculture is dominated by large-scale cereal farming, where cost efficiency is prioritized over input optimization. As a result, farmers often prefer lower-cost bulk fertilizers instead of premium micronutrient products, limiting penetration of advanced formulations. Reports from agricultural institutions and regional farming bodies indicate that price sensitivity remains a key factor influencing fertilizer selection, particularly among small and mid-sized farms.
This challenge restricts market expansion by slowing the adoption rates of high-efficiency products and limiting innovation scalability. Higher upfront costs discourage widespread transition to chelated and precision-compatible micronutrients, even when agronomic benefits are established. It also creates entry barriers for new players offering advanced products, as price competitiveness becomes difficult against established bulk fertilizer suppliers. Consequently, the market remains skewed toward conventional products, constraining the full potential of micronutrient-driven productivity improvements.
Russia Micronutrient Fertilizer Market (2026-32) Segmentation Analysis:
The Russia Micronutrient Fertilizer market study of MarkNtel Advisors evaluates & highlights the major trends and influencing factors in each segment. It includes predictions for the period 2026–32 at the country level. Based on the analysis, the market has been further classified as;
Based on Product Type:
- Zinc
- Boron
- Iron
- Manganese
- Copper
- Molybdenum
- Others
Zinc dominates the Russia Micronutrient Fertilizer Market by product type, accounting for approximately 33% of total demand, primarily due to its critical role in cereal crop productivity and widespread soil deficiency. Russia is one of the world’s leading wheat producers and exporters, as highlighted by the Food and Agriculture Organization, with cereals occupying a substantial share of cultivated land. Wheat and barley are highly responsive to zinc application, as the nutrient directly supports enzyme activation, protein synthesis, and grain development. This agronomic dependency ensures consistent and large-scale consumption of zinc-based fertilizers across major farming regions.
Soil conditions further reinforce zinc dominance, as multiple agronomic studies conducted by the Russian Academy of Sciences indicate prevalent zinc deficiencies across arable soils, particularly in intensively cultivated zones. Continuous cereal cropping without balanced micronutrient replenishment has accelerated zinc depletion, making supplementation essential for maintaining yield stability. Unlike other micronutrients that may be region-specific, zinc deficiency is more widespread, increasing its applicability across diverse geographies and crop systems within Russia.
Industrial and product-level factors also support zinc’s leading position in the market. Zinc fertilizers are relatively cost-effective and compatible with multiple application methods, including soil and foliar treatments, enabling flexible adoption among farmers. Additionally, zinc is widely incorporated into compound and fortified fertilizers produced by major domestic manufacturers, ensuring consistent availability and integration into existing fertilization practices. This combination of agronomic necessity, broad deficiency prevalence, and scalable supply continues to position zinc as the dominant micronutrient segment in Russia.
Based on Application Mode:
- Soil Application
- Foliar Application
- Fertigation
Soil application dominates the Russia Micronutrient Fertilizer Market, accounting for approximately 92% of total demand, primarily because Russia’s fertilizer consumption is structurally integrated with bulk nutrient application systems. According to the Ministry of Agriculture of Russia, the country manages over 120 million hectares of arable land, most of which is cultivated using mechanized, large-scale farming practices. These systems rely on pre-sowing or basal fertilizer incorporation, making soil application the most operationally efficient and scalable method for micronutrient delivery.
Infrastructure and equipment availability further reinforce this dominance. Russian farms are heavily equipped with spreaders and seed-drill-based fertilization systems designed for soil nutrient placement, whereas foliar spraying and fertigation require additional investments in sprayers or irrigation infrastructure. This creates a structural lock-in effect where farmers continue using soil-based application due to compatibility with existing machinery and lower marginal cost per hectare.
In addition, fertilizer manufacturing and distribution systems in Russia are optimized for bulk soil-applied products. Major producers supply micronutrients in granular or blended forms that integrate directly with conventional fertilization programs, ensuring ease of use at scale. This alignment between farm operations, equipment ecosystems, and product formats makes soil application not just dominant but structurally embedded, limiting the scalability of alternative application methods despite their agronomic benefits.
Gain a Competitive Edge with Our Russia Micronutrient Fertilizer Market Report:
- Russia Micronutrient Fertilizer Market Report by MarkNtel Advisors provides a detailed & thorough analysis of market size & share, growth rate, competitive landscape, and key players. This comprehensive analysis helps businesses gain a holistic understanding of the market dynamics & make informed decisions.
- This report also highlights current market trends & future projections, allowing businesses to identify emerging opportunities & potential challenges. By understanding market forecasts, companies can align their strategies & stay ahead of the competition.
- Russia Micronutrient Fertilizer Market Report aids in assessing & mitigating risks associated with entering or operating in the market. By understanding market dynamics, regulatory frameworks, and potential challenges, businesses can develop strategies to minimize risks & optimize their operations.
*Reports Delivery Format - Market research studies from MarkNtel Advisors are offered in PDF, Excel and PowerPoint formats. Within 24 hours of the payment being successfully received, the report will be sent to your email address.
Frequently Asked Questions
- Market Segmentation
- Introduction
- Product Definition
- Research Process
- Assumptions
- Executive Summary
- Russia Micronutrient Fertilizer Market Policies, Regulations, and Product Standards
- Russia Micronutrient Fertilizer Market Trends & Developments
- Russia Micronutrient Fertilizer Market Dynamics
- Growth Factors
- Challenges
- Russia Micronutrient Fertilizer Market Hotspot & Opportunities
- Russia Micronutrient Fertilizer Market Outlook, 2022-2032F
- Market Size & Outlook
- By Revenues (USD Million)
- By Volume (Million Tons)
- Market Share & Outlook
- By Product Type- Market Size & Forecast 2022-2032, USD Million & Million Tons
- Zinc
- Boron
- Iron
- Manganese
- Copper
- Molybdenum
- Others
- By Form- Market Size & Forecast 2022-2032, USD Million & Million Tons
- Chelated
- Non-Chelated
- By Application Mode- Market Size & Forecast 2022-2032, USD Million & Million Tons
- Soil Application
- Foliar Application
- Fertigation
- By Crop Type- Market Size & Forecast 2022-2032, USD Million & Million Tons
- Field Crops
- Horticultural Crops
- Turf & Ornamental
- By Company
- Competition Characteristics
- Market Share & Analysis
- By Product Type- Market Size & Forecast 2022-2032, USD Million & Million Tons
- Market Size & Outlook
- Russia Zinc Market Outlook, 2022-2032
- Market Size & Outlook
- By Revenues (USD Million)
- By Volume (Million Tons)
- Market Share & Outlook
- By Form- Market Size & Forecast 2022-2032, USD Million & Million Tons
- By Application Mode- Market Size & Forecast 2022-2032, USD Million & Million Tons
- By Crop Type- Market Size & Forecast 2022-2032, USD Million & Million Tons
- Market Size & Outlook
- Russia Boron Market Outlook, 2022-2032
- Market Size & Outlook
- By Revenues (USD Million)
- By Volume (Million Tons)
- Market Share & Outlook
- By Form- Market Size & Forecast 2022-2032, USD Million & Million Tons
- By Application Mode- Market Size & Forecast 2022-2032, USD Million & Million Tons
- By Crop Type- Market Size & Forecast 2022-2032, USD Million & Million Tons
- Market Size & Outlook
- Russia Iron Market Outlook, 2022-2032
- Market Size & Outlook
- By Revenues (USD Million)
- By Volume (Million Tons)
- Market Share & Outlook
- By Form- Market Size & Forecast 2022-2032, USD Million & Million Tons
- By Application Mode- Market Size & Forecast 2022-2032, USD Million & Million Tons
- By Crop Type- Market Size & Forecast 2022-2032, USD Million & Million Tons
- Market Size & Outlook
- Russia Manganese Market Outlook, 2022-2032
- Market Size & Outlook
- By Revenues (USD Million)
- By Volume (Million Tons)
- Market Share & Outlook
- By Form- Market Size & Forecast 2022-2032, USD Million & Million Tons
- By Application Mode- Market Size & Forecast 2022-2032, USD Million & Million Tons
- By Crop Type- Market Size & Forecast 2022-2032, USD Million & Million Tons
- Market Size & Outlook
- Russia Copper Market Outlook, 2022-2032
- Market Size & Outlook
- By Revenues (USD Million)
- By Volume (Million Tons)
- Market Share & Outlook
- By Form- Market Size & Forecast 2022-2032, USD Million & Million Tons
- By Application Mode- Market Size & Forecast 2022-2032, USD Million & Million Tons
- By Crop Type- Market Size & Forecast 2022-2032, USD Million & Million Tons
- Market Size & Outlook
- Russia Molybdenum Market Outlook, 2022-2032
- Market Size & Outlook
- By Revenues (USD Million)
- By Volume (Million Tons)
- Market Share & Outlook
- By Form- Market Size & Forecast 2022-2032, USD Million & Million Tons
- By Application Mode- Market Size & Forecast 2022-2032, USD Million & Million Tons
- By Crop Type- Market Size & Forecast 2022-2032, USD Million & Million Tons
- Market Size & Outlook
- Russia Micronutrient Fertilizer Market Key Strategic Imperatives for Success & Growth
- Competitive Outlook
- Company Profiles
- Yara International ASA
- Business Description
- Product Portfolio
- Collaborations & Alliances
- Recent Developments
- Financial Details
- Others
- ICL Group Ltd
- Business Description
- Product Portfolio
- Collaborations & Alliances
- Recent Developments
- Financial Details
- Others
- EuroChem Group
- Business Description
- Product Portfolio
- Collaborations & Alliances
- Recent Developments
- Financial Details
- Others
- PhosAgro
- Business Description
- Product Portfolio
- Collaborations & Alliances
- Recent Developments
- Financial Details
- Others
- UralChem Group
- Business Description
- Product Portfolio
- Collaborations & Alliances
- Recent Developments
- Financial Details
- Others
- Acron Group
- Business Description
- Product Portfolio
- Collaborations & Alliances
- Recent Developments
- Financial Details
- Others
- J.M. Huber Corporation (Biolchim S.p.A.)
- Business Description
- Product Portfolio
- Collaborations & Alliances
- Recent Developments
- Financial Details
- Others
- Mivena B.V.
- Business Description
- Product Portfolio
- Collaborations & Alliances
- Recent Developments
- Financial Details
- Others
- Others
- Business Description
- Product Portfolio
- Collaborations & Alliances
- Recent Developments
- Financial Details
- Others
- Yara International ASA
- Company Profiles
- Disclaimer
MarkNtel Advisors follows a robust and iterative research methodology designed to ensure maximum accuracy and minimize deviation in market estimates and forecasts. Our approach combines both bottom-up and top-down techniques to effectively segment and quantify various aspects of the market. A consistent feature across all our research reports is data triangulation, which examines the market from three distinct perspectives to validate findings. Key components of our research process include:
1. Scope & Research Design At the outset, MarkNtel Advisors define the research objectives and formulate pertinent questions. This phase involves determining the type of research—qualitative or quantitative—and designing a methodology that outlines data collection methods, target demographics, and analytical tools. They also establish timelines and budgets to ensure the research aligns with client goals.
2. Sample Selection and Data Collection In this stage, the firm identifies the target audience and determines the appropriate sample size to ensure representativeness. They employ various sampling methods, such as random or stratified sampling, based on the research objectives. Data collection is carried out using tools like surveys, interviews, and observations, ensuring the gathered data is reliable and relevant.
3. Data Analysis and Validation Once data is collected, MarkNtel Advisors undertake a rigorous analysis process. This includes cleaning the data to remove inconsistencies, employing statistical software for quantitative analysis, and thematic analysis for qualitative data. Validation steps are taken to ensure the accuracy and reliability of the findings, minimizing biases and errors.

4. Data Forecast and FinalizationThe final phase involves forecasting future market trends based on the analyzed data. MarkNtel Advisors utilize predictive modeling and time series analysis to anticipate market behaviors. The insights are then compiled into comprehensive reports, featuring visual aids like charts and graphs, and include strategic recommendations to inform client decision-making
We offer flexible licensing options to cater to varying organizational needs. Choose the pricing pack that best suits your requirements:
Buy Now

