
Indonesia E-Waste Management Market Research Report: Trends, Forecast & Opportunities (2026-2032)
By Type (Large Household Appliances, Small Household Appliances, IT and Telecommunications Equipment, Consumer Electronics, Lighting Equipment, Electrical and Electronic Tools, Toy ... s, Leisure and Sports Equipment, Medical Devices, Monitoring and Control Instruments, Automatic Dispensers), By Process (Collection and Transportation, Sorting and Dismantling, Recycling and Recovery, Refurbishing and Reuse, Treatment and Disposal), By Technology (Physical Recycling, Chemical Recycling, Biological Recycling, Mechanical Recycling), By Material Type (Metals, Plastics, Glass, Others), By Service (Collection Services, Recycling Services, Refurbishment Services, Disposal Services, Consultancy Services), By Collection Channel (Take-back Programs, Retail Collection, Municipal Collection, Third-party Collection, Direct Producer Collection), By End-User (Residential, Commercial, Industrial, Government and Public Sector), and others Read more
- Environment
- Feb 2026
- Pages 135
- Report Format: PDF, Excel, PPT
Indonesia E-Waste Management Market
Projected 4.64% CAGR from 2026 to 2032
Study Period
2026-2032
Market Size (2026)
USD 1.6 Billion
Market Size (2032)
USD 2.1 Billion
Base Year
2025
Projected CAGR
4.64%
Leading Segments
By End User: Residential
Indonesia E-Waste Management Market Report Key Takeaways:
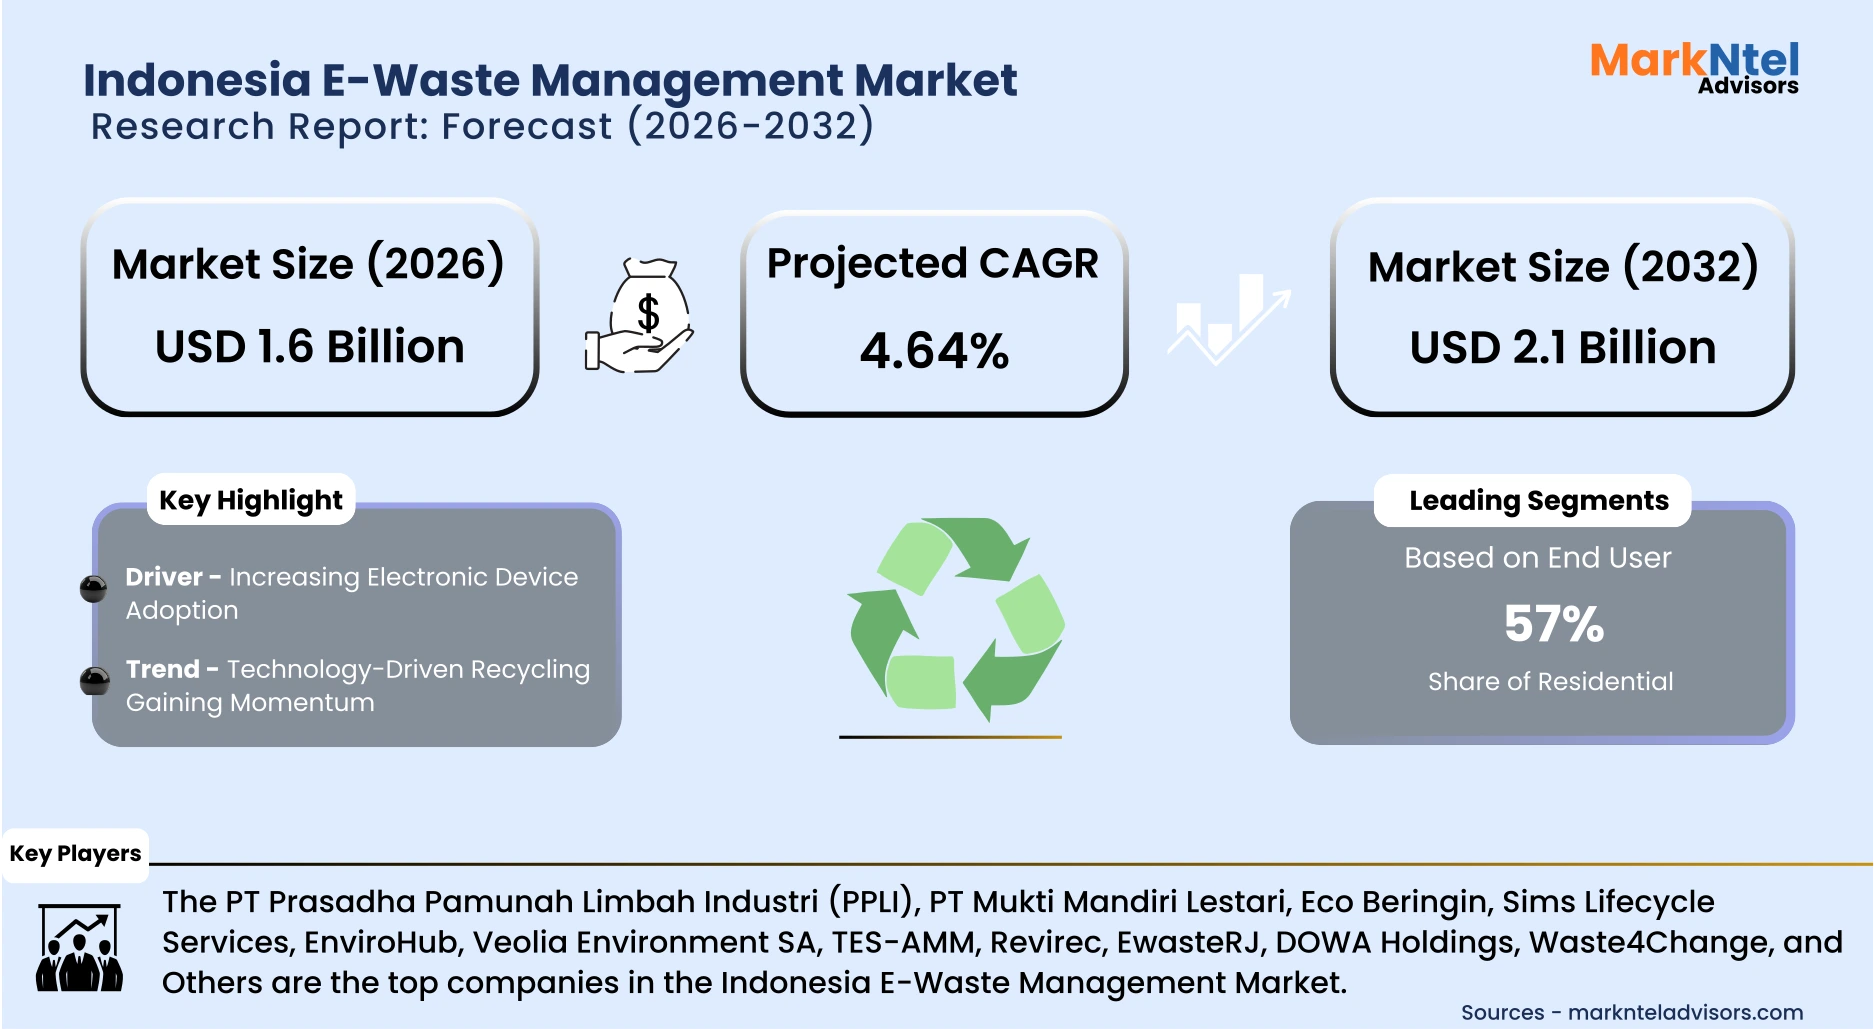
- The Indonesia E-Waste Management Market size was valued at USD 1.4 billion in 2025 and is projected to grow from USD 1.6 billion in 2026 to USD 2.1 billion by 2032, exhibiting a CAGR of 4.64% during the forecast period.
- By material type, the metals segment represented a significant share of about 50% in the Indonesia E-Waste Management Market in 2026.
- By end user, the residential sector seized a significant share of about 57% in the Indonesia E-Waste Management Market in 2025.
- Leading e-waste management companies in the Indonesia market are PT Prasadha Pamunah Limbah Industri (PPLI), PT Mukti Mandiri Lestari, Eco Beringin, Sims Lifecycle Services, EnviroHub, Veolia Environment SA, TES-AMM, Revirec, EwasteRJ, DOWA Holdings, Waste4Change, and Others.
Market Insights & Analysis: Indonesia E-Waste Management Market (2026-32):
The Indonesia E-Waste Management Market size was valued at around USD 1.4 billion in 2025 and is projected to grow from USD 1.6 billion in 2026 to USD 2.1 billion by 2032. Along with this, the Market is estimated to grow at a CAGR of around 4.64% during the forecast period, i.e., 2026-32.
The Indonesia e-waste management market is witnessing significant growth, primarily driven by the rapid adoption of electronic devices across households and businesses. Rising tech penetration has fueled both device consumption and eventual e-waste generation. Recent statistics show household internet usage reached 86.5 %, while mobile phone ownership stands at approximately 67.9 %, reflecting widespread digital adoptio n.
High consumption levels are evident in the volumes of waste produced. Urban mining data indicates that Indonesia generates more than 1,900 kilotons of e-waste annually, predominantly from mobile phones and household electronics. This illustrates how rising electronics usage directly contributes to increasing waste streams, emphasizing the need for robust collection, recycling, and recovery solutions.
Regulatory interventions also play a key role in shaping the market. For instance, the Indonesian Ministry of Environment recently blocked 73 containers of illegal e-waste imported from the United States at Batam Port, enforcing hazardous waste laws and ensuring all material was re-exported . Such measures demonstrate governmental commitment to preventing Indonesia from becoming a dumping ground for hazardous e-waste.
A notable trend accelerating market efficiency is technology-driven recycling, which leverages AI, robotics, and automated material recovery systems to enhance processing accuracy and reduce environmental impact. Indonesian firm Waste4Change implemented digital and equipment-based sorting technologies at its Material Recovery House facility, reducing residual waste from 65 % to 10 % and increasing daily processing capacity from 18 to 22 tonnes, highlighting the benefits of mechanization in improving throughput .
Additionally, Indonesia’s broader smart city initiatives are exploring AI-enabled algorithms and sensor systems to optimize e-waste collection and recycling processes. These systems can predict collection patterns, enhance sorting accuracy, and reduce contamination, bridging digital tracking with physical waste management operations .
Overall, rising electronic device adoption, increasing e-waste volumes, and government regulatory interventions are fueling the growth of Indonesia’s formal e-waste management market. Coupled with the adoption of AI, robotics, and digitalized recycling solutions, these factors are transforming the sector toward a more efficient, environmentally sustainable, and technologically advanced system. Continued investments in formal infrastructure and smart processing solutions will be critical to handling the country’s rapidly growing e-waste streams in the coming years.
Indonesia E-Waste Management Market Recent Developments:
- 2025: Erafone launched its “Erafone Jaga Bumi” program to collect and recycle e‑waste, gathering 2,255 units of old electronics in 2025. The initiative helped reduce carbon emissions by 161,700 kg CO₂ and saved around 301,261 kWh of energy through recycling efforts .
- 2025: LG Electronics Indonesia conducted a nationwide e‑waste recycling campaign titled “E‑Waste Recycling for a Better Planet,” establishing multiple collection points in Jakarta and educating the public on proper disposal and recycling of electronic waste to promote sustainability .
Indonesia E-Waste Management Market Scope:
| Category | Segments |
|---|---|
| By Type | (Large Household Appliances, Small Household Appliances, IT and Telecommunications Equipment, Consumer Electronics, Lighting Equipment, Electrical and Electronic Tools, Toys, Leisure and Sports Equipment, Medical Devices, Monitoring and Control Instruments, Automatic Dispensers), |
| By Process | (Collection and Transportation, Sorting and Dismantling, Recycling and Recovery, Refurbishing and Reuse, Treatment and Disposal), |
| By Technology | (Physical Recycling, Chemical Recycling, Biological Recycling, Mechanical Recycling), |
| By Material Type | (Metals, Plastics, Glass, Others), |
| By Service | (Collection Services, Recycling Services, Refurbishment Services, Disposal Services, Consultancy Services), |
| By Collection Channel | (Take-back Programs, Retail Collection, Municipal Collection, Third-party Collection, Direct Producer Collection), |
| By End-User | (Residential, Commercial, Industrial, Government and Public Sector), |
Indonesia E-Waste Management Market Driver:
Increasing Electronic Device Adoption
Indonesia’s surge in electronic device adoption is a foundational driver of its e‑waste management market. According to the International Telecommunication Union (ITU) and Indonesian government agencies, Indonesia generated approximately 1.9–2.1 million tons of e‑waste in recent years, making it the largest e‑waste generator in Southeast Asia and the fourth largest in Asia. This high volume is closely linked to widespread ownership of electronic devices, especially smartphones and ICT equipment, that increasingly permeate urban and rural populations.
Data from Badan Pusat Statistik (BPS) shows that around 68.7% of Indonesians owned mobile phones in 2024, up from previous years, and internet access reached 72.8% of the population, reflecting deeper digital integration and device use . The Ministry of Environment and Forestry (KLHK) also reported that national e‑waste volumes have steadily risen due to higher consumption of everyday electronics such as laptops, phones, and household gadgets.
Furthermore, Indonesia’s National Development Planning Agency (Bappenas) roadmap for a circular economy highlights policies to support expanded electronics use and sustainable lifecycle management, spanning product standards, extended producer responsibility (EPR), and formal recycling frameworks.
Given this structure, driven by rising device ownership, digitalization, and policy frameworks, continued adoption of electronics will further expand e‑waste volumes, necessitating robust collection, recycling, and recovery solutions. In conclusion, rapid device adoption directly fuels market demand, accelerating the growth of formal e‑waste management infrastructure in Indonesia.
Indonesia E-Waste Management Market Trend:
Technology-Driven Recycling Gaining Momentum
A major trend reshaping Indonesia’s e‑waste sector is the adoption of advanced technology in recycling and material recovery processes. In 2025, innovative companies are leveraging state‑of‑the‑art systems that go beyond manual sorting to improve precision and efficiency. For example, Indonesian startup Remind, which secured USD 1.3 million in funding, is investing in technological infrastructure to process e‑waste more effectively, targeting 6,000 tonnes of e‑waste by the end of 2025 and planning to scale to 90,000 tonnes by 2030 with advanced separation and refining capabilities .
This includes integration of AI‑assisted sorting, robotics, and automated separation technologies that can significantly enhance the identification and segregation of metals, plastics, and hazardous components from discarded electronics. Such technologies reduce human exposure to dangerous materials and substantially increase recovery rates of high‑value metals like copper, gold, and silver. Although widely discussed in global recycling innovation literature, these automated systems are increasingly being explored for deployment in Southeast Asian markets, including Indonesia, to modernize existing facilities and improve sustainability outcomes.
Government and regulator interest in digitizing e‑waste management processes further supports this trend. Integrating digital platforms with physical recycling systems can improve tracking, compliance, and reporting of e‑waste streams, a foundation for broader adoption of technology‑driven processes in the coming years.
Overall, advancements in automation, AI integration, and sophisticated material recovery are key trends driving Indonesia’s e‑waste recycling evolution, enabling higher efficiency, better environmental outcomes, and scalability toward future e‑waste volumes.
Indonesia E-Waste Management Market Opportunity:
Expansion of Recycling Infrastructure
Indonesia’s e‑waste recycling infrastructure remains underdeveloped, representing a significant opportunity for growth as e‑waste volumes rise. According to the International Telecommunication Union (ITU) and Indonesian government data, the country generated about 1.9 million tonnes of e‑waste annually, the highest in Southeast Asia, yet formal recycling systems are limited and unevenly distributed. This infrastructure gap means a large portion of e‑waste still enters informal channels or ends up in landfills, highlighting space for expansion of dedicated facilities.
While cities like Jakarta, Bandung, and Surabaya have begun rolling out collection points and recycling points in collaboration with public and private players, these are still concentrated in major urban centers. Government initiatives are increasingly emphasizing Extended Producer Responsibility (EPR) to integrate product design, collection, and recycling logistics, aimed at scaling systematic infrastructure.
Investments in new material recovery facilities, sorting centers, and formal processing plants, including advanced dismantling and metal recovery systems, can substantially increase formal recycling rates beyond the current low levels (15% e‑waste formally processed) and provide environmental, economic, and employment benefits.
Overall, given rising e‑waste generation and existing infrastructure gaps, expanding formal recycling facilities presents a major opportunity to capture growth, support circular economy goals, and improve environmental outcomes in Indonesia’s e‑waste sector.
Indonesia E-Waste Management Market Challenge:
Lack of Awareness in Rural Areas
A notable challenge hindering e‑waste management in Indonesia is low public awareness of proper e‑waste disposal, especially in rural communities. While national government agencies track overall waste volumes, local waste behaviour studies show widespread misunderstanding about how to handle hazardous electronic waste responsibly. Many rural residents routinely mix e‑waste with general municipal waste due to a lack of knowledge about specialized disposal channels, limited formal recycling services, and little exposure to educational campaigns. This results in old devices being discarded improperly or informally, increasing environmental and health risks.
Official analyses reveal that many households still prefer to dispose of electronics alongside regular trash or sell them for informal reuse, rather than using designated drop‑off points. Government documents on e‑waste management acknowledge that poor public awareness contributes to improper disposal practices, which reduces participation in formal recycling and complicates efforts to build an organized collection system .
In rural settings, limited access to take‑back programs and the absence of targeted education exacerbate the problem, making it difficult for authorities to divert e‑waste into formal recycling channels. Without broader knowledge campaigns and community outreach, mere infrastructure expansion will not be sufficient; residents must first understand why and how to dispose of e‑waste properly.
Overall, the lack of awareness in rural areas undermines formal collection rates, increases environmental risk, and impedes the development of an effective e‑waste management market in Indonesia.
Indonesia E-Waste Management Market (2026-32) Segmentation Analysis:
The Indonesia E-Waste Management Market study of MarkNtel Advisors evaluates & highlights the major trends and influencing factors in each segment. It includes predictions for the period 2026–32 at the country level. Based on the analysis, the Market has been further classified as;
Based on Material Type:
-
- Metals
- Plastics
- Glass
- Others
Metals dominate the Indonesia e-waste management industry, holding around 50% of processed materials. Electronic devices, including IT equipment, consumer electronics, and household appliances, contain valuable metals like copper, gold, and aluminum, which are highly recyclable. The high recovery value incentivizes formal recycling operations and attracts investments in advanced separation and recovery technologies.
Additionally, metals are easier to collect and process compared to plastics or glass, making them a preferred material for both recycling companies and government initiatives. The growing awareness about resource efficiency, rising metal prices, and supportive regulations further enhances the focus on metal recovery. As Indonesia imports significant amounts of electronic devices and generates large domestic e-waste volumes, metal extraction remains the most profitable and technically feasible segment, driving its market leadership.
Based on End User:
- Residential
- Commercial
- Industrial
- Government and Public Sector
The residential segment leads with 57% of e-waste generation, primarily because households contribute the majority of discarded electronics, from smartphones and laptops to small appliances. Rapid technology adoption, shorter device life cycles, and increased consumption of smart home and entertainment devices have amplified household e-waste volumes. Residential users rely on take-back programs, retail collection, and municipal services for proper disposal, which formalizes the recycling chain. Government awareness campaigns, incentives, and convenience-focused initiatives like drop boxes at stores encourage participation, increasing collected volumes.
Compared to industrial or commercial users, households produce smaller, diverse, but frequent e-waste streams, making this segment central to the overall management ecosystem. Consequently, the residential segment remains critical for shaping policy, collection infrastructure, and market strategies in Indonesia’s e-waste sector.
Indonesia E-Waste Management Market (2026-32): Regional Projection
The Indonesia E-Waste Management Market is dominated by Java and Sumatra regions, with major urban centers like Jakarta, Surabaya, Bandung, and Medan leading in e-waste generation and formal recycling initiatives. These regions account for the highest concentration of households, commercial establishments, and industrial facilities using electronic devices, driving significant e-waste volumes. Jakarta, for example, alone generates thousands of tonnes of e-waste annually, prompting both government and private players to establish collection points, material recovery facilities, and advanced recycling plants.
Additionally, higher digital adoption, widespread internet penetration, and concentrated population density make these regions more receptive to formal e-waste programs and technology-driven recycling initiatives. Government regulatory focus, such as Extended Producer Responsibility (EPR) pilot projects and awareness campaigns, is also primarily centered in these high-consumption areas, reinforcing their dominance in the market. Consequently, Java and Sumatra remain the primary regions shaping Indonesia’s formal e-waste management landscape.
Gain a Competitive Edge with Our Indonesia E-Waste Management Market Report:
- Indonesia E-Waste Management Market Report by MarkNtel Advisors provides a detailed & thorough analysis of Market size & share, growth rate, competitive landscape, and key players. This comprehensive analysis helps businesses gain a holistic understanding of the Market dynamics & make informed decisions.
- This report also highlights current Market trends & future projections, allowing businesses to identify emerging opportunities & potential challenges. By understanding Market forecasts, companies can align their strategies & stay ahead of the competition.
- Indonesia E-Waste Management Market Report aids in assessing & mitigating risks associated with entering or operating in the Market. By understanding Market dynamics, regulatory frameworks, and potential challenges, businesses can develop strategies to minimize risks & optimize their operations.
*Reports Delivery Format - Market research studies from MarkNtel Advisors are offered in PDF, Excel and PowerPoint formats. Within 24 hours of the payment being successfully received, the report will be sent to your email address.
Frequently Asked Questions
- Market Segmentation
- Introduction
- Product Definition
- Research Process
- Assumptions
- Executive Summary
- Indonesia E-Waste Management Market Policies, Regulations, and Product Standards
- Indonesia E-Waste Management Market Trends & Developments
- Indonesia E-Waste Management Market Dynamics
- Growth Factors
- Challenges
- Indonesia E-Waste Management Market Hotspot & Opportunities
- Indonesia E-Waste Management Market Outlook, 2022-2032F
- Market Size & Outlook
- By Revenues (USD Million)
- By Thousand Tons
- Market Share & Outlook
- By Type- Market Size & Forecast 2022-2032, USD Million & Thousand Tons
- Large Household Appliances
- Small Household Appliances
- IT and Telecommunications Equipment
- Consumer Electronics
- Lighting Equipment
- Electrical and Electronic Tools
- Toys
- Leisure and Sports Equipment
- Medical Devices
- Monitoring and Control Instruments
- Automatic Dispensers
- By Process- Market Size & Forecast 2022-2032, USD Million & Thousand Tons
- Collection and Transportation
- Sorting and Dismantling
- Recycling and Recovery
- Refurbishing and Reuse
- Treatment and Disposal
- By Technology- Market Size & Forecast 2022-2032, USD Million & Thousand Tons
- Physical Recycling
- Chemical Recycling
- Biological Recycling
- Mechanical Recycling
- By Material Type- Market Size & Forecast 2022-2032, USD Million & Thousand Tons
- Metals
- Plastics
- Glass
- Others
- By Service- Market Size & Forecast 2022-2032, USD Million & Thousand Tons
- Collection Services
- Recycling Services
- Refurbishment Services
- Disposal Services
- Consultancy Services
- By Collection Channel- Market Size & Forecast 2022-2032, USD Million & Thousand Tons
- Take-back Programs
- Retail Collection
- Municipal Collection
- Third-party Collection
- Direct Producer Collection
- By End-User- Market Size & Forecast 2022-2032, USD Million & Thousand Tons
- Residential
- Commercial
- Industrial
- Government and Public Sector
- By Region- Market Size & Forecast 2022-2032, USD Million & Thousand Tons
- Northeast
- Midwest
- South
- West
- By Company
- Competition Characteristics
- Market Share & Analysis
- By Type- Market Size & Forecast 2022-2032, USD Million & Thousand Tons
- Market Size & Outlook
- Indonesia Metals Waste Management Market Outlook, 2022-2032
- Market Size & Outlook
- By Revenues (USD Million)
- By Thousand Tons
- Market Share & Outlook
- By Process- Market Size & Forecast 2022-2032, USD Million & Thousand Tons
- By Technology- Market Size & Forecast 2022-2032, USD Million & Thousand Tons
- By Material Type- Market Size & Forecast 2022-2032, USD Million & Thousand Tons
- By Service- Market Size & Forecast 2022-2032, USD Million & Thousand Tons
- By Collection Channel- Market Size & Forecast 2022-2032, USD Million & Thousand Tons
- By End-User- Market Size & Forecast 2022-2032, USD Million & Thousand Tons
- By Region- Market Size & Forecast 2022-2032, USD Million & Thousand Tons
- Market Size & Outlook
- Indonesia Plastics Waste Management Market Outlook, 2022-2032
- Market Size & Outlook
- By Revenues (USD Million)
- By Thousand Tons
- Market Share & Outlook
- By Process- Market Size & Forecast 2022-2032, USD Million & Thousand Tons
- By Technology- Market Size & Forecast 2022-2032, USD Million & Thousand Tons
- By Material Type- Market Size & Forecast 2022-2032, USD Million & Thousand Tons
- By Service- Market Size & Forecast 2022-2032, USD Million & Thousand Tons
- By Collection Channel- Market Size & Forecast 2022-2032, USD Million & Thousand Tons
- By End-User- Market Size & Forecast 2022-2032, USD Million & Thousand Tons
- By Region- Market Size & Forecast 2022-2032, USD Million & Thousand Tons
- Market Size & Outlook
- Indonesia Glass Waste Management Market Outlook, 2022-2032
- Market Size & Outlook
- By Revenues (USD Million)
- By Thousand Tons
- Market Share & Outlook
- By Process- Market Size & Forecast 2022-2032, USD Million & Thousand Tons
- By Technology- Market Size & Forecast 2022-2032, USD Million & Thousand Tons
- By Material Type- Market Size & Forecast 2022-2032, USD Million & Thousand Tons
- By Service- Market Size & Forecast 2022-2032, USD Million & Thousand Tons
- By Collection Channel- Market Size & Forecast 2022-2032, USD Million & Thousand Tons
- By End-User- Market Size & Forecast 2022-2032, USD Million & Thousand Tons
- By Region- Market Size & Forecast 2022-2032, USD Million & Thousand Tons
- Market Size & Outlook
- Indonesia E-Waste Management Market Key Strategic Imperatives for Success & Growth
- Competitive Outlook
- Company Profiles
- PT Prasadha Pamunah Limbah Industri (PPLI)
- Business Description
- Product Portfolio
- Collaborations & Alliances
- Recent Developments
- Financial Details
- Others
- PT Mukti Mandiri Lestari
- Business Description
- Product Portfolio
- Collaborations & Alliances
- Recent Developments
- Financial Details
- Others
- Eco Beringin
- Business Description
- Product Portfolio
- Collaborations & Alliances
- Recent Developments
- Financial Details
- Others
- Sims Lifecycle Services
- Business Description
- Product Portfolio
- Collaborations & Alliances
- Recent Developments
- Financial Details
- Others
- EnviroHub
- Business Description
- Product Portfolio
- Collaborations & Alliances
- Recent Developments
- Financial Details
- Others
- Veolia Environment SA
- Business Description
- Product Portfolio
- Collaborations & Alliances
- Recent Developments
- Financial Details
- Others
- TES-AMM
- Business Description
- Product Portfolio
- Collaborations & Alliances
- Recent Developments
- Financial Details
- Others
- Revirec
- Business Description
- Product Portfolio
- Collaborations & Alliances
- Recent Developments
- Financial Details
- Others
- EwasteRJ
- Business Description
- Product Portfolio
- Collaborations & Alliances
- Recent Developments
- Financial Details
- Others
- DOWA Holdings
- Business Description
- Product Portfolio
- Collaborations & Alliances
- Recent Developments
- Financial Details
- Others
- Waste4Change
- Business Description
- Product Portfolio
- Collaborations & Alliances
- Recent Developments
- Financial Details
- Others
- PT Prasadha Pamunah Limbah Industri (PPLI)
- Company Profiles
- Disclaimer
MarkNtel Advisors follows a robust and iterative research methodology designed to ensure maximum accuracy and minimize deviation in market estimates and forecasts. Our approach combines both bottom-up and top-down techniques to effectively segment and quantify various aspects of the market. A consistent feature across all our research reports is data triangulation, which examines the market from three distinct perspectives to validate findings. Key components of our research process include:
1. Scope & Research Design At the outset, MarkNtel Advisors define the research objectives and formulate pertinent questions. This phase involves determining the type of research—qualitative or quantitative—and designing a methodology that outlines data collection methods, target demographics, and analytical tools. They also establish timelines and budgets to ensure the research aligns with client goals.
2. Sample Selection and Data Collection In this stage, the firm identifies the target audience and determines the appropriate sample size to ensure representativeness. They employ various sampling methods, such as random or stratified sampling, based on the research objectives. Data collection is carried out using tools like surveys, interviews, and observations, ensuring the gathered data is reliable and relevant.
3. Data Analysis and Validation Once data is collected, MarkNtel Advisors undertake a rigorous analysis process. This includes cleaning the data to remove inconsistencies, employing statistical software for quantitative analysis, and thematic analysis for qualitative data. Validation steps are taken to ensure the accuracy and reliability of the findings, minimizing biases and errors.

4. Data Forecast and FinalizationThe final phase involves forecasting future market trends based on the analyzed data. MarkNtel Advisors utilize predictive modeling and time series analysis to anticipate market behaviors. The insights are then compiled into comprehensive reports, featuring visual aids like charts and graphs, and include strategic recommendations to inform client decision-making
We offer flexible licensing options to cater to varying organizational needs. Choose the pricing pack that best suits your requirements:
Buy Now

