India Fertilizer Market Research Report: Forecast (2026-2032)
By Product (Straight Fertilizers (Nitrogenous Fertilizers (Urea, Calcium Ammonium Nitrate, Ammonium Nitrate, Ammonium Sulfate, Anhydrous Ammonia, Others), Phosphatic Fertilizers (M ... ono-Ammonium Phosphate (MAP), Di-Ammonium Phosphate (DAP), Single Super Phosphate (SSP), Triple Super Phosphate (TSP), Others), Potash Fertilizers (Muriate of Potash (MoP), Sulfate of Potash (SoP)), Secondary Macronutrient Fertilizers (Calcium Fertilizers, Magnesium Fertilizers, Sulfur Fertilizers), Micronutrient Fertilizers (Zinc, Manganese, Copper, Iron, Boron, Molybdenum, Others)), Complex Fertilizers, Bio-fertilizers, Specialty Fertilizers (Water-Soluble Fertilizers, Controlled-Release Fertilizers (CRF), Slow-Release Fertilizers (SRF), Liquid Fertilizers)), By Form (Conventional (granules/powders for broadcast/soil), Liquid), By Crop Type (Grains and Cereals, Pulses and Oilseeds, Fruits and Vegetables, Flowers and Ornamentals, Others), By Application (Fertigation, Foliar, Banding, Drip Irrigation), and others Read more
- Environment
- Aug 2026
- Pages 145
- Report Format: PDF, Excel, PPT
India Fertilizer Market
Projected 7.79% CAGR from 2026 to 2032
Study Period
2026-2032
Market Size (2026)
USD 15.29 Billion
Market Size (2032)
USD 23.98 Billion
Base Year
2025
Projected CAGR
7.79%
Leading Segments
By Product: Straight Fertilizers
India Fertilizer Market Key Takeaways
- The India fertilizer market size was valued at USD 13.98 billion in 2025 and is projected to grow from USD 15.29 billion in 2026 to USD 23.98 billion by 2032.
- The market is projected to register a CAGR of 7.79% during 2026–2032.
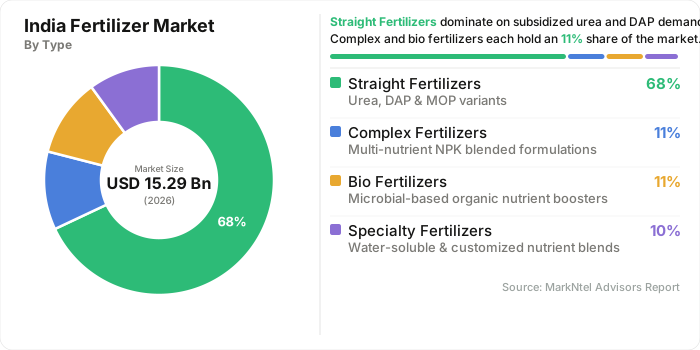
- By product, straight fertilizers accounted for 68% market share in 2026.
- By form, conventional fertilizers held a market share of 89% in 2026.
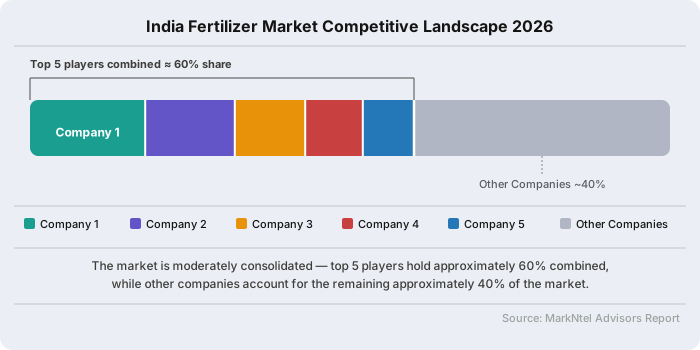
- The industry is moderately consolidated, with the top five players collectively accounting for approximately 60% of the market share in 2026.
India Fertilizer Market Size and Outlook
The fertilizer industry in India was valued at USD 13.98 billion in 2025 and is currently standing at USD 15.29 billion in 2026. The industry is projected to grow to USD 23.98 billion by 2032, showcasing a CAGR of around 7.79% during the forecast period, i.e., 2026–32.
The market continues to be supported by the country's expanding agricultural production, increasing emphasis on food security, and sustained fertilizer consumption across major crop categories. Rising farm productivity is reinforcing the importance of balanced nutrient application, with national food grain yield increasing from 1,930 kilograms per hectare in 2010 to 2011 to 2,578 kilograms per hectare during 2024 to 2025. This improvement reflects the growing role of fertilizers in enhancing agricultural output while supporting long term demand across both conventional and specialty nutrient products.
The market is also benefiting from improving domestic manufacturing capabilities and increasing participation from large industrial groups seeking opportunities in the sector. India has strengthened its fertilizer supply ecosystem through continued capacity additions and improving product availability, while fertilizer exports have expanded over the last two fiscal years despite continued dependence on imported raw materials. Reports indicating Reliance Industries' planned entry into the fertilizer business further highlight growing confidence in the sector's long term growth potential.
Government policy remains one of the strongest pillars supporting the market. The union budget 2026 to 2027 allocated approximately USD 20.0 billion to the department of fertilizers, reinforcing the government's commitment to ensuring affordable fertilizer availability. Additionally, the union cabinet approved approximately USD 4.9 billion under the nutrient based subsidy scheme for kharif 2026 while maintaining affordable retail prices for phosphatic and potassic fertilizers despite elevated global input costs.
The government had also allocated more than USD 24.0 billion under the nutrient based subsidy scheme between FY2022 to 2023 and FY2024 to 2025, demonstrating sustained policy support for balanced nutrient consumption, stable farmer demand, and long term market development. Overall, the market is supported by strong agricultural fundamentals, consistent policy backing, improving domestic production, and growing industry participation. Together, these factors are expected to sustain fertilizer demand, strengthen supply resilience, and support the market's long term growth trajectory.
India Fertilizer Market Key Indicators
- India's foodgrain production is estimated at 348.7 million tonnes during 2025 to 2026, supported by strong Kharif and Rabi harvests. Higher agricultural output is expected to sustain fertilizer consumption as farmers continue focusing on improving crop productivity and yields.
- Gross irrigated area now covers 56% of India's net sown land. Expanding irrigation infrastructure is supporting more intensive cultivation and encouraging higher and more consistent fertilizer application across agricultural regions.
- Domestic fertilizer production reached 11.57 million tonnes during April to June 2026, reflecting continued manufacturing activity to support agricultural demand and strengthen supply availability.
- India's agriculture sector is projected to record 3.1% gross value added growth in FY2026. Continued expansion in agricultural activity is expected to support stable fertilizer demand despite moderation from the previous fiscal year.
- The collateral free loan limit under the kisan credit card scheme was increased to approximately USD 2,300 per borrower from January 2025, improving farmers' access to institutional credit for purchasing agricultural inputs, including fertilizers.
- The government set an agricultural credit target of approximately USD 379 billion for FY2025 to 2026, supporting investment across farming and allied activities. Improved credit availability is expected to facilitate timely fertilizer purchases.
- More than 61,800 primary agricultural credit societies had migrated to a common ERP based digital platform by March 2026, improving rural service delivery and strengthening access to agricultural inputs through an increasingly digital cooperative network.
Import & Export Trend: India’s Organic Fertilizer Trade Shows Import Contraction but Strong Export Recovery
India’s trade in fertilizers remained relatively small compared with the broader fertilizer industry but showed a notable shift in 2022–2025. Based on the UNSD/ITC data shown in the provided trade tables, import value declined from USD 49 million in 2022 to USD 34 million in 2025, a reduction of about 31%, while import volume fell from 15,000 tons to 12,000 tons. The decline indicates lower dependence on imported organic and animal/vegetable-based fertilizer products, supported by expanding domestic production and increasing availability of alternative nutrient products.
China, Italy, the US, and Canada were important suppliers. In 2024, India imported USD 43.9 million and 13,944 tons, with China accounting for USD 7.9 million, Italy USD 7.5 million, the US USD 7.4 million, and Canada USD 6.0 million.
Conversely, India’s exports increased from USD 26 million in 2022 to USD 27 million in 2025, after falling sharply to USD 17 million in 2023. Verified 2024 data show exports at USD 30.8 million, with volumes reaching 22,670 tons, meaning India exported considerably more volume than it imported that year. The US was the largest destination at USD 11.7 million, followed by Nepal at USD 2.3 million and the Philippines at USD 2.0 million.
Overall, the trade pattern suggests India is gradually strengthening its position as an exporter of organic/animal- and vegetable-based fertilizers while reducing import dependence.
India Fertilizer Market Scope
| Category | Segments |
|---|---|
| By Product | Straight Fertilizers (Nitrogenous Fertilizers (Urea, Calcium Ammonium Nitrate, Ammonium Nitrate, Ammonium Sulfate, Anhydrous Ammonia, Others), Phosphatic Fertilizers (Mono-Ammonium Phosphate (MAP), Di-Ammonium Phosphate (DAP), Single Super Phosphate (SSP), Triple Super Phosphate (TSP), Others), Potash Fertilizers (Muriate of Potash (MoP), Sulfate of Potash (SoP)), Secondary Macronutrient Fertilizers (Calcium Fertilizers, Magnesium Fertilizers, Sulfur Fertilizers), Micronutrient Fertilizers (Zinc, Manganese, Copper, Iron, Boron, Molybdenum, Others)), Complex Fertilizers, Bio-fertilizers, Specialty Fertilizers (Water-Soluble Fertilizers, Controlled-Release Fertilizers (CRF), Slow-Release Fertilizers (SRF), Liquid Fertilizers |
| By Form | Conventional (granules/powders for broadcast/soil), Liquid |
| By Crop Type | Grains and Cereals, Pulses and Oilseeds, Fruits and Vegetables, Flowers and Ornamentals, Others |
| By Application | Fertigation, Foliar, Banding, Drip Irrigation |
India Fertilizer Market Growth Drivers
Domestic Urea Capacity Expansion Accelerating Long-Term Supply Security
The approval of the new investment policy for urea 2026 (NIPU 2026) in July 2026 is expected to become a key growth driver for the market by strengthening domestic manufacturing capacity and improving long term supply security. The policy aims to establish 8 to 9 new gas based urea plants with nearly 10 million tonnes of additional annual production capacity, reducing India's dependence on imported urea while creating a stronger and more resilient domestic fertilizer ecosystem capable of meeting rising agricultural demand.
The policy also enhances the commercial attractiveness of new investments through a standardized financial framework that improves project viability. Compared with the earlier NIP 2012 policy, NIPU 2026 is expected to reduce capital expenditure by more than USD 29 million per project while offering an estimated 12% to 16% return on equity and protection against foreign exchange volatility. These measures are expected to encourage greater participation from both public and private sector manufacturers, accelerating capacity creation and supporting long term production expansion across the country.
The policy directly addresses India's structural demand supply imbalance. While 33 operational urea plants currently provide around 26.9 million tonnes of annual production capacity, domestic demand is estimated at nearly 40 million tonnes, leaving a significant supply gap. By narrowing this gap through new capacity additions, NIPU 2026 is expected to improve fertilizer availability, reduce import exposure, strengthen national food security, and create sustained demand for upstream manufacturing, logistics, and distribution activities. The policy has also received support from the Fertiliser Association of India, reflecting positive industry confidence in its long term impact.
Recent Trends
Artificial Intelligence and Precision Nutrient Technologies Transforming Fertilizer Application
Artificial intelligence is emerging as a transformative trend in the industry by shifting nutrient management from volume based application to precision based decision making. During 2026, governments and industry participants accelerated the deployment of AI enabled advisory platforms that optimize fertilizer usage, irrigation scheduling, and crop planning based on field level conditions. At the kisan kumbh in March 2026, union minister Nitin Gadkari highlighted AI and satellite based agriculture as key enablers of a technology driven farming ecosystem, reinforcing the government's focus on improving input efficiency through digital agriculture.
State-level implementation is further accelerating the adoption of precision nutrient management. In February 2026, the government of Maharashtra expanded its MahaVISTAAR AI platform, providing AI-driven advisory services on fertilizer application, irrigation, and government schemes to nearly 2.5 million farmers. The IndiaAI mission is also developing an agriculture casebook to document scalable AI deployments, creating standardized implementation models that can support wider adoption of precision farming practices across states. These initiatives are improving farmer awareness while enabling more efficient fertilizer application based on crop-specific and location-specific requirements.
The trend is also reflected in the growing commercialization of next generation fertilizer technologies. During FY2025 to 2026, IFFCO reported sales of 36.44 million nano fertilizer bottles, representing 46% year on year growth, highlighting increasing acceptance of precision nutrient products. Simultaneously, the continued promotion of nano urea and nano dap under the one nation one fertilizer programme is expected to improve nutrient use efficiency, complement conventional fertilizers, and accelerate the transition toward technology enabled and sustainable fertilizer consumption across India.
India Fertilizer Market Challenges and Opportunities
Strengthening Supply Chain Resilience While Accelerating Sustainable Fertilizer Innovation
India's continued dependence on imported phosphate and potash raw materials remains a key challenge for the industry, exposing manufacturers to geopolitical disruptions and global supply uncertainties. During 2024 to 2025, India consumed around 9.2 million tonnes of DAP, of which nearly 4.5 million tonnes were imported. Domestic rock phosphate production stood at only 1.37 million tonnes, compared with imports of 11.95 million tonnes, highlighting the country's structural dependence on overseas sourcing. This limits domestic pricing flexibility and increases procurement risks despite continued government subsidy support.
The challenge has become more pronounced as intermittent restrictions on DAP exports from China have tightened global availability and increased uncertainty in fertilizer procurement. Such developments underscore the need for a more diversified sourcing strategy and greater domestic resource development to improve long-term supply security, particularly as fertilizer demand continues to rise alongside agricultural production.
Against this backdrop, the growing focus on supply diversification and sustainable production presents significant opportunities for the market. Long-term supply partnerships are being strengthened through international collaborations, while industry participants have maintained adequate fertilizer availability for the Kharif 2026 season despite geopolitical tensions through established sourcing arrangements. In parallel, the proposed expansion of the Jordan India fertilizer company and new global phosphate partnerships are expected to broaden India's sourcing base.
At the same time, policy initiatives supporting green urea and the regulatory standardization of biostimulants under the amended fertilizer control order are creating new avenues for investment in low-carbon fertilizer production and biological crop nutrition. Together, these developments are expected to reduce long-term import dependence, encourage technology adoption, and support a more resilient and sustainable fertilizer ecosystem in India.
Segmentation Insights
Straight Fertilizers Dominating the Market Through Extensive Adoption Across Staple Crop Cultivation
Straight fertilizers accounted for an estimated 68% market share in 2026, making them the dominant product category in the India fertilizer industry. Their leadership is supported by the widespread use of single nutrient fertilizers, particularly urea, DAP, and MOP, across the country's major agricultural regions. These fertilizers enable farmers to apply specific nutrients according to crop and soil requirements while benefiting from well-established distribution networks, government support mechanisms, and consistent product availability.
The dominance of straight fertilizers is further reinforced by the substantial cultivation of rice, wheat, maize, sugarcane, and other nutrient-intensive crops that require regular nitrogen, phosphorus, and potassium application throughout the growing season. Products such as urea remain the backbone of fertilizer consumption because of regulated pricing and extensive accessibility, while phosphatic and potassic fertilizers support balanced nutrient management. Based on product, the market is further bifurcated into:
- Straight Fertilizers
- Complex Fertilizers
- Bio-fertilizers
- Specialty Fertilizers
Conventional Fertilizers Maintaining Leadership Through Broad Compatibility with Traditional Farming Practices
Conventional fertilizers held an estimated 89% market share in 2026, establishing them as the leading form segment in the India fertilizer market. Granular and powdered fertilizers continue to dominate because they are compatible with traditional broadcasting and soil application methods practiced across most agricultural land. Their ease of transportation, storage, and field application, combined with lower acquisition costs compared to specialty formulations, supports extensive adoption among farmers cultivating staple crops under diverse agro climatic conditions.
The continued leadership of conventional fertilizers is also attributed to India's large cultivated area, where manual and mechanized soil application remains the predominant nutrient delivery method. Established retail distribution channels, widespread product availability, and compatibility with existing farm equipment further strengthen their position. Based on form, the market is further bifurcated into:
- Conventional
- Liquid
India Fertilizer Market Competitive Analysis
The India fertilizer industry is moderately consolidated, with competition led by cooperative organizations, central public sector enterprises, integrated agri input companies, and private fertilizer manufacturers across straight fertilizers, complex fertilizers, bio fertilizers, and specialty fertilizers. Major participants include Indian Farmers Fertiliser Cooperative Limited (IFFCO), National Fertilizers Limited, Coromandel International Limited, Chambal Fertilisers and Chemicals Limited, and Rashtriya Chemicals and Fertilizers Limited. The top five players collectively account for approximately 60% of the India fertilizer market.
Key Companies in the India Fertilizer Market
- Indian Farmers Fertiliser Cooperative Limited (IFFCO)
- National Fertilizers Limited
- Coromandel International Limited
- Chambal Fertilisers and Chemicals Limited
- Rashtriya Chemicals and Fertilizers Limited
- Zuari Agro Chemicals Limited
- Deepak Fertilisers and Petrochemicals Corporation Limited
- Gujarat Narmada Valley Fertilizers and Chemicals Limited (GNFC)
- Gujarat State Fertilizers & Chemicals Limited (GSFC)
- Madras Fertilizers Limited
India Fertilizer Industry News and Recent Developments
2025: Ministry of Mines Develops India's First Indigenous Water Soluble Fertilizer Technology
In August 2025, the Ministry of Mines successfully developed India's first indigenous water soluble fertilizer technology after seven years of research. The technology was developed using domestically sourced raw materials and indigenous plant designs, marking a significant advancement in specialty fertilizer manufacturing capabilities. The development aims to reduce import dependence while strengthening India's competitiveness in the global specialty fertilizer industry through locally developed production technologies.
Impact Analysis: This development is expected to enhance domestic manufacturing capabilities for specialty fertilizers by reducing reliance on imported technologies and products. The availability of indigenous water soluble fertilizer technology is likely to encourage capacity expansion, improve supply chain resilience, and support the adoption of advanced fertilizers across horticulture and precision agriculture, thereby strengthening the long term competitiveness of the India Fertilizer Market.
2025: IFFCO Expands Nano DAP Production with Two New Manufacturing Plants
In May 2025, Indian Farmers Fertiliser Cooperative Limited (IFFCO) commissioned two new Nano DAP Liquid manufacturing plants at Aonla in Bareilly district and Phulpur in Prayagraj district, Uttar Pradesh. Each facility has a production capacity of 2 lakh bottles of 500 ml Nano DAP Liquid per day, significantly expanding the cooperative's manufacturing capacity for nano fertilizers and supporting the wider adoption of innovative crop nutrition products.
Impact Analysis: The expansion strengthens India's production capacity for next generation fertilizers while supporting the government's objective of promoting efficient nutrient management. Higher availability of Nano DAP is expected to accelerate farmer adoption of nano fertilizers, improve nutrient use efficiency, and intensify competition among fertilizer manufacturers investing in advanced and sustainable fertilizer technologies.
Frequently Asked Questions
- Market Segmentation
- Introduction
- Product Definition
- Research Process
- Assumptions
- Executive Summary
- India Fertilizer Market Import & Export Trend Analysis 2022-25
- India Fertilizer Market Policies, Regulations, and Product Standards
- India Fertilizer Market Trends & Developments
- India Fertilizer Market Dynamics
- Growth Factors
- Challenges
- India Fertilizer Market Hotspot & Opportunities
- India Fertilizer Market Outlook, 2022-2032
- Market Size & Outlook
- By Revenues (USD Million)
- By Quantity (Thousand Tons)
- Market Segmentation & Outlook
- By Product- Market Size & Forecast 2022-2032, USD Million & Thousand Tons
- Straight Fertilizers
- Nitrogenous Fertilizers
- Urea
- Calcium Ammonium Nitrate
- Ammonium Nitrate
- Ammonium Sulfate
- Anhydrous Ammonia
- Others
- Phosphatic Fertilizers
- Mono-Ammonium Phosphate (MAP)
- Di-Ammonium Phosphate (DAP)
- Single Super Phosphate (SSP)
- Triple Super Phosphate (TSP)
- Others
- Potash Fertilizers
- Muriate of Potash (MoP)
- Sulfate of Potash (SoP)
- Secondary Macronutrient Fertilizers
- Calcium Fertilizers
- Magnesium Fertilizers
- Sulfur Fertilizers
- Micronutrient Fertilizers
- Zinc
- Manganese
- Copper
- Iron
- Boron
- Molybdenum
- Others
- Nitrogenous Fertilizers
- Complex Fertilizers
- Bio-fertilizers
- Specialty Fertilizers
- Water-Soluble Fertilizers
- Controlled-Release Fertilizers (CRF)
- Slow-Release Fertilizers (SRF)
- Liquid Fertilizers
- Straight Fertilizers
- By Form- Market Size & Forecast 2022-2032, USD Million & Thousand Tons
- Conventional (granules/powders for broadcast/soil)
- Liquid
- By Crop Type- Market Size & Forecast 2022-2032, USD Million & Thousand Tons
- Grains and Cereals
- Pulses and Oilseeds
- Fruits and Vegetables
- Flowers and Ornamentals
- Others
- By Application- Market Size & Forecast 2022-2032, USD Million & Thousand Tons
- Fertigation
- Foliar
- Banding
- Drip Irrigation
- By Region- Market Size & Forecast 2022-2032, USD Million & Thousand Tons
- North
- South
- East
- West
- By Company
- Competition Characteristics
- Market Share & Analysis
- By Product- Market Size & Forecast 2022-2032, USD Million & Thousand Tons
- Market Size & Outlook
- India Straight Fertilizers Market Outlook, 2022-2032
- Market Size & Outlook
- By Revenues (USD Million)
- By Quantity (Thousand Tons)
- Market Segmentation & Outlook
- By Form- Market Size & Forecast 2022-2032, USD Million & Thousand Tons
- By Crop Type- Market Size & Forecast 2022-2032, USD Million & Thousand Tons
- By Application- Market Size & Forecast 2022-2032, USD Million & Thousand Tons
- By Region- Market Size & Forecast 2022-2032, USD Million & Thousand Tons
- Market Size & Outlook
- India Complex Fertilizers Market Outlook, 2022-2032
- Market Size & Outlook
- By Revenues (USD Million)
- By Quantity (Thousand Tons)
- Market Segmentation & Outlook
- By Form- Market Size & Forecast 2022-2032, USD Million & Thousand Tons
- By Crop Type- Market Size & Forecast 2022-2032, USD Million & Thousand Tons
- By Application- Market Size & Forecast 2022-2032, USD Million & Thousand Tons
- By Region- Market Size & Forecast 2022-2032, USD Million & Thousand Tons
- Market Size & Outlook
- India Bio-fertilizers Market Outlook, 2022-2032
- Market Size & Outlook
- By Revenues (USD Million)
- By Quantity (Thousand Tons)
- Market Segmentation & Outlook
- By Form- Market Size & Forecast 2022-2032, USD Million & Thousand Tons
- By Crop Type- Market Size & Forecast 2022-2032, USD Million & Thousand Tons
- By Application- Market Size & Forecast 2022-2032, USD Million & Thousand Tons
- By Region- Market Size & Forecast 2022-2032, USD Million & Thousand Tons
- Market Size & Outlook
- India Specialty Fertilizers Market Outlook, 2022-2032
- Market Size & Outlook
- By Revenues (USD Million)
- By Quantity (Thousand Tons)
- Market Segmentation & Outlook
- By Form- Market Size & Forecast 2022-2032, USD Million & Thousand Tons
- By Crop Type- Market Size & Forecast 2022-2032, USD Million & Thousand Tons
- By Application- Market Size & Forecast 2022-2032, USD Million & Thousand Tons
- By Region- Market Size & Forecast 2022-2032, USD Million & Thousand Tons
- Market Size & Outlook
- India Fertilizer Market Key Strategic Imperatives for Success & Growth
- Competitive Outlook
- Company Profiles
- Indian Farmers Fertiliser Cooperative Limited (IFFCO)
- Business Description
- Product Portfolio
- Collaborations & Alliances
- Recent Developments
- Financial Details
- Others
- National Fertilizers Limited
- Business Description
- Product Portfolio
- Collaborations & Alliances
- Recent Developments
- Financial Details
- Others
- Coromandel International Limited
- Business Description
- Product Portfolio
- Collaborations & Alliances
- Recent Developments
- Financial Details
- Others
- Chambal Fertilisers and Chemicals Limited
- Business Description
- Product Portfolio
- Collaborations & Alliances
- Recent Developments
- Financial Details
- Others
- Rashtriya Chemicals and Fertilizers Limited
- Business Description
- Product Portfolio
- Collaborations & Alliances
- Recent Developments
- Financial Details
- Others
- Zuari Agro Chemicals Limited
- Business Description
- Product Portfolio
- Collaborations & Alliances
- Recent Developments
- Financial Details
- Others
- Deepak Fertilisers and Petrochemicals Corporation Limited
- Business Description
- Product Portfolio
- Collaborations & Alliances
- Recent Developments
- Financial Details
- Others
- Gujarat Narmada Valley Fertilizers and Chemicals Limited
- Business Description
- Product Portfolio
- Collaborations & Alliances
- Recent Developments
- Financial Details
- Others
- Gujarat State Fertilizers & Chemicals Limited
- Business Description
- Product Portfolio
- Collaborations & Alliances
- Recent Developments
- Financial Details
- Others
- Madras Fertilizers Limited
- Business Description
- Product Portfolio
- Collaborations & Alliances
- Recent Developments
- Financial Details
- Others
- Indian Farmers Fertiliser Cooperative Limited (IFFCO)
- Company Profiles
- Disclaimer
MarkNtel Advisors follows a robust and iterative research methodology designed to ensure maximum accuracy and minimize deviation in market estimates and forecasts. Our approach combines both bottom-up and top-down techniques to effectively segment and quantify various aspects of the market. A consistent feature across all our research reports is data triangulation, which examines the market from three distinct perspectives to validate findings. Key components of our research process include:
1. Scope & Research Design At the outset, MarkNtel Advisors define the research objectives and formulate pertinent questions. This phase involves determining the type of research—qualitative or quantitative—and designing a methodology that outlines data collection methods, target demographics, and analytical tools. They also establish timelines and budgets to ensure the research aligns with client goals.
2. Sample Selection and Data Collection In this stage, the firm identifies the target audience and determines the appropriate sample size to ensure representativeness. They employ various sampling methods, such as random or stratified sampling, based on the research objectives. Data collection is carried out using tools like surveys, interviews, and observations, ensuring the gathered data is reliable and relevant.
3. Data Analysis and Validation Once data is collected, MarkNtel Advisors undertake a rigorous analysis process. This includes cleaning the data to remove inconsistencies, employing statistical software for quantitative analysis, and thematic analysis for qualitative data. Validation steps are taken to ensure the accuracy and reliability of the findings, minimizing biases and errors.

4. Data Forecast and FinalizationThe final phase involves forecasting future market trends based on the analyzed data. MarkNtel Advisors utilize predictive modeling and time series analysis to anticipate market behaviors. The insights are then compiled into comprehensive reports, featuring visual aids like charts and graphs, and include strategic recommendations to inform client decision-making
We offer flexible licensing options to cater to varying organizational needs. Choose the pricing pack that best suits your requirements:
Buy Now Inquire Before Buying
 Request Customization
 Talk to our Consultant