Global Plant Extracts Market Analysis-2020
By Type (Phytomedicines & Herbal Extracts, Essential Oils, Spices, Flavors & Fragrances), By Application (Pharmaceutical & Dietary Supplements, Food & Beverages, Cosmetics, Others)..., By Source (Leaves, Fruits, flowers and bulbs, Rhizomes & roots, Barks & stems, Others), By Region (North America, South America, Europe, APAC, Middle East, Africa), By Country (U.S, Canada, Mexico, Brazil, Germany, France, Italy, The U.K, Russia & CIS, Spain, China, India, Japan, South Korea, South East Asia, Saudi Arabia, UAE, Turkey, Qatar), By Company Read more
- Food & Beverages
- Feb 2020
- Pages 205
- Report Format: PDF, Excel, PPT
The increasing concern surrounding diseases such as cancer, memory loss, immune system disorder coupled with the rising awareness about the benefits of herbal, ayurvedic medicines and herbal extracts are the major factors propelling the market demand in the Plant Extract market across the globe. Moreover, the usage of plant extracts in cosmetics due to properties such as prevalence from skin infection and skin rejuvenation and the application in the food and beverage industry as the color and taste is contributing to the demand for plant extracts.
According to MarkNtel Advisors’ research report titled “Global Plant Extract Market Analysis, 2020”, the Global Plant Extract market is anticipated to grow at a CAGR of around 15.40% during 2020-25. In 2019, the APAC region dominated the Global Plant Extract market due to the region’s favorable environmental conditions for large-scale plants and raw material availability.
In 2019, the phytomedicine and herbal extract segment dominated the market on an account of the propelling demand from the skincare, nutraceutical, pharmaceutical, and cosmetics industries. Also, the properties such as antioxidants and prevalence from the harmful bacteria are key reasons contributing to the growth in the demand for phytomedicines and herbal extracts in the market across the globe.
By application, pharmaceutical and dietary supplements dominated the market in 2019 due to consumers increasingly shifting from allopathic medicines to herbal and Ayurveda medicine. This shift toward the products made-up from the plant extracts is largely due to soaring awareness about the harmful impact and allergic reactions from the allopathic medicine which can also be fatal.
Also, leaves segment dominated over other sources such as fruits-flowers and bubs, rhizomes and roots, etc. in 2019 owing to the benefits of the leaf extracts such as increasing platelets counts, reducing cholesterol, improving immune systems, etc.
The companies in the plant extract industry with considerable market share are Givaudan, Sensient Technologies, Symrise AG, Kangcare Bioindustry Co., Ltd., etc. These companies are focused on product innovation to gain a competitive edge in the industry.
Frequently Asked Questions
1. Research Process
1.1. Assumptions
1.2. Market Segmentation
1.3. Market Definition
2. Executive Summary
3. Global Plant Extracts Market Outlook, 2015-2025F
3.1. Market Size & Analysis
3.1.1.By Revenues
3.2. Market Share & Analysis
3.2.1.By Type
3.2.1.1. Spices
3.2.1.2. Essential oils
3.2.1.3. Flavors & fragrances
3.2.1.4. Phytomedicines & herbal extracts
3.2.2.By Application
3.2.2.1. Pharmaceutical and dietary supplements
3.2.2.2. Food & beverages
3.2.2.3. Cosmetics
3.2.2.4. Others (personal care products and toiletries)
3.2.3.By Source
3.2.3.1. Leaves
3.2.3.2. Fruits, flowers, and bulbs
3.2.3.3. Rhizomes & roots
3.2.3.4. Barks & stem
3.2.3.5. Others (seeds, pods and berries)
3.2.4.By Region
3.2.4.1. North America
3.2.4.2. South America
3.2.4.3. Europe
3.2.4.4. Asia-Pacific
3.2.4.5. Middle East & Africa
3.2.5.By Company
3.2.5.1. Revenue Shares
3.2.5.2. Strategic Factorial Indexing
3.2.5.3. Competitor Placement in Markntel Quadrant
4. North America Plant Extracts Market Outlook, 2015- 2025F
4.1. Market Size & Analysis
4.1.1.By Revenues
4.2. Market Share & Analysis
4.2.1.By Type
4.2.2.By Application
4.2.3.By Source
4.2.4.By Country
4.2.4.1. US
4.2.4.2. Mexico
4.2.4.3. Canada
4.3. The US Plant Extracts Market Outlook, 2015-2025F
4.3.1.Market Size & Analysis
4.3.1.1. By Revenues
4.3.2.Market Share & Analysis
4.3.2.1. By Type
4.3.2.2. By Application
4.3.2.3. By Source
4.3.2.4. By Region
4.4. Canada Plant Extracts Market Outlook, 2015-2025F
4.4.1.Market Size & Analysis
4.4.1.1. By Revenues
4.4.2.Market Share & Analysis
4.4.2.1. By Type
4.4.2.2. By Application
4.4.2.3. By Source
4.4.2.4. By Region
4.5. Mexico Plant Extracts Market Outlook, 2015-2025F
4.5.1.Market Size & Analysis
4.5.1.1. By Revenues
4.5.2.Market Share & Analysis
4.5.2.1. By Type
4.5.2.2. By Application
4.5.2.3. By Source
4.5.2.4. By Region
5. South America Plant Extracts Market Outlook, 2015- 2025F
5.1. Market Size & Analysis
5.1.1.By Revenues
5.2. Market Share & Analysis
5.2.1.1. By Type
5.2.1.2. By Application
5.2.1.3. By Source
5.2.2.By Country
5.2.2.1. Brazil
5.2.2.2. Others
5.3. Brazil Plant Extracts Market Outlook, 2015-2025F
5.3.1.Market Size & Analysis
5.3.1.1. By Revenues
5.3.2.Market Share & Analysis
5.3.2.1. By Type
5.3.2.2. By Application
5.3.2.3. By Source
5.3.2.4. By Region
6. Europe Plant Extracts Market Outlook, 2015- 2025F
6.1. Market Size & Analysis
6.1.1.By Revenues
6.2. Market Share & Analysis
6.2.1.By Type
6.2.2.By Application
6.2.3.By Source
6.2.4.By Country
6.2.4.1. Germany
6.2.4.2. France
6.2.4.3. UK
6.2.4.4. Others
6.3. Germany Plant Extracts Market Outlook, 2015-2025F
6.3.1.Market Size & Analysis
6.3.1.1. By Revenues
6.3.2.Market Share & Analysis
6.3.2.1. By Type
6.3.2.2. By Application
6.3.2.3. By Source
6.3.2.4. By Region
6.4. France Plant Extracts Market Outlook, 2015-2025F
6.4.1.Market Size & Analysis
6.4.1.1. By Revenues
6.4.2.Market Share & Analysis
6.4.2.1. By Type
6.4.2.2. By Application
6.4.2.3. By Source
6.4.2.4. By Region
6.5. The UK Plant Extracts Market Outlook, 2015-2025F
6.5.1.Market Size & Analysis
6.5.1.1. By Revenues
6.5.2.Market Share & Analysis
6.5.2.1. By Type
6.5.2.2. By Application
6.5.2.3. By Source
6.5.2.4. By Region
7. Asia-Pacific Plant Extracts Market Outlook, 2015- 2025F
7.1. Market Size & Analysis
7.1.1.By Revenues
7.2. Market Share & Analysis
7.2.1.1. By Type
7.2.1.2. By Application
7.2.1.3. By Source
7.2.1.4. By Country
7.2.1.4.1. China
7.2.1.4.2. India
7.2.1.4.3. Japan
7.2.1.4.4. South East Asia
7.3. China Plant Extracts Market Outlook, 2015-2025F
7.3.1.Market Size & Analysis
7.3.1.1. By Revenues
7.3.2.Market Share & Analysis
7.3.2.1. By Type
7.3.2.2. By Application
7.3.2.3. By Source
7.3.2.4. By Region
7.4. India Plant Extracts Market Outlook, 2015-2025F
7.4.1.Market Size & Analysis
7.4.1.1. By Revenues
7.4.2.Market Share & Analysis
7.4.2.1. By Type
7.4.2.2. By Application
7.4.2.3. By Source
7.4.2.4. By Region
7.5. Japan Plant Extracts Market Outlook, 2015-2025F
7.5.1.Market Size & Analysis
7.5.1.1. By Revenues
7.5.2.Market Share & Analysis
7.5.2.1. By Type
7.5.2.2. By Application
7.5.2.3. By Source
7.5.2.4. By Region
7.6. South East Plant Extracts Market Outlook, 2015-2025F
7.6.1.Market Size & Analysis
7.6.1.1. By Revenues
7.6.2.Market Share & Analysis
7.6.2.1. By Type
7.6.2.2. By Application
7.6.2.3. By Source
7.6.2.4. By Region
8. Middle East & Africa Plant Extracts Market Outlook, 2015- 2025F
8.1. Market Size & Analysis
8.1.1.By Revenues
8.2. Market Share & Analysis
8.2.1.1. By Type
8.2.1.2. By Application
8.2.1.3. By Source
8.2.1.4. By Country
8.2.1.4.1. Saudi Arabia
8.2.1.4.2. UAE
8.2.1.4.3. Qatar
8.2.1.4.4. Turkey
8.3. Saudi Arabia Plant Extracts Market Outlook, 2015-2025F
8.3.1.Market Size & Analysis
8.3.1.1. By Revenues
8.3.2.Market Share & Analysis
8.3.2.1. By Type
8.3.2.2. By Application
8.3.2.3. By Source
8.3.2.4. By Region
8.4. UAE Plant Extracts Market Outlook, 2015-2025F
8.4.1.Market Size & Analysis
8.4.1.1. By Revenues
8.4.2.Market Share & Analysis
8.4.2.1. By Type
8.4.2.2. By Application
8.4.2.3. By Source
8.4.2.4. By Region
8.5. Turkey Plant Extracts Market Outlook, 2015-2025F
8.5.1.Market Size & Analysis
8.5.1.1. By Revenues
8.5.2.Market Share & Analysis
8.5.2.1. By Type
8.5.2.2. By Application
8.5.2.3. By Source
8.5.2.4. By Region
8.6. South Africa Plant Extracts Market Outlook, 2015-2025F
8.6.1.Market Size & Analysis
8.6.1.1. By Revenues
8.6.2.Market Share & Analysis
8.6.2.1. By Type
8.6.2.2. By Application
8.6.2.3. By Source
8.6.2.4. By Region
9. Global Plant Extracts Market Policies, Regulations, Product Standards
10. Global Plant Extracts Market Trends & Insights
11. Global Plant Extracts Market Dynamics
11.1. Growth Drivers
11.2. Challenges
11.3. Impact Analysis
12. Global Plant Extracts Market Hotspot and Opportunities
13. Global Plant Extracts Market Key Strategic Imperatives for Success and Growth
14. Competition Outlook
14.1. Competition Matrix
14.1.1. Product Portfolio
14.1.2. Brand Specialization
14.1.3. Target Markets
14.1.4. Target End Users
14.1.5. Research & Development
14.1.6. Strategic Alliances
14.1.7. Strategic Initiatives
14.2. Company Profiles (Business Description, Product Segments, Business Segments, Financials, Strategic Alliances/ Partnerships, Future Plans)
14.2.1. Givaudan
14.2.2. Sensient Technologies
14.2.3. Symrise AG
14.2.4. Kangcare Bioindustry Co., Ltd.
14.2.5. PT. Indesso Aroma
14.2.6. PT. Haldin Pacific Semesta
14.2.7. Vidya Herbs Private Limited
14.2.8. Tokiwa Phytochemical Co., Ltd.
14.2.9. Native Extracts Pty. Ltd.
14.2.10. Shaanxi Jiahe Phytochem Co., Ltd.
15. Disclaimer
MarkNtel Advisors follows a robust and iterative research methodology designed to ensure maximum accuracy and minimize deviation in market estimates and forecasts. Our approach combines both bottom-up and top-down techniques to effectively segment and quantify various aspects of the market. A consistent feature across all our research reports is data triangulation, which examines the market from three distinct perspectives to validate findings. Key components of our research process include:
1. Scope & Research Design At the outset, MarkNtel Advisors define the research objectives and formulate pertinent questions. This phase involves determining the type of research—qualitative or quantitative—and designing a methodology that outlines data collection methods, target demographics, and analytical tools. They also establish timelines and budgets to ensure the research aligns with client goals.
2. Sample Selection and Data Collection In this stage, the firm identifies the target audience and determines the appropriate sample size to ensure representativeness. They employ various sampling methods, such as random or stratified sampling, based on the research objectives. Data collection is carried out using tools like surveys, interviews, and observations, ensuring the gathered data is reliable and relevant.
3. Data Analysis and Validation Once data is collected, MarkNtel Advisors undertake a rigorous analysis process. This includes cleaning the data to remove inconsistencies, employing statistical software for quantitative analysis, and thematic analysis for qualitative data. Validation steps are taken to ensure the accuracy and reliability of the findings, minimizing biases and errors.
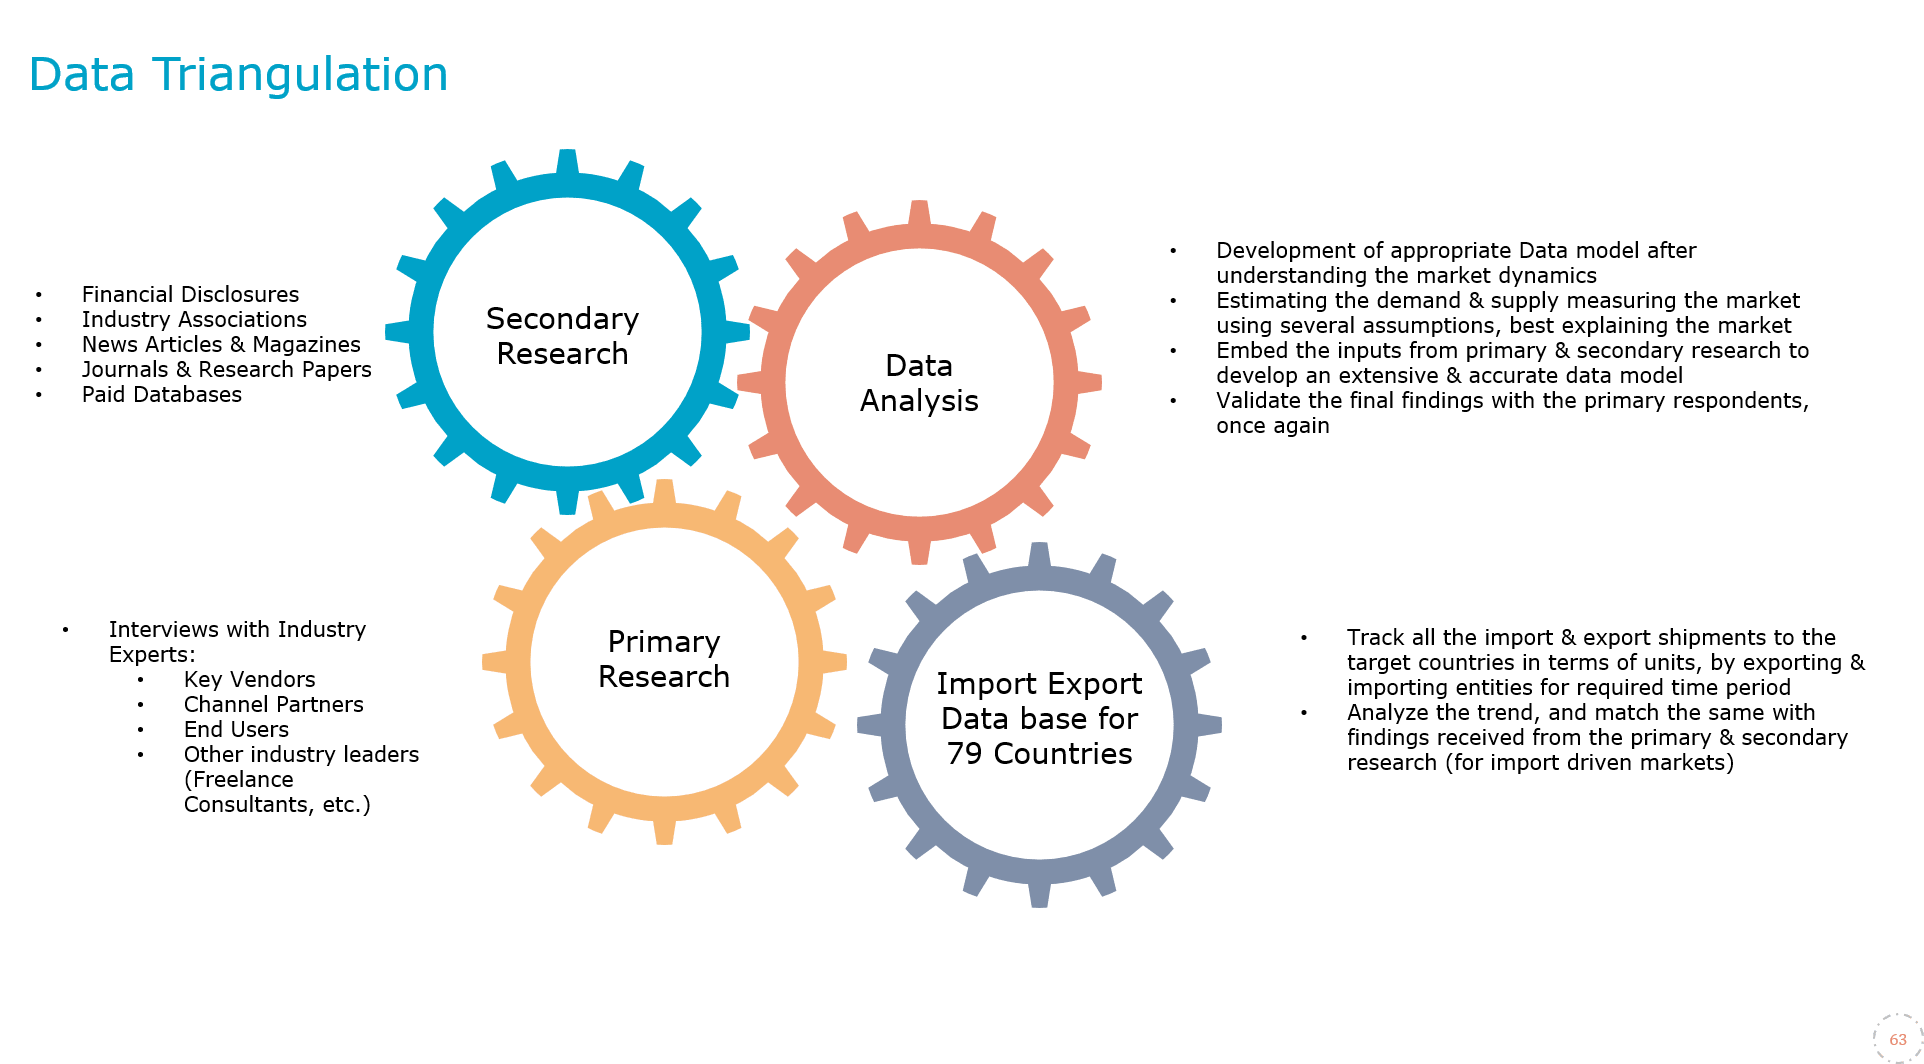
4. Data Forecast and FinalizationThe final phase involves forecasting future market trends based on the analyzed data. MarkNtel Advisors utilize predictive modeling and time series analysis to anticipate market behaviors. The insights are then compiled into comprehensive reports, featuring visual aids like charts and graphs, and include strategic recommendations to inform client decision-making

