

By Component (Solutions, Services), By Deployment Mode (Cloud, On-Premises), By Organization Size (Corporate Enterprises, Mid-Tier Enterprises, Small Businesses), By Vertical (Manufacturing, Energy &... ... facturing, Energy & Utilities, Residential & Commercial Buildings, Transportation & Logistics, IT & Telecom, Financial Services, Government), and others Read more
- Environment
- Jul 2026
- 165
- PDF, Excel, PPT
India Carbon Footprint Management Market Key Takeaways
- The India carbon footprint management market was valued at USD 0.67 billion in 2025, is estimated at USD 0.73 billion in 2026, and is projected to reach USD 1.62 billion by 2032.
- The industry is projected to witness steady growth at a CAGR of 14.21% during 2026–2032.
- By Deployment Mode cloud-based solutions dominate the market, accounting for 74% of the total market share.
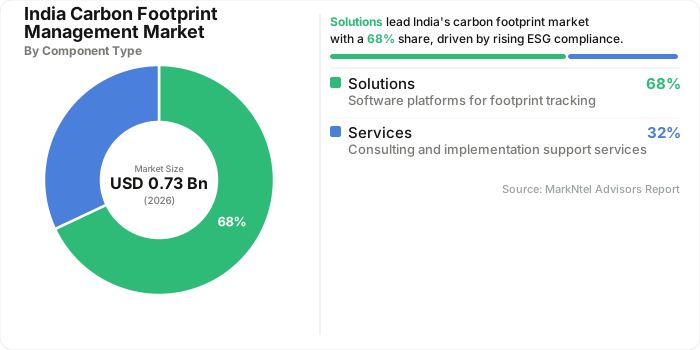
- By Component the Solutions segment leads the market with a 68% share.
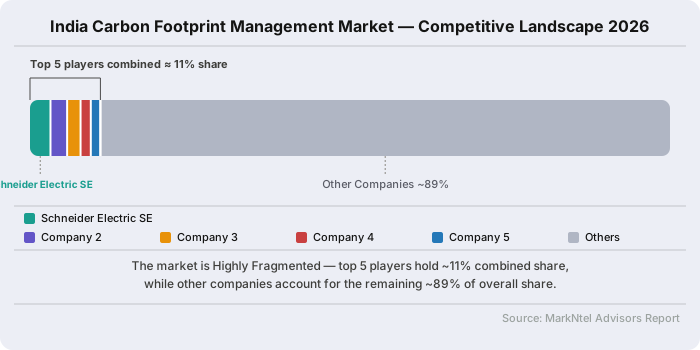
- The market is fragmented, with the top five players collectively accounting for approximately 11% of the total market share.
India Carbon Footprint Management Market Size and Outlook
The carbon footprint management industry in India was valued at USD 0.67 billion in 2025, to 0.73 billion and is projected to reach USD 1.62 billion by 2032, expanding at a CAGR of 14.21% during 2026–2032.
Market growth is being driven by the transition from voluntary sustainability initiatives to mandatory greenhouse gas (GHG) emissions monitoring, reporting, and verification, supported by evolving climate regulations and the implementation of India's domestic carbon market.
A major catalyst is the Carbon Credit Trading Scheme (CCTS), under which the Ministry of Environment, Forest and Climate Change (MoEFCC) has notified GHG emission intensity targets for seven energy-intensive sectors: aluminum, cement, chlor-alkali, pulp and paper, petroleum refining, petrochemicals, and textiles. Effective from FY2025–26, the framework covers approximately 490 obligated entities, using FY2023–24 as the baseline year. As these industries are required to monitor, verify, and report emissions for compliance, demand is increasing for carbon accounting software, emissions monitoring platforms, data management solutions, and verification services.
India's carbon management ecosystem has also been strengthened by the Bureau of Energy Efficiency's (BEE) Perform, Achieve and Trade (PAT) Programme, which enabled industrial facilities to avoid more than 106 million tonnes of CO₂ emissions between 2015 and June 2024. The Programme established robust energy and emissions data collection practices, providing a strong foundation for the wider adoption of enterprise carbon footprint management solutions as industries transition toward comprehensive GHG accounting under the CCTS.
Corporate demand is further supported by the Securities and Exchange Board of India's (SEBI) Business Responsibility and Sustainability Report (BRSR) Core framework, which requires India's top 1,000 listed companies to disclose GHG emissions and other sustainability metrics, while reasonable assurance has become mandatory for the top 500 listed companies from FY2025–26. These evolving disclosure requirements are encouraging enterprises to invest in automated carbon accounting, ESG reporting, and audit-ready emissions management platforms.
Companies such as Infosys have already implemented enterprise-wide GHG Protocol-aligned carbon management systems and internal carbon pricing mechanisms to maintain carbon neutrality certifications, reflecting the growing integration of carbon management into corporate governance and business strategy.
With compliance obligations expanding across industrial sectors, sustainability disclosure standards becoming more rigorous, and India's carbon trading ecosystem taking shape, organizations are increasingly adopting digital platforms for continuous emissions monitoring, regulatory reporting, and carbon performance management. Consequently, carbon footprint management solutions are expected to become a core component of industrial operations, ESG governance, and long-term decarbonization strategies throughout the forecast period.
India Carbon Footprint Management Market Key Indicators
- The expansion of the Ministry of Environment, Forest and Climate Change's (MoEFCC) Carbon Credit Trading Scheme (CCTS) is significantly increasing demand in the India carbon footprint management market. As of January 2026, the scheme covers more than 700 million tonnes of CO₂ equivalent emissions across nine energy-intensive sectors, requiring industrial facilities to continuously monitor, measure, verify, and report their greenhouse gas (GHG) emissions. These mandatory compliance requirements are accelerating the adoption of carbon accounting software, emissions monitoring platforms, data management solutions, and verification services among large industrial enterprises.
- India's expanding non-fossil power generation capacity is increasing the demand for carbon footprint management solutions. According to the Ministry of Power, India's total installed power generation capacity reached 513,730 MW as of December 31, 2025, of which 266,788 MW (51.93%) came from non-fossil energy sources. As the electricity generation mix continues to evolve, organizations must regularly update Scope 2 emission factors to accurately calculate indirect emissions. This is driving greater adoption of carbon accounting software and emissions management platforms that automate emissions calculations, ensure reporting accuracy, and support regulatory and ESG compliance.
- The expansion of the National Green Hydrogen Mission is creating additional demand for carbon footprint management solutions in India. The Ministry of New and Renewable Energy (MNRE) confirmed incentives for 862,000 metric tonnes per annum (MTPA) of green hydrogen production awarded to 18 companies under the mission. To qualify for incentives and maintain green hydrogen certification, participating facilities must establish robust greenhouse gas (GHG) emissions baseline monitoring, measurement, and verification systems. This is driving investments in carbon accounting software, emissions monitoring platforms, and verification solutions to ensure compliance with certification and regulatory requirements.
India Carbon Footprint Management Market Scope
| Category | Segments |
|---|---|
| By Component | Solutions, Services |
| By Deployment Mode | Cloud, On-Premises |
| By Organization Size | Corporate Enterprises, Mid-Tier Enterprises, Small Businesses |
| By Vertical | Manufacturing, Energy & Utilities, Residential & Commercial Buildings, Transportation & Logistics, IT & Telecom, Financial Services, Government |
India Carbon Footprint Management Market Growth Drivers
RBI's Climate Risk Disclosure Framework Driving Demand for Carbon Footprint Management Solutions
The Reserve Bank of India's (RBI) Climate Finance and Management of Climate Change Risks Directions, 2025, issued on November 28, 2025, are expanding the adoption of carbon footprint management solutions across India's financial sector and corporate ecosystem. The framework requires scheduled commercial banks, all-India financial institutions, and upper-layer NBFCs to establish climate risk governance frameworks and disclose climate-related information from FY2025–26.
The regulations require financial institutions to measure and disclose Scope 1, Scope 2, and Scope 3 greenhouse gas (GHG) emissions, including financed emissions associated with their lending and investment portfolios. To meet these disclosure requirements, banks are increasingly adopting carbon accounting, emissions data management, and climate reporting platforms capable of collecting, verifying, and analyzing emissions data across portfolios.
The RBI is further strengthening the reporting ecosystem through the development of the Reserve Bank–Climate Risk Information System (RB-CRIS), a centralized repository designed to standardize carbon emissions intensity and sectoral transition data. This initiative is expected to improve data consistency and enhance climate-related risk assessment across the financial system.
As lenders increasingly require reliable emissions data to assess climate-related risks and comply with regulatory disclosures, borrowing companies particularly those operating in carbon-intensive industries are under growing pressure to measure, verify, and report their GHG emissions. This is expanding demand for carbon accounting software, emissions monitoring platforms, and sustainability reporting solutions beyond large listed companies to a broader base of corporate borrowers, supporting the growth of the India carbon footprint management market.
Recent Trends
Generative AI Transforming Carbon Footprint Management into Predictive Decarbonization
The India carbon footprint management market is witnessing a shift from traditional carbon accounting toward Generative AI-driven decarbonization planning. While conventional platforms primarily focused on measuring and reporting greenhouse gas (GHG) emissions, the next generation of solutions is enabling organizations to proactively identify the most effective pathways for reducing emissions. By integrating operational, energy, and process data, Generative AI can simulate multiple decarbonization scenarios, recommend equipment-level process improvements, optimize energy consumption, and predict the carbon impact of operational changes before implementation. This evolution is allowing organizations to move beyond compliance-driven reporting toward data-driven emissions reduction strategies.
The trend gained practical validation in April 2026, when Schneider Electric, in collaboration with Microsoft and h2e POWER, deployed India's first fully autonomous solid oxide electrolyzer system for green hydrogen production. The AI-powered solution continuously optimized thermal management, hydrogen flow, electricity consumption, and equipment performance in real time, reducing energy consumption by up to 10% while enabling autonomous operations for more than 6,000 hours.
Such deployments demonstrate how AI is evolving from a carbon measurement tool into an intelligent decision-support system that helps industries continuously optimize processes, improve energy efficiency, and achieve measurable emissions reductions, thereby strengthening demand for advanced carbon footprint management platforms across India's industrial sector.
India Carbon Footprint Management Market Opportunities and Challenges
Verification Capacity Bottlenecks Under CCTS Driving Demand for Automated MRV Platforms
The Grid Controller of India Limited registry for Carbon Credit Certificate issuance remained not fully operational as of November 2025, even as obligated entities face a July 2026 deadline to submit BEE-verified emissions data. Once all nine energy-intensive sectors are notified, approximately 740 entities will carry legally binding emission intensity targets for the compliance years 2025-26 and 2026-27. The Bureau of Energy Efficiency opened three separate stakeholder-comment rounds for provisionally eligible Accredited Carbon Verification Agencies between February and April 2026, signaling that the existing verifier pool has not kept pace with this compliance load. Manufacturers across aluminum, cement, and steel face direct compliance risk without timely third-party verification.
However, this verification shortfall is opening a distinct commercial segment for digital MRV platforms built to close the compliance gap. Carbon Neeti, a purpose-built CCTS compliance platform, tracks baseline emissions data for approximately 592 of the 740-plus obligated entities identified by BEE, automating gate-to-gate Scope 1 and Scope 2 calculations and generating reports in BEE-prescribed formats. As the verifier bottleneck persists through the 2026 compliance cycle, platforms that shorten the path from raw production data to verifier-ready reports convert a regulatory constraint into recurring compliance-software revenue.
Segmentation Insights
Solutions with a Market Share of 68%, Would Remain the Most Preferred Component Among Enterprises
The Solutions segment captures the significant shares in the India carbon footprint management market, as organizations increasingly require software platforms that enable continuous greenhouse gas (GHG) emissions monitoring, automated carbon accounting, and regulatory reporting. Unlike consulting services, which are generally engagement-based, carbon management solutions provide year-round emissions measurement, audit-ready reporting, and integration with enterprise systems, making them essential for ongoing compliance.
This demand has strengthened following the Bureau of Energy Efficiency's (BEE) Detailed Procedure for the Compliance Mechanism under the Carbon Credit Trading Scheme (CCTS), issued in March 2025, which requires obligated industries to calculate and report gate-to-gate GHG emission intensity during every compliance cycle against a fixed FY2023–24 baseline.
Supporting this trend, Pune-based Sprih secured USD 3 million in seed funding in February 2025 to expand its AI-powered platform for automated Scope 1, Scope 2, and Scope 3 emissions tracking, reflecting rising enterprise demand for scalable carbon management software. As carbon reporting transitions from a periodic compliance exercise to a continuous operational requirement, organizations are increasingly investing in integrated software solutions over standalone advisory services, ensuring the Solutions segment maintains its leadership throughout the forecast period. By components, the market is further subdivided into the following sub-categories:
- Solutions
- Services
Cloud with a Market Share of 74%, Witnessed the Highest Adoption Due to Scalable Carbon Data Management
The Cloud deployment mode accounts for largest shares in the India carbon footprint management market, driven by the growing need for centralized, scalable, and real-time carbon emissions management across geographically distributed operations. Cloud-based platforms enable organizations to continuously capture greenhouse gas (GHG) emissions data from multiple facilities, integrate information from enterprise resource planning (ERP), IoT, and energy management systems, and generate audit-ready sustainability reports with minimal IT infrastructure. Compared with on-premises deployments, cloud solutions offer faster implementation, automatic regulatory updates, easier supplier collaboration for Scope 3 emissions reporting, and lower upfront investment, making them the preferred choice for enterprises operating across multiple locations.
The segment's leadership is further supported by India's expanding digital carbon ecosystem. In October 2025, Bharti Airtel Business partnered with IBM to enhance Airtel Cloud with AI-ready hybrid cloud capabilities, enabling enterprises to manage data-intensive applications, including ESG and sustainability reporting, through secure cloud infrastructure. Further accelerating digital adoption, the Government of India launched the Indian Carbon Market (ICM) Portal in April 2026, providing a unified digital platform for registration, Monitoring, Reporting and Verification (MRV), carbon credit issuance, and trading under the Carbon Credit Trading Scheme (CCTS).
These developments are encouraging enterprises to adopt cloud-based carbon management platforms, reinforcing the Cloud segment's leadership throughout the forecast period. By deployment mode the market is further segmented into the following sub-categories:
- Cloud
- On-Premises
India Carbon Footprint Management Market Competitive Landscape
The India carbon footprint management market is fragmented, with the top five players accounting for approximately 11% of the total market share. Leading companies include Schneider Electric SE, SAP SE, IBM India Pvt. Ltd. (IBM Envizi), Tata Consultancy Services Limited (TCS), and Infosys Limited, while numerous domestic sustainability consultancies, ESG advisory firms, and niche carbon accounting solution providers contribute to the competitive landscape.
Major Companies in the India Carbon Footprint Management Market
- Schneider Electric SE
- SAP SE
- IBM India Pvt. Ltd. (IBM En vizi)
- Tata Consultancy Services Limited (TCS)
- Infosys Limited
- Wipro Limited
- Tech Mahindra Limited
- EKI Energy Services Limited
- Deloitte Touche Tohmatsu India LLP
- ERM India Private Limited
India Carbon Footprint Management Industry News and Recent developments
2025: Tata Consultancy Services Partners with Tata Motors to Deploy the Prakriti Sustainability Platform Across Indian Operations
On October 30, 2025, Tata Consultancy Services entered a five-year partnership with Tata Motors to power its sustainability platform, Prakriti, built on the AI-driven TCS Intelligent Urban Exchange. According to TCS, the platform digitizes ESG data and enables real-time monitoring, automated compliance reporting, and Scope 3 emissions capture across all manufacturing plants and tier-1, tier-2, and tier-3 supplier networks.
Impact Analysis: Multi-year, value-chain-wide deployments of this scale signal that Indian manufacturers are shifting from spreadsheet-based reporting to embedded emissions platforms, deepening demand for AI-enabled Scope 3 data capture and raising switching costs that favour incumbent platform providers.
2025: SAP SE Launches Green Ledger Carbon Accounting Solution, Co-developed with India's TCS
SAP announced general availability of SAP Green Ledger, a carbon accounting solution that allocates emissions to specific financial transactions within SAP S/4HANA, allowing companies to manage carbon with the same rigor as financial data. According to SAP, the solution was shaped with strategic advisors including Tata Consultancy Services, Deloitte, Accenture, EY, and PwC, and targets disclosure regimes including India's Business Responsibility and Sustainability Report.
Impact: Financial-grade carbon accounting integrated into core ERP systems addresses the assurance and auditability gap facing India's BRSR-obligated top 1,000 listed companies, positioning ERP-native tools as a competitive alternative to standalone reporting software.
2026: IBM Launches En-vizi Emissions API to Embed Carbon Calculations into Enterprise Workflows
In 2026, IBM launched the En-vizi Emissions API, enabling companies and software vendors to embed Scope 1, 2, and 3 greenhouse gas calculations directly into existing systems rather than standalone tools. According to IBM, the API draws on a library of more than 140,000 globally recognised emission datasets and is built on GHG Protocol methodologies.
Impact: Shifting emissions accounting from periodic reporting toward continuous, decision-grade data reduces enterprise dependence on manual reconciliation, lowering the operational cost of compliance for Indian firms and intensifying competition among platform vendors on calculation accuracy and integration depth.
2025: EKI Energy Services Selected as Carbon Consultant for the Varanasi Smart City Bio-Conversion Project
On April 9, 2025, EKI Energy Services announced its selection as Carbon Consultant for the Varanasi Smart City Bio-Conversion Project. According to EKI, the initiative targets an estimated 33,187 tonnes of CO₂-equivalent emission reduction over seven years and produces 2,500–2,800 kg per day of compressed biogas, advancing India's goals under the SATAT scheme.
Impact: Municipal and smart-city mandates are emerging as a distinct demand stream for carbon quantification and advisory services, broadening the addressable market beyond corporate reporting toward public-sector project-level accreditation and monitoring engagements.
- Market Segmentation
- Introduction
- Product Definition
- Research Process
- Assumptions
- Executive Summary
- India Carbon Footprint Management Market Policies, Regulations, and Product Standards
- India Carbon Footprint Management Market Trends & Developments
- India Carbon Footprint Management Market Dynamics
- Growth Factors
- Challenges
- India Carbon Footprint Management Market Hotspot & Opportunities
- India Carbon Footprint Management Market Outlook, 2022-2032
- Market Size & Outlook
- By Revenues (USD Million)
- Market Share & Outlook
- By Component- Market Size & Forecast 2022-2032, USD Million
- Solutions
- Services
- Consulting
- Integration & Deployment
- Support & Maintenance
- By Deployment Mode- Market Size & Forecast 2022-2032, USD Million
- Cloud
- On-Premises
- By Organization Size- Market Size & Forecast 2022-2032, USD Million
- Corporate Enterprises
- Mid-Tier Enterprises
- Small Businesses
- By Vertical- Market Size & Forecast 2022-2032, USD Million
- Manufacturing
- Food & Beverages
- Metals & Mining
- Chemical & Materials
- Electronics & Consumer Goods
- Automotive
- Pharmaceutical & Healthcare
- Others
- Energy & Utilities
- Residential & Commercial Buildings
- Transportation & Logistics
- IT & Telecom
- Financial Services
- Government
- Manufacturing
- By Region - Market Size & Forecast 2022-2032, USD Million
- North
- South
- East
- West
- Central
- By Company
- Competition Characteristics
- Market Share & Analysis
- By Component- Market Size & Forecast 2022-2032, USD Million
- Market Size & Outlook
- India Carbon Footprint Management Solutions Market Outlook, 2022-2032
- Market Size & Outlook
- By Revenues (USD Million)
- Market Share & Outlook
- By Deployment Mode- Market Size & Forecast 2022-2032, USD Million
- By Organization Size- Market Size & Forecast 2022-2032, USD Million
- By Vertical- Market Size & Forecast 2022-2032, USD Million
- By Region - Market Size & Forecast 2022-2032, USD Million
- Market Size & Outlook
- India Carbon Footprint Management Services Market Outlook, 2022-2032
- Market Size & Outlook
- By Revenues (USD Million)
- Market Share & Outlook
- By Deployment Mode- Market Size & Forecast 2022-2032, USD Million
- By Organization Size- Market Size & Forecast 2022-2032, USD Million
- By Vertical- Market Size & Forecast 2022-2032, USD Million
- By Region - Market Size & Forecast 2022-2032, USD Million
- Market Size & Outlook
- India Carbon Footprint Management Market Key Strategic Imperatives for Success & Growth
- Competitive Outlook
- Company Profiles
- Schneider Electric SE
- Business Description
- Product Portfolio
- Collaborations & Alliances
- Recent Developments
- Financial Details
- Others
- SAP SE
- Business Description
- Product Portfolio
- Collaborations & Alliances
- Recent Developments
- Financial Details
- Others
- IBM India Pvt. Ltd. (IBM Envizi)
- Business Description
- Product Portfolio
- Collaborations & Alliances
- Recent Developments
- Financial Details
- Others
- Tata Consultancy Services (TCS)
- Business Description
- Product Portfolio
- Collaborations & Alliances
- Recent Developments
- Financial Details
- Others
- Infosys Limited
- Business Description
- Product Portfolio
- Collaborations & Alliances
- Recent Developments
- Financial Details
- Others
- Wipro Limited
- Business Description
- Product Portfolio
- Collaborations & Alliances
- Recent Developments
- Financial Details
- Others
- Tech Mahindra Limited
- Business Description
- Product Portfolio
- Collaborations & Alliances
- Recent Developments
- Financial Details
- Others
- EKI Energy Services Ltd.
- Business Description
- Product Portfolio
- Collaborations & Alliances
- Recent Developments
- Financial Details
- Others
- Deloitte Touche Tohmatsu India LLP
- Business Description
- Product Portfolio
- Collaborations & Alliances
- Recent Developments
- Financial Details
- Others
- ERM India Pvt. Ltd.
- Business Description
- Product Portfolio
- Collaborations & Alliances
- Recent Developments
- Financial Details
- Others
- Schneider Electric SE
- Company Profiles
- Disclaimer

MarkNtel Advisors follows a robust and iterative research methodology designed to ensure maximum accuracy and minimize deviation in market estimates and forecasts. Our approach combines both bottom-up and top-down techniques to effectively segment and quantify various aspects of the market. A consistent feature across all our research reports is data triangulation, which examines the market from three distinct perspectives to validate findings. Key components of our research process include:
1. Scope & Research Design At the outset, MarkNtel Advisors define the research objectives and formulate pertinent questions. This phase involves determining the type of research—qualitative or quantitative—and designing a methodology that outlines data collection methods, target demographics, and analytical tools. They also establish timelines and budgets to ensure the research aligns with client goals.
2. Sample Selection and Data Collection In this stage, the firm identifies the target audience and determines the appropriate sample size to ensure representativeness. They employ various sampling methods, such as random or stratified sampling, based on the research objectives. Data collection is carried out using tools like surveys, interviews, and observations, ensuring the gathered data is reliable and relevant.
3. Data Analysis and Validation Once data is collected, MarkNtel Advisors undertake a rigorous analysis process. This includes cleaning the data to remove inconsistencies, employing statistical software for quantitative analysis, and thematic analysis for qualitative data. Validation steps are taken to ensure the accuracy and reliability of the findings, minimizing biases and errors.

4. Data Forecast and FinalizationThe final phase involves forecasting future market trends based on the analyzed data. MarkNtel Advisors utilize predictive modeling and time series analysis to anticipate market behaviors. The insights are then compiled into comprehensive reports, featuring visual aids like charts and graphs, and include strategic recommendations to inform client decision-making
We offer flexible licensing options to cater to varying organizational needs. Choose the pricing pack that best suits your requirements:
Buy Now Inquire Before Buying
 Request Customization