
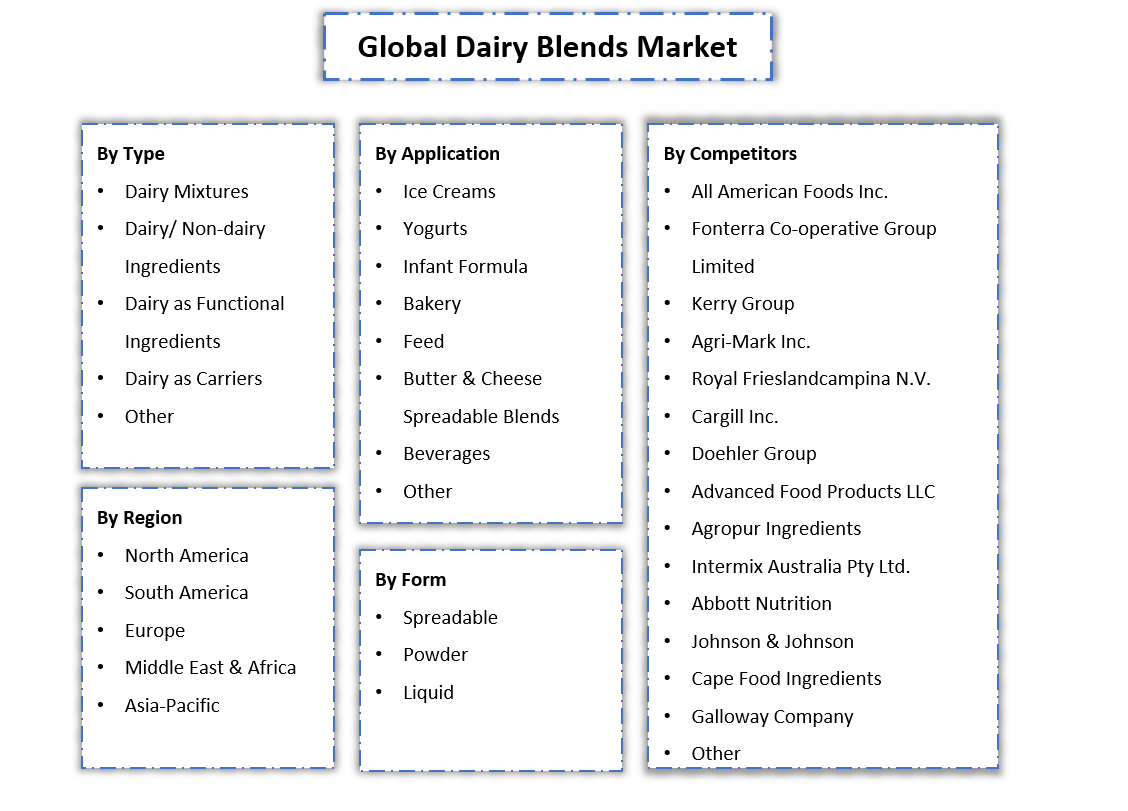
By Type (Dairy Mixtures, Dairy/ Non-dairy Ingredients, Dairy as Functional Ingredients, Dairy as Carriers, Other), By Application (Ice Creams, Yogurts, Infant Formula, Bakery, Feed......, Butter & Cheese Spreadable Blends, Beverages, Other), By Form (Spreadable, Powder, Liquid), By Region (North America, South America, Europe, Middle East & Africa, Asia-Pacific), By Company (All American Foods Inc., Fonterra Co-operative Group Limited, Kerry Group, Agri-Mark Inc., Royal Frieslandcampina N.V., Cargill Inc., Doehler Group, Advanced Food Products LLC, Agropur Ingredients, Intermix Australia Pty Ltd., Abbott Nutrition, Johnson & Johnson, Cape Food Ingredients, Galloway Company, Other) Read more
- Food & Beverages
- Jul 2023
- 190
- PDF, Excel, PPT
Market Definition
Dairy Blends, or concentrated cream mixtures combined with butter, are formulated without saturated fat. These can be customized by incorporating ingredients like sugar, salt, flavors, spices, and other vegetable oils, catering to different tastes and preferences. These blends combine thick creams derived from vegetable oils, cocoa, almonds, or other non-dairy sources with a mixture of butter and vegetable oil, excluding saturated fat.
Market Insights & Analysis: Global Dairy Blends Market (2023-28)
The Global Dairy Blends Market is expected to grow at a CAGR of around 7.6% during the forecast period, i.e., 2023-28. The growth of the market would be fueled by the mounting interest of consumers in products that promote overall well-being, i.e., gravitating them toward dairy blends owing to their remarkable nutritional benefits over traditional milk products. By combining dairy with other protein sources, these blends provide consumers with a range of essential nutrients. Apart from the essential nutrients, these blends comprise lower fat content, making it highly appealing to health-conscious customers who prioritize the nutritional content of their food choices.
Another factor contributing to the growth of the dairy blends market is the availability of diverse flavors. Manufacturers continuously experiment with different flavor combinations to meet the varied demand for innovative dairy blends. This variety of flavors appeals to consumers seeking unique & enjoyable taste experiences. Moreover, these blends can be utilized in various forms across different industries. For instance, powdered dairy blends can be used as sweeteners and stabilizers in yogurts and ice creams.
| Report Coverage | Details |
|---|---|
| Study Period | Historical Data: 2018-21 |
| Base Year: 2022 | |
| Forecast Period: 2023-28 | |
| CAGR (2023-2028) | 7.6% |
| Regions Covered | North America: US, Canada, Mexico |
| Europe: Germany, The UK, France, Spain, Italy, Rest of Europe | |
| Asia-Pacific: China, India, Japan, South Korea, Australia, Rest of Asia-Pacific | |
| South America: Brazil, Argentina, Rest of South America | |
| Middle East & Africa: UAE, Saudi Arabia, South Africa, Rest of MEA | |
| Key Companies Profiled | All American Foods Inc., Fonterra Co-operative Group Limited, Kerry Group, Agri-Mark Inc., Royal Frieslandcampina N.V., Cargill Inc., Doehler Group, Advanced Food Products LLC, Agropur Ingredients, Intermix Australia Pty Ltd., Abbott Nutrition, Johnson & Johnson, Cape Food Ingredients, Galloway Company, Other |
| Unit Denominations | USD Million/Billion |
This adaptability enables manufacturers to incorporate dairy blends into a wide range of products, expanding their market reach. The demand for dairy blend products is particularly pronounced in the food and beverage industry, where they serve as functional ingredients in many processed foods. Besides, the increasing awareness about healthy eating and the shift towards convenient and ready-to-eat foods have fueled the demand for dairy blends in the production of such food products. Furthermore, the nutraceutical industry's growing demand for protein dairy blends, such as whey protein blends, has also contributed to the growth of the dairy blends market. These protein-rich blends cater to consumers seeking functional & nutritional benefits in their dietary supplements.
However, the market for dairy blends faces challenges due to consumer reluctance to adopt them over traditional dairy products. In several developed & developing markets, food & beverage manufacturers prefer using conventional dairy products like butter & margarine instead of dairy blends as they have concerns that dairy blends may negatively impact the taste of food products, i.e., a prominent challenge for the market growth in the coming years.
Global Dairy Blends Market Research Report (2023-2028) - Table of Contents
- Market Segmentation
- Introduction
- Product Definition
- Research Process
- Assumptions
- Executive Summary
- Global Dairy Blends Market Regulations and Policy
- Global Dairy Blends Market Trends & Developments
- Global Dairy Blends Market Supply Chain Analysis
- Global Dairy Blends Market Dynamics
- Drivers
- Challenges
- Global Dairy Blends Market Hotspot & Opportunities
- Global Dairy Blends Market Outlook, 2018-2028F
- Market Size & Analysis
- By Revenues (USD Million)
- Market Share & Analysis
- By Type
- Dairy Mixtures- Market Size & Forecast 2018-2028, (USD Million)
- Dairy/Nondairy Ingredients- Market Size & Forecast 2018-2028, (USD Million)
- Dairy as Functional Ingredient- Market Size & Forecast 2018-2028, (USD Million)
- Dairy as Carrier- Market Size & Forecast 2018-2028, (USD Million)
- Others- Market Size & Forecast 2018-2028, (USD Million)
- By Form
- Spreadable- Market Size & Forecast 2018-2028, (USD Million)
- Powder- Market Size & Forecast 2018-2028, (USD Million)
- Liquid - Market Size & Forecast 2018-2028, (USD Million)
- By Application
- Ice Creams - Market Size & Forecast 2018-2028, (USD Million)
- Yogurts- Market Size & Forecast 2018-2028, (USD Million)
- Infant Formula- Market Size & Forecast 2018-2028, (USD Million)
- Bakery- Market Size & Forecast 2018-2028, (USD Million)
- Feed- Market Size & Forecast 2018-2028, (USD Million)
- Butter & Cheese Spreadable Blends- Market Size & Forecast 2018-2028, (USD Million)
- Beverages- Market Size & Forecast 2018-2028, (USD Million)
- Others- Market Size & Forecast 2018-2028, (USD Million)
- By Region
- North America
- South America
- Europe
- The Middle East and Africa
- Asia-Pacific
- By Company
- Market Share
- Competition Characteristics
- By Type
- Market Size & Analysis
- North America Dairy Blends Market Outlook, 2018-2028F
- Market Size & Analysis
- By Revenues (USD Million)
- Market Share & Analysis
- By Type- Market Size & Forecast 2018-2028, (USD Million)
- By Application- Market Size & Forecast 2018-2028, (USD Million)
- By Form- Market Size & Forecast 2018-2028, (USD Million)
- By Country
- The US
- Canada
- Mexico
- The US Dairy Blends Market Outlook, 2018-2028F
- Market Size & Analysis
- By Revenues (USD Million)
- Market Share & Analysis
- By Type- Market Size & Forecast 2018-2028, (USD Million)
- By Application- Market Size & Forecast 2018-2028, (USD Million)
- By Form- Market Size & Forecast 2018-2028, (USD Million)
- Market Size & Analysis
- Canada Dairy Blends Market Outlook, 2018-2028F
- Market Size & Analysis
- By Revenues (USD Million)
- Market Share & Analysis
- By Type- Market Size & Forecast 2018-2028, (USD Million)
- By Application- Market Size & Forecast 2018-2028, (USD Million)
- By Form- Market Size & Forecast 2018-2028, (USD Million)
- Market Size & Analysis
- Mexico Dairy Blends Market Outlook, 2018-2028F
- Market Size & Analysis
- By Revenues (USD Million)
- Market Share & Analysis
- By Type- Market Size & Forecast 2018-2028, (USD Million)
- By Application- Market Size & Forecast 2018-2028, (USD Million)
- By Form- Market Size & Forecast 2018-2028, (USD Million)
- Market Size & Analysis
- Market Size & Analysis
- South America Dairy Blends Market Outlook, 2018-2028F
- Market Size & Analysis
- By Revenues (USD Million)
- Market Share & Analysis
- By Type- Market Size & Forecast 2018-2028, (USD Million)
- By Application- Market Size & Forecast 2018-2028, (USD Million)
- By Form- Market Size & Forecast 2018-2028, (USD Million)
- By Country
- Brazil
- Argentina
- Rest of South America
- Brazil Dairy Blends Market Outlook, 2018-2028F
- Market Size & Analysis
- By Revenues (USD Million)
- Market Share & Analysis
- By Type- Market Size & Forecast 2018-2028, (USD Million)
- By Application- Market Size & Forecast 2018-2028, (USD Million)
- By Form- Market Size & Forecast 2018-2028, (USD Million)
- Market Size & Analysis
- Argentina Dairy Blends Market Outlook, 2018-2028F
- Market Size & Analysis
- By Revenues (USD Million)
- Market Share & Analysis
- By Type- Market Size & Forecast 2018-2028, (USD Million)
- By Application- Market Size & Forecast 2018-2028, (USD Million)
- By Form- Market Size & Forecast 2018-2028, (USD Million)
- Market Size & Analysis
- Market Size & Analysis
- Europe Dairy Blends Market Outlook, 2018-2028F
- Market Size & Analysis
- By Revenues (USD Million)
- Market Share & Analysis
- By Type- Market Size & Forecast 2018-2028, (USD Million)
- By Application- Market Size & Forecast 2018-2028, (USD Million)
- By Form- Market Size & Forecast 2018-2028, (USD Million)
- By Country
- Germany
- The UK
- France
- Italy
- Spain
- Rest of Europe
- Germany Dairy Blends Market Outlook, 2018-2028F
- Market Size & Analysis
- By Revenues (USD Million)
- Market Share & Analysis
- By Type- Market Size & Forecast 2018-2028, (USD Million)
- By Application- Market Size & Forecast 2018-2028, (USD Million)
- By Form- Market Size & Forecast 2018-2028, (USD Million)
- Market Size & Analysis
- The UK Dairy Blends Market Outlook, 2018-2028F
- Market Size & Analysis
- By Revenues (USD Million)
- Market Share & Analysis
- By Type- Market Size & Forecast 2018-2028, (USD Million)
- By Application- Market Size & Forecast 2018-2028, (USD Million)
- By Form- Market Size & Forecast 2018-2028, (USD Million)
- Market Size & Analysis
- France Dairy Blends Market Outlook, 2018-2028F
- Market Size & Analysis
- By Revenues (USD Million)
- Market Share & Analysis
- By Type- Market Size & Forecast 2018-2028, (USD Million)
- By Application- Market Size & Forecast 2018-2028, (USD Million)
- By Form- Market Size & Forecast 2018-2028, (USD Million)
- Market Size & Analysis
- Italy Dairy Blends Market Outlook, 2018-2028F
- Market Size & Analysis
- By Revenues (USD Million)
- Market Share & Analysis
- By Type- Market Size & Forecast 2018-2028, (USD Million)
- By Application- Market Size & Forecast 2018-2028, (USD Million)
- By Form- Market Size & Forecast 2018-2028, (USD Million)
- Market Size & Analysis
- Spain Dairy Blends Market Outlook, 2018-2028F
- Market Size & Analysis
- By Revenues (USD Million)
- Market Share & Analysis
- By Type- Market Size & Forecast 2018-2028, (USD Million)
- By Application- Market Size & Forecast 2018-2028, (USD Million)
- By Form- Market Size & Forecast 2018-2028, (USD Million)
- Market Size & Analysis
- Market Size & Analysis
- The Middle East and Africa Dairy Blends Market Outlook, 2018-2028F
- Market Size & Analysis
- By Revenues (USD Million)
- Market Share & Analysis
- By Type- Market Size & Forecast 2018-2028, (USD Million)
- By Application- Market Size & Forecast 2018-2028, (USD Million)
- By Form- Market Size & Forecast 2018-2028, (USD Million)
- South Africa
- The UAE
- Saudi Arabia
- Rest of Middle East and Africa
- South Africa Dairy Blends Market Outlook, 2018-2028F
- Market Size & Analysis
- By Revenues (USD Million)
- Market Share & Analysis
- By Type- Market Size & Forecast 2018-2028, (USD Million)
- By Application- Market Size & Forecast 2018-2028, (USD Million)
- By Form- Market Size & Forecast 2018-2028, (USD Million)
- Market Size & Analysis
- The UAE Dairy Blends Market Outlook, 2018-2028F
- Market Size & Analysis
- By Revenues (USD Million)
- Market Share & Analysis
- By Type- Market Size & Forecast 2018-2028, (USD Million)
- By Application- Market Size & Forecast 2018-2028, (USD Million)
- By Form- Market Size & Forecast 2018-2028, (USD Million)
- Market Size & Analysis
- Saudi Arabia Dairy Blends Market Outlook, 2018-2028F
- Market Size & Analysis
- By Revenues (USD Million)
- Market Share & Analysis
- By Type- Market Size & Forecast 2018-2028, (USD Million)
- By Application- Market Size & Forecast 2018-2028, (USD Million)
- By Form- Market Size & Forecast 2018-2028, (USD Million)
- Market Size & Analysis
- Market Size & Analysis
- Asia-Pacific Dairy Blends Market Outlook, 2018-2028F
- Market Size & Analysis
- By Revenues (USD Million)
- Market Share & Analysis
- By Type- Market Size & Forecast 2018-2028, (USD Million)
- By Application- Market Size & Forecast 2018-2028, (USD Million)
- By Form- Market Size & Forecast 2018-2028, (USD Million)
- By Country
- China
- Japan
- Australia
- India
- South Korea
- Rest of Asia Pacific
- China Dairy Blends Market Outlook, 2018-2028F
- Market Size & Analysis
- By Revenues (USD Million)
- Market Share & Analysis
- By Type- Market Size & Forecast 2018-2028, (USD Million)
- By Application- Market Size & Forecast 2018-2028, (USD Million)
- By Form- Market Size & Forecast 2018-2028, (USD Million)
- Market Size & Analysis
- Japan Dairy Blends Market Outlook, 2018-2028F
- Market Size & Analysis
- By Revenues (USD Million)
- Market Share & Analysis
- By Type- Market Size & Forecast 2018-2028, (USD Million)
- By Application- Market Size & Forecast 2018-2028, (USD Million)
- By Form- Market Size & Forecast 2018-2028, (USD Million)
- Market Size & Analysis
- Australia Dairy Blends Market Outlook, 2018-2028F
- Market Size & Analysis
- By Revenues (USD Million)
- Market Share & Analysis
- By Type- Market Size & Forecast 2018-2028, (USD Million)
- By Application- Market Size & Forecast 2018-2028, (USD Million)
- By Form- Market Size & Forecast 2018-2028, (USD Million)
- Market Size & Analysis
- India Dairy Blends Market Outlook, 2018-2028F
- Market Size & Analysis
- By Revenues (USD Million)
- Market Share & Analysis
- By Type- Market Size & Forecast 2018-2028, (USD Million)
- By Application- Market Size & Forecast 2018-2028, (USD Million)
- By Form- Market Size & Forecast 2018-2028, (USD Million)
- Market Size & Analysis
- South Korea Dairy Blends Market Outlook, 2018-2028F
- Market Size & Analysis
- By Revenues (USD Million)
- Market Share & Analysis
- By Type- Market Size & Forecast 2018-2028, (USD Million)
- By Application- Market Size & Forecast 2018-2028, (USD Million)
- By Form- Market Size & Forecast 2018-2028, (USD Million)
- Market Size & Analysis
- Market Size & Analysis
- Competitive Outlook
- Company Profiles
- All American Foods Inc.
- Business Description
- Product Portfolio
- Strategic Alliances or Partnerships
- Recent Developments
- Financial Details
- Others
- Fonterra Co-operative Group Limited
- Business Description
- Product Portfolio
- Strategic Alliances or Partnerships
- Recent Developments
- Financial Details
- Others
- Kerry Group
- Business Description
- Product Portfolio
- Strategic Alliances or Partnerships
- Recent Developments
- Financial Details
- Others
- Agri-Mark Inc
- Business Description
- Product Portfolio
- Strategic Alliances or Partnerships
- Recent Developments
- Financial Details
- Others
- Royal Frieslandcampina N.V.
- Business Description
- Product Portfolio
- Strategic Alliances or Partnerships
- Recent Developments
- Financial Details
- Others
- Cargill Inc.
- Business Description
- Product Portfolio
- Strategic Alliances or Partnerships
- Recent Developments
- Financial Details
- Others
- Doehler Group
- Business Description
- Product Portfolio
- Strategic Alliances or Partnerships
- Recent Developments
- Financial Details
- Others
- Advanced Food products LLC
- Business Description
- Product Portfolio
- Strategic Alliances or Partnerships
- Recent Developments
- Financial Details
- Others
- Agropur Ingredients
- Business Description
- Product Portfolio
- Strategic Alliances or Partnerships
- Recent Developments
- Financial Details
- Others
- Intermix Australia Pty Ltd
- Business Description
- Product Portfolio
- Strategic Alliances or Partnerships
- Recent Developments
- Financial Details
- Others
- Abbott Nutrition
- Business Description
- Product Portfolio
- Strategic Alliances or Partnerships
- Recent Developments
- Financial Details
- Others
- Johnson & Johnson
- Business Description
- Product Portfolio
- Strategic Alliances or Partnerships
- Recent Developments
- Financial Details
- Others
- Cape Food Ingredients
- Business Description
- Product Portfolio
- Strategic Alliances or Partnerships
- Recent Developments
- Financial Details
- Others
- Galloway Company
- Business Description
- Product Portfolio
- Strategic Alliances or Partnerships
- Recent Developments
- Financial Details
- Others
- Others
- Business Description
- Product Portfolio
- Strategic Alliances or Partnerships
- Recent Developments
- Financial Details
- Others
- All American Foods Inc.
- Company Profiles
- Disclaimer
MarkNtel Advisors follows a robust and iterative research methodology designed to ensure maximum accuracy and minimize deviation in market estimates and forecasts. Our approach combines both bottom-up and top-down techniques to effectively segment and quantify various aspects of the market. A consistent feature across all our research reports is data triangulation, which examines the market from three distinct perspectives to validate findings. Key components of our research process include:
1. Scope & Research Design At the outset, MarkNtel Advisors define the research objectives and formulate pertinent questions. This phase involves determining the type of research—qualitative or quantitative—and designing a methodology that outlines data collection methods, target demographics, and analytical tools. They also establish timelines and budgets to ensure the research aligns with client goals.
2. Sample Selection and Data Collection In this stage, the firm identifies the target audience and determines the appropriate sample size to ensure representativeness. They employ various sampling methods, such as random or stratified sampling, based on the research objectives. Data collection is carried out using tools like surveys, interviews, and observations, ensuring the gathered data is reliable and relevant.
3. Data Analysis and Validation Once data is collected, MarkNtel Advisors undertake a rigorous analysis process. This includes cleaning the data to remove inconsistencies, employing statistical software for quantitative analysis, and thematic analysis for qualitative data. Validation steps are taken to ensure the accuracy and reliability of the findings, minimizing biases and errors.

4. Data Forecast and FinalizationThe final phase involves forecasting future market trends based on the analyzed data. MarkNtel Advisors utilize predictive modeling and time series analysis to anticipate market behaviors. The insights are then compiled into comprehensive reports, featuring visual aids like charts and graphs, and include strategic recommendations to inform client decision-making
FILL THE FORM TO GET THE FREE SAMPLE PAGES
We offer flexible licensing options to cater to varying organizational needs. Choose the pricing pack that best suits your requirements:
Buy Now