
Water Pumps in Power Industry - By Type (Centrifugal Pumps [Overhung Pumps, Split Case Pumps, Vertical Pumps, Submersible Pumps], Positive Displacement Pumps), By End-User (Thermal Power Plants, Hydro... ... Power Plants, Hydro Power Plants Solar Power Plants Geothermal Power Plants Wind Power Plants), By Region (North America South America Europe The Middle East & Africa Asia-Pacific) and Others Read more
- Environment
- Feb 2025
- 195
- PDF, Excel, PPT
Market Definition
Water pumps are mechanical devices used in the power industry to carry Power fluids, water, and other liquids by applying pressure to create flow.
Market Insights & Analysis: Global Water Pumps in Power Industry (2025-2030):
The Global Water Pumps in Power Industry size was valued at around USD 4.12 billion in 2024 and is projected to reach USD 4.52 billion by 2030. Along with this, the market is estimated to grow at a CAGR of around 1.9% during the forecast period, i.e., 2025-30. The rise in the global energy demand and increasing focus on the use of renewable energy are some major growth factors. Also, the global environmental regulations and technological advancements in the field are further pushing the market demand. To meet the rising energy needs in various countries, multiple investments are being made in the power generation capacity as well as infrastructure development. Globally, numerous power plants like; Lincoln Combustion Turbine Station (US), CPV West Virginia CCGT Plant (US), Gersteinwerk Combined Cycle Power Plant (Germany), Bramsche Gas Fired Power Plant (Germany), and others are being constructed that require efficient water pumping solutions for cooling, boiler feed, and water circulation.
| Report Coverage | Details |
|---|---|
| Historical Years | 2020–23 |
| Base Years | 2024 |
| Forecast Years | 2025–30 |
| Market Value in 2024 | USD 4.12 Billion |
| Market Value by 2030 | USD 4.52 Billion |
| CAGR (2025–30) | 1.9% |
| Leading Region | Asia-Pacific |
| Top Key Players | Grundfos, Sulzer Ltd., Xylem Inc., Flowserve Corporation, KSB SE & Co. KGaA, Weir Group, Wilo SE, Pentair PLC, ITT Inc., PSG Dover, Torishima Pump MFG. Co. LTD. and others are the top companies in the Global Water Pumps in Power Industry. |
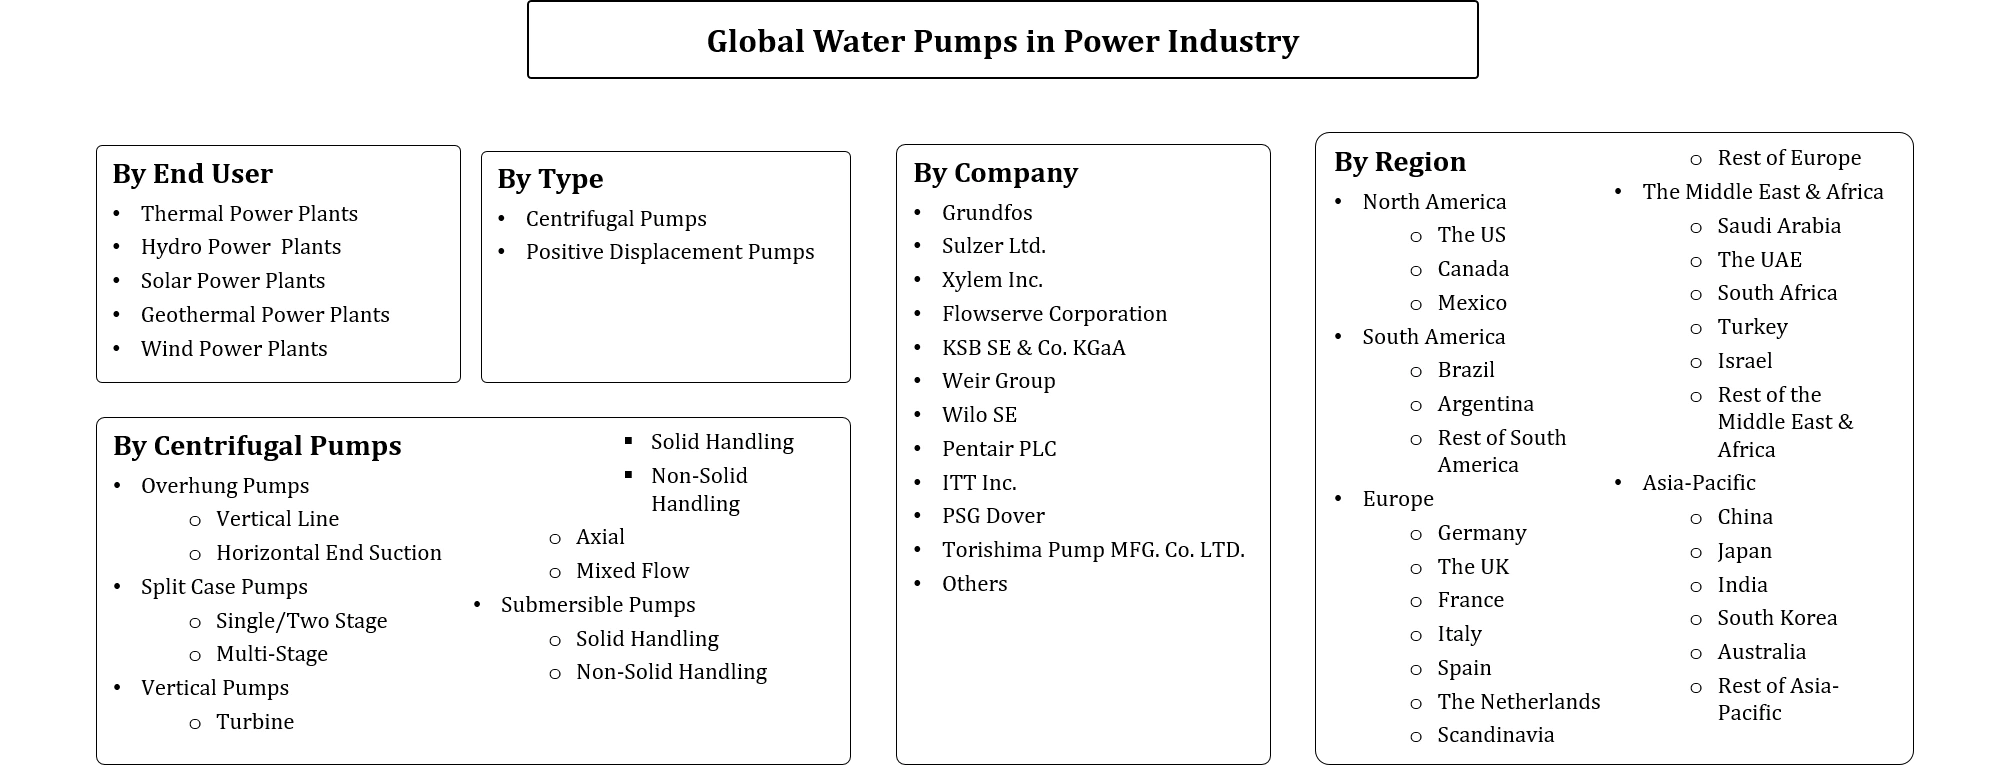
| Segmentation | By Type (Centrifugal Pumps [Overhung Pumps, Split Case Pumps, Vertical Pumps, Submersible Pumps], Positive Displacement Pumps), By End-User (Thermal Power Plants, Hydro Power Plants Solar Power Plants Geothermal Power Plants Wind Power Plants), By Region (North America South America Europe The Middle East & Africa Asia-Pacific) and Others |
| Key Report Highlights |
|
*Boost strategic growth with in-depth market analysis - Get a free sample preview today!
The focus on the use of renewable sources of power generation is growing at a rapid rate which requires the development of various energy production & management plants. These plants use water pumps for their cooling needs, boiler feed requirements, and others. The increasing use of renewable sources is bringing multiple investments. For instance, China invested around USD130 billion in the solar sector in 2023. From 2021-2023, investments in average annual clean energy in Japan and Korea have increased by around 40% and 10%, respectively as compared with the 2016-2020 average.
- Market Segmentation
- Introduction
- Product Definition
- Research Process
- Assumptions
- Executive Summary
- Global Water Pumps in Power Industry Trends & Developments
- Global Water Pumps in Power Industry Dynamics
- Growth Drivers
- Challenges
- Global Water Pumps in Power Industry Opportunities & Hotspots
- Global Water Pumps in Power Industry Value Chain Analysis
- Global Water Pumps in Power Industry Regulations and Policy
- Global Water Pumps in Power Industry Outlook, 2020-2030F
- Market Size & Analysis
- By Revenues (USD Million)
- Market Share & Analysis
- By Type
- Centrifugal Pumps –Market Size & Forecast 2020–2030F, USD Million
- Overhung Pumps- Market Size & Forecast 2020-2030F, USD Million
- Vertical Line- Market Size & Forecast 2020-2030F, USD Million
- Horizontal End Suction- Market Size & Forecast 2020-2030F, USD Million
- Split Case Pumps- Market Size & Forecast 2020-2030F, USD Million
- Single/Two Stage- Market Size & Forecast 2020-2030F, USD Million
- Multi Stage- Market Size & Forecast 2020-2030F, USD Million
- Vertical Pumps- Market Size & Forecast 2020-2030F, USD Million
- Turbine- Market Size & Forecast 2020-2030F, USD Million
- Solid Handling- Market Size & Forecast 2020-2030F, USD Million
- Non-Solid Handling- Market Size & Forecast 2020-2030F, USD Million
- Axial- Market Size & Forecast 2020-2030F, USD Million
- Mixed Flow- Market Size & Forecast 2020-2030F, USD Million
- Turbine- Market Size & Forecast 2020-2030F, USD Million
- Submersible Pumps- Market Size & Forecast 2020-2030F, USD Million
- Solid Handling- Market Size & Forecast 2020-2030F, USD Million
- Non-Solid Handling- Market Size & Forecast 2020-2030F, USD Million
- Overhung Pumps- Market Size & Forecast 2020-2030F, USD Million
- Centrifugal Pumps –Market Size & Forecast 2020–2030F, USD Million
- Positive Displacement Pumps – Market Size & Forecast 2020 – 2030F, USD Million
- By Type
- By End-User
- Thermal Power Plants- Market Size & Forecast 2020-2030, USD Million
- Hydro Power Plants-Market Size & Forecast 2020-2030, USD Million
- Solar Power Plants -Market Size & Forecast 2020-2030, USD Million
- Geothermal Power Plants-Market Size & Forecast 2020-2030, USD Million
- Wind Power Plants-Market Size & Forecast 2020-2030, USD Million
- By Region
- North America
- South America
- Europe
- The Middle East & Africa
- Asia-Pacific
- By Company
- Competition Characteristics
- Market Share and Analysis
- Market Size & Analysis
- North America Water Pumps in Power Industry Outlook, 2020-2030F
- Market Size & Analysis
- By Revenues (USD Million)
- Market Share & Analysis
- By Type- Market Size & Forecast 2020-2030, USD Million
- By End-User- Market Size & Forecast 2020-2030, USD Million
- By Country
- The US
- Canada
- Mexico
- The US Water Pumps in Power Industry Outlook, 2020-2030F
- Market Size & Analysis
- By Revenues (USD Million)
- Market Share & Analysis
- By Type- Market Size & Forecast 2020-2030, USD Million
- By End-User- Market Size & Forecast 2020-2030, USD Million
- Market Size & Analysis
- Canada Water Pumps in Power Industry Outlook, 2020-2030F
- Market Size & Analysis
- By Revenues (USD Million)
- Market Share & Analysis
- By Type- Market Size & Forecast 2020-2030, USD Million
- By End-User- Market Size & Forecast 2020-2030, USD Million
- Market Size & Analysis
- Mexico Water Pumps in Power Industry Outlook, 2020-2030F
- Market Size & Analysis
- By Revenues (USD Million)
- Market Share & Analysis
- By Type- Market Size & Forecast 2020-2030, USD Million
- By End-User- Market Size & Forecast 2020-2030, USD Million
- Market Size & Analysis
- Market Size & Analysis
- South America Water Pumps in Power Industry Outlook, 2020-2030F
- Market Size & Analysis
- By Revenues (USD Million)
- Market Share & Analysis
- By Type- Market Size & Forecast 2020-2030, USD Million
- By End-User- Market Size & Forecast 2020-2030, USD Million
- By Country
- Brazil
- Argentina
- Rest of South America
- Brazil Water Pumps in Power Industry Outlook, 2020-2030F
- Market Size & Analysis
- By Revenues (USD Million)
- Market Share & Analysis
- By Type- Market Size & Forecast 2020-2030, USD Million
- By End-User- Market Size & Forecast 2020-2030, USD Million
- Market Size & Analysis
- Argentina Water Pumps in Power Industry Outlook, 2020-2030F
- Market Size & Analysis
- By Revenues (USD Million)
- Market Share & Analysis
- By Type- Market Size & Forecast 2020-2030, USD Million
- By End-User- Market Size & Forecast 2020-2030, USD Million
- Market Size & Analysis
- Market Size & Analysis
- Europe Water Pumps in Power Industry Outlook, 2020-2030F
- Market Size & Analysis
- By Revenues (USD Million)
- Market Share & Analysis
- By Type- Market Size & Forecast 2020-2030, USD Million
- By End-User- Market Size & Forecast 2020-2030, USD Million
- By Country
- Germany
- The UK
- France
- Italy
- Spain
- The Netherlands
- Scandinavia
- Rest of Europe
- Germany Water Pumps in Power Industry Outlook, 2020-2030F
- Market Size & Analysis
- By Revenues (USD Million)
- Market Share & Analysis
- By Type- Market Size & Forecast 2020-2030, USD Million
- By End-User- Market Size & Forecast 2020-2030, USD Million
- Market Size & Analysis
- The UK Water Pumps in Power Industry Outlook, 2020-2030F
- Market Size & Analysis
- By Revenues (USD Million)
- Market Share & Analysis
- By Type- Market Size & Forecast 2020-2030, USD Million
- By End-User- Market Size & Forecast 2020-2030, USD Million
- Market Size & Analysis
- France Water Pumps in Power Industry Outlook, 2020-2030F
- Market Size & Analysis
- By Revenues (USD Million)
- Market Share & Analysis
- By Type- Market Size & Forecast 2020-2030, USD Million
- By End-User- Market Size & Forecast 2020-2030, USD Million
- Market Size & Analysis
- Italy Water Pumps in Power Industry Outlook, 2020-2030F
- Market Size & Analysis
- By Revenues (USD Million)
- Market Share & Analysis
- By Type- Market Size & Forecast 2020-2030, USD Million
- By End-User- Market Size & Forecast 2020-2030, USD Million
- Market Size & Analysis
- Spain Water Pumps in Power Industry Outlook, 2020-2030F
- Market Size & Analysis
- By Revenues (USD Million)
- Market Share & Analysis
- By Technology- Market Size & Forecast 2020-2030, USD Million
- By End-User- Market Size & Forecast 2020-2030, USD Million
- Market Size & Analysis
- The Netherlands Water Pumps in Power Industry Outlook, 2020-2030F
- Market Size & Analysis
- By Revenues (USD Million)
- Market Share & Analysis
- By Type- Market Size & Forecast 2020-2030, USD Million s
- By End-User- Market Size & Forecast 2020-2030, USD Million
- Market Size & Analysis
- Scandinavia Water Pumps in Power Industry Outlook, 2020-2030F
- Market Size & Analysis
- By Revenues (USD Million)
- Market Share & Analysis
- By Type- Market Size & Forecast 2020-2030, USD Million
- By End-User- Market Size & Forecast 2020-2030, USD Million
- Market Size & Analysis
- Market Size & Analysis
- The Middle East & Africa Water Pumps in Power Industry Outlook, 2020-2030F
- Market Size & Analysis
- By Revenues (USD Million)
- Market Share & Analysis
- By Type- Market Size & Forecast 2020-2030, USD Million
- By End-User- Market Size & Forecast 2020-2030, USD Million
- By Country
- Saudi Arabia
- UAE
- South Africa
- Turkey
- Israel
- Rest of Middle East & Africa
- Saudi Arabia Water Pumps in Power Industry Outlook, 2020-2030F
- Market Size & Analysis
- By Revenues (USD Million)
- Market Share & Analysis
- By Type- Market Size & Forecast 2020-2030, USD Million
- By End-User- Market Size & Forecast 2020-2030, USD Million
- Market Size & Analysis
- The UAE Water Pumps in Power Industry Outlook, 2020-2030F
- Market Size & Analysis
- By Revenues (USD Million)
- Market Share & Analysis
- By Type- Market Size & Forecast 2020-2030, USD Million
- By End-User- Market Size & Forecast 2020-2030, USD Million
- Market Size & Analysis
- South Africa Water Pumps in Power Industry Outlook, 2020-2030F
- Market Size & Analysis
- By Revenues (USD Million)
- Market Share & Analysis
- By Type- Market Size & Forecast 2020-2030, USD Million
- By End-User- Market Size & Forecast 2020-2030, USD Million
- Market Size & Analysis
- Turkey Water Pumps in Power Industry Outlook, 2020-2030F
- Market Size & Analysis
- By Revenues (USD Million)
- Market Share & Analysis
- By Type- Market Size & Forecast 2020-2030, USD Million
- By End-User- Market Size & Forecast 2020-2030, USD Million
- Market Size & Analysis
- Israel Water Pumps in Power Industry Outlook, 2020-2030F
- Market Size & Analysis
- By Revenues (USD Million)
- Market Share & Analysis
- By Type- Market Size & Forecast 2020-2030, USD Million
- By End-User- Market Size & Forecast 2020-2030, USD Million
- Market Size & Analysis
- Market Size & Analysis
- Asia-Pacific Water Pumps in Power Industry Outlook, 2020-2030F
- Market Size & Analysis
- By Revenues (USD Million)
- Market Share & Analysis
- By Type- Market Size & Forecast 2020-2030, USD Million
- By Application- Market Size & Forecast 2020-2030, USD Million
- By Country
- China
- Japan
- India
- South Korea
- Australia
- Rest of Asia-Pacific
- China Water Pumps in Power Industry Outlook, 2020-2030F
- Market Size & Analysis
- By Revenues (USD Million)
- Market Share & Analysis
- By Type- Market Size & Forecast 2020-2030, USD Million
- By End-User- Market Size & Forecast 2020-2030, USD Million
- Market Size & Analysis
- Japan Water Pumps in Power Industry Outlook, 2020-2030F
- Market Size & Analysis
- By Revenues (USD Million)
- Market Share & Analysis
- By Type- Market Size & Forecast 2020-2030, USD Million
- By End-User- Market Size & Forecast 2020-2030, USD Million
- Market Size & Analysis
- India Water Pumps in Power Industry Outlook, 2020-2030F
- Market Size & Analysis
- By Revenues (USD Million)
- Market Share & Analysis
- By Type- Market Size & Forecast 2020-2030, USD Million
- By End-User- Market Size & Forecast 2020-2030, USD Million
- Market Size & Analysis
- South Korea Water Pumps in Power Industry Outlook, 2020-2030F
- Market Size & Analysis
- By Revenues (USD Million)
- Market Share & Analysis
- By Type- Market Size & Forecast 2020-2030, USD Million
- By End-User- Market Size & Forecast 2020-2030, USD Million
- Market Size & Analysis
- Australia Water Pumps in Power Industry Outlook, 2020-2030F
- Market Size & Analysis
- By Revenues (USD Million)
- Market Share & Analysis
- By Type- Market Size & Forecast 2020-2030, USD Million
- By End-User- Market Size & Forecast 2020-2030, USD Million
- Market Size & Analysis
- Market Size & Analysis
- Global Water Pumps in Power Industry Strategic Imperatives for Growth & Success
- Competition Outlook
- Company Profiles
- Grundfos
- Business Description
- Product Portfolio
- Strategic Alliances or Partnerships
- Recent Developments
- Financial Details
- Others
- Sulzer Ltd.
- Business Description
- Product Portfolio
- Strategic Alliances or Partnerships
- Recent Developments
- Financial Details
- Others
- Xylem Inc.
- Business Description
- Product Portfolio
- Strategic Alliances or Partnerships
- Recent Developments
- Financial Details
- Others
- Flowserve Corporation
- Business Description
- Product Portfolio
- Strategic Alliances or Partnerships
- Recent Developments
- Financial Details
- Others
- KSB SE & Co. KGaA
- Business Description
- Product Portfolio
- Strategic Alliances or Partnerships
- Recent Developments
- Financial Details
- Others
- Weir Group
- Business Description
- Product Portfolio
- Strategic Alliances or Partnerships
- Recent Developments
- Financial Details
- Others
- Wilo SE
- Business Description
- Product Portfolio
- Strategic Alliances or Partnerships
- Recent Developments
- Financial Details
- Others
- Pentair PLC
- Business Description
- Product Portfolio
- Strategic Alliances or Partnerships
- Recent Developments
- Financial Details
- Others
- ITT Inc.
- Business Description
- Product Portfolio
- Strategic Alliances or Partnerships
- Recent Developments
- Financial Details
- Others
- Torishima Pump MFG. Co. LTD.
- Business Description
- Product Portfolio
- Strategic Alliances or Partnerships
- Recent Developments
- Financial Details
- Others
- PSG Dover
- Business Description
- Product Portfolio
- Strategic Alliances or Partnerships
- Recent Developments
- Financial Details
- Others
- Others
- Grundfos
- Company Profiles
- Disclaimer
MarkNtel Advisors follows a robust and iterative research methodology designed to ensure maximum accuracy and minimize deviation in market estimates and forecasts. Our approach combines both bottom-up and top-down techniques to effectively segment and quantify various aspects of the market. A consistent feature across all our research reports is data triangulation, which examines the market from three distinct perspectives to validate findings. Key components of our research process include:
1. Scope & Research Design At the outset, MarkNtel Advisors define the research objectives and formulate pertinent questions. This phase involves determining the type of research—qualitative or quantitative—and designing a methodology that outlines data collection methods, target demographics, and analytical tools. They also establish timelines and budgets to ensure the research aligns with client goals.
2. Sample Selection and Data Collection In this stage, the firm identifies the target audience and determines the appropriate sample size to ensure representativeness. They employ various sampling methods, such as random or stratified sampling, based on the research objectives. Data collection is carried out using tools like surveys, interviews, and observations, ensuring the gathered data is reliable and relevant.
3. Data Analysis and Validation Once data is collected, MarkNtel Advisors undertake a rigorous analysis process. This includes cleaning the data to remove inconsistencies, employing statistical software for quantitative analysis, and thematic analysis for qualitative data. Validation steps are taken to ensure the accuracy and reliability of the findings, minimizing biases and errors.

4. Data Forecast and FinalizationThe final phase involves forecasting future market trends based on the analyzed data. MarkNtel Advisors utilize predictive modeling and time series analysis to anticipate market behaviors. The insights are then compiled into comprehensive reports, featuring visual aids like charts and graphs, and include strategic recommendations to inform client decision-making
We’d love to understand what matters most to you.