

By Fuel type (Pellet RDF, Fluff / Shredded RDF, Briquette RDF, Powder RDF), By Calorific Value (Grade) (High Calorific Value, Medium Calorific Value, Low Calorific Value), By Feeds......tock Source (Municipal Solid Waste (MSW), Industrial Waste, Commercial Waste), By Application (Cement Manufacturing, Power Generation, Industrial Boilers, District Heating, Steel & Metals, Chemical Industry, Others), and others Read more
- Environment
- Jul 2026
- 450
- PDF, Excel, PPT
Refuse-Derived Fuel Market Key Takeaways
- The Global Refuse Derived Fuel market was valued at USD 8.24 billion in 2025 to USD 10.26 billion and is projected to reach USD 16.27 billion by 2032.
- The industry is projected to witness steady growth at a CAGR of 7.99% during the forecast period.
- Europe dominates the market with approximately 52% share in 2026.
- Cement manufacturing accounts for approximately 52% of global RDF consumption.
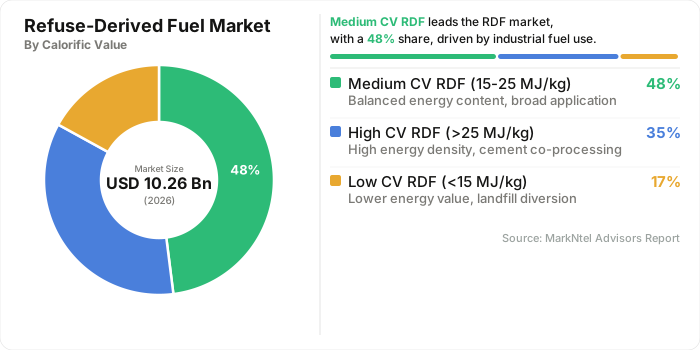
- Medium calorific value commands approximately 48% of total market volume.
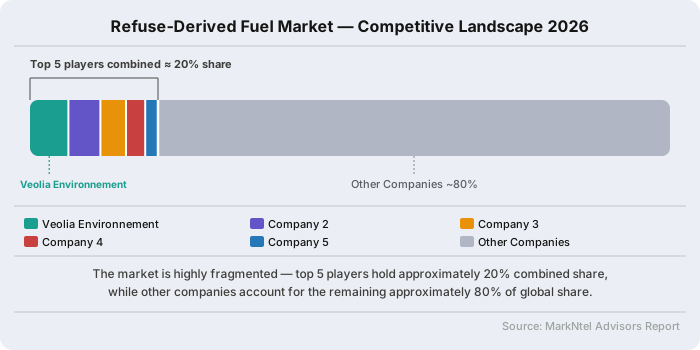
- The market is highly fragmented, with the top 5 players collectively accounting for approximately 20% of total market share.
Refuse-Derived Fuel Market Size and Outlook
The refuse-derived fuel market was valued at USD 8.24 billion in 2025 to 10.26 billion in 2026 and is projected to reach USD 16.27 billion by 2032, expanding at a CAGR of 7.99% during 2026-32.
This growth is anchored in the accelerating global transition toward energy recovery from waste as a mainstream industrial fuel strategy. Surging generation of municipal solid waste: the EU alone generated approximately 232.4 million tonnes of municipal waste in 2024, per Eurostat data, creating the feedstock volumes necessary to sustain large-scale processed waste fuel production.
Simultaneously, tightening disposal regulations are compressing landfill capacity: the EU Landfill Directive (EU) 2018/850 mandates that the share of municipal waste landfilled be reduced to 10% by 2035, forcing municipalities and industrial operators toward alternative fuel from waste as a compliance-aligned energy pathway. These structural pressures collectively underpin the market's strong expansion trajectory. Industrial demand for waste-derived fuel is deepest in the cement sector, where RDF and solid recovered fuel (SRF) directly displace coal and petroleum coke in high-temperature kiln operations.
European cement plants have replaced large portions of traditional fuel with biomass or waste, with some facilities achieving alternative fuel substitution rates of up to 80%, as documented by CEMBUREAU. Meanwhile, CEMBUREAU has set a target to reach 60% alternative fuels, inclusive of 30% biomass across European cement production by 2030, establishing a long runway for refuse-based combustible fuel demand within the region's most energy-intensive manufacturing sector.
Beyond Europe, government-led waste management frameworks are expanding the waste-to-energy fuel supply chain across Asia. China's 14th Five-Year Plan targeted an urban household waste incineration capacity of approximately 800,000 metric tonnes per day by end-2025, and the country has surpassed that target ahead of schedule, according to E20 Institute reporting.
In India, the Ministry of New and Renewable Energy's National Bioenergy Programme (FY 2021–22 to 2025–26) supports the development of waste-to-energy projects generating power, biogas, and syngas from urban, industrial, and agricultural waste streams, while India's Ministry of Environment, Forest and Climate Change notified revised Solid Waste Management Rules in January 2026, signaling a regulatory push that will further deepen feedstock availability for non-recyclable waste fuel processing. Together, these demand signals from cement kilns, power generation, and steel manufacturing, combined with expanding circular economy waste solutions, position the market for sustained double-digit growth through the forecast period.
Key Indicators
- According to the United Nations Environment Programme (UNEP) Global Waste Management Outlook 2024, global municipal solid waste generation is projected to rise from 2.1 billion tonnes in 2023 to 3.8 billion tonnes by 2050. This near-doubling of feedstock volumes at the source level directly expands the raw material base available for refuse-derived fuel (RDF) production, widening the addressable market for RDF processing systems across all geographies.
- According to the IEA's Coal 2025 report, global coal demand reached 8,805 Mt in 2024 — a 1.5% year-on-year increase with China and India together accounting for 71% of consumption. The scale of fossil fuel reliance in energy-intensive industries intensifies demand for alternative solid fuel substitution, positioning RDF as a commercially viable and lower-emission coal replacement in cement kilns and industrial combustion systems.
- Eurostat's 2024 data confirms that approximately 59.2 million tonnes of municipal waste were treated through R1 energy recovery operations in the EU, representing 26.8% of total treated waste; persistent growth in the energy recovery share validates the structural shift toward waste-to-energy fuel pathways, and signals continued capital deployment in mechanical biological treatment (MBT) and advanced waste separation technology across Europe.
Refuse-Derived Fuel Market Scope
| Category | Segments |
|---|---|
| By Fuel type | Pellet RDF, Fluff / Shredded RDF, Briquette RDF, Powder RDF |
| By Calorific Value | High Calorific Value, Medium Calorific Value, Low Calorific Value |
| By Feedstock Source | Municipal Solid Waste (MSW), Industrial Waste, Commercial Waste |
| By Application | Cement Manufacturing, Power Generation, Industrial Boilers, District Heating, Steel & Metals, Chemical Industry, Others |
Refuse-Derived Fuel Market Growth Drivers
Circular Economy & Waste-to-Energy Initiatives Accelerating Demand for Refuse Derived Fuel
The global shift toward circular economy waste solutions is fundamentally restructuring how non-recyclable fractions of urban waste are valued and processed. Governments are moving beyond voluntary sustainability commitments to binding circularity legislation that treats waste-to-energy (WTE) sector integration as a compliance mechanism, not an optional pathway.
The EU's circular material use rate stood at just 12.2% in 2024 against a binding Clean Industrial Deal target of 24% by 2030, a near-doubling required within six years, according to the European Parliament. Closing this gap requires channeling the non-recyclable fraction of industrial and municipal waste streams into productive use, making solid recovered fuel (SRF) and RDF production the most commercially scalable pathways available to heavy industry.
The European Commission launched its formal public consultation on the forthcoming Circular Economy Act in August 2025, with the legislative proposal scheduled for adoption in Q3 2026, signaling that sustainable waste management systems will be subject to increasingly prescriptive industrial obligations across all 27 Member States. As carbon neutrality commitments tighten across corporate and sovereign balance sheets, converting combustible waste fuel into a certified alternative solid fuel offers industries a simultaneous compliance solution for both waste diversion and industrial decarbonization initiatives, positioning energy recovery from waste as a structural component of long-term energy procurement strategies.
Recent Trends
AI-Based Waste Sorting and Advanced Processing Technologies Elevating RDF Quality
The most consequential directional shift underway in the global RDF production landscape is the transition from manual and mechanical pre-processing toward integrated AI-based waste sorting for RDF production, driven by the need to deliver consistent calorific value and low-moisture output that industrial end-users, particularly cement kilns and thermal power plants, increasingly demand as a precondition for long-term offtake contracts. This shift is measurable and accelerating: technologies used in RDF waste processing plants are moving toward multi-stage automated systems combining computer vision sorting, magnetic separation, bio-drying, and precision pelletizing into single-line configurations that substantially reduce human intervention and output variability.
In 2025, GEP ECOTECH delivered a complete RDF processing system to Zhongyuan Environmental Protection (CPEP), China's largest waste treatment enterprise, incorporating integrated shredding, separation, and refinement processing of fashion waste, industrial residues, and textile offcuts into high-quality waste-based fuel pellets supplied directly to a state-owned cement plant as a coal substitute.
In early 2026, AMP Robotics commissioned its AI-powered AMP ONE™ sortation facility with Waste Connections in Commerce City, Colorado, capable of processing up to 62,000 tons of single-stream recycling annually through AMP Smart Sortation™, enabling production of custom feedstock blends with material purity levels previously unachievable through conventional mechanical biological treatment (MBT) systems.
As regulatory quality thresholds for processed waste fuel tighten across Europe and Asia through 2030, operators unable to meet calorific value and chlorine content specifications will be displaced by facilities deploying these next-generation waste fuel conversion technologies.
Refuse-Derived Fuel Market Opportunities and Challenges
Inconsistent Feedstock Quality and Absence of Global Regulatory Standards Creating Investment Opportunities in Advanced RDF Processing Infrastructure
Poor waste segregation at the source remains one of the most significant structural constraints limiting the growth of the global refuse-derived fuel market, particularly across developing economies. Mixed municipal waste streams result in inconsistent feedstock quality, requiring RDF producers to undertake extensive sorting, drying, and pre-treatment before the material can be converted into commercially acceptable fuel.
These additional processing requirements increase production costs, reduce operational efficiency, and often lead to fuel quality that fails to meet the specifications of industrial end users such as cement manufacturers and power producers. Furthermore, inadequate waste collection infrastructure and fragmented logistics limit the volume and consistency of feedstock available to RDF processing facilities, making it difficult for operators to secure long-term industrial supply contracts and comply with increasingly stringent environmental regulations.
At the same time, these infrastructure shortcomings are creating substantial opportunities for governments, waste management companies, and technology providers to invest in advanced waste processing and waste-to-energy infrastructure. Projects integrating high-quality RDF production with carbon capture and renewable fuel technologies are improving the commercial viability of waste-derived fuels while supporting industrial decarbonization goals.
In January 2025, Hafslund Celsio, Norway's largest waste-to-energy plant operator, awarded an EPCIC contract to SLB Capturi and Aker Solutions to deploy a full-scale carbon capture system at its Klemetsrud waste-to-energy facility in Oslo. The plant processes approximately 350,000 tonnes of waste annually and forms part of Norway's Longship Carbon Capture and Storage (CCS) programme. The project demonstrates how integrating carbon capture with waste-to-energy operations can enhance the long-term sustainability and economic attractiveness of facilities utilizing non-recyclable waste as fuel.
Similarly, in February 2025, Repsol approved an investment exceeding USD 920 million to develop the Ecoplanta facility in Tarragona, Spain. Scheduled for commissioning in 2029, the project will become Europe's first commercial-scale plant to convert municipal solid waste into renewable and circular methanol through gasification. The facility is designed to process 400,000 tonnes of municipal solid waste annually and produce approximately 240,000 tonnes of renewable fuels and circular products each year, supported by USD 122 million from the EU Innovation Fund. Such investments highlight the growing commercial potential of advanced waste conversion technologies and reinforce the long-term growth prospects of the global refuse-derived fuel market.
Segmentation Insights
Medium-Calorific RDF Emerges as the Preferred Fuel Grade Across Industrial Applications
Medium calorific value commands approximately 48% of total market volume because it precisely satisfies the thermal input thresholds of both secondary and primary firing positions in cement precalciners, the single largest end-use configuration for refuse derived fuel globally without requiring the costly pre-processing upgrades demanded by high-grade solid recovered fuel. This grade's technical versatility eliminates feedstock rejection risk for processors, enabling reliable long-term industrial offtake contracts across the broadest buyer base of any classification.
Company specific instances contribute more in its leadership. For example, In November 2025, Holcim Philippines signed a memorandum of agreement with Prime Waste Solutions Pampanga a facility capable of handling up to 5,000 metric tonnes per day to supply a steady volume of RDF to its Bulacan and La Union cement plants as a direct coal substitute, signaling that medium calorific value output is increasingly embedded within structured, long-term industrial supply chains across Asia.
As decarbonization mandates tighten and carbon pricing escalates across Europe and Asia through 2030, the commercial premium on consistent medium-grade processed waste fuel output will intensify, cementing this grade's structural dominance through the forecast period. By calorific value (Grade), the market is further segmented into the following sub-categories:
- Medium Calorific Value
- High Calorific Value
- Low Calorific Value
High Thermal Energy Demand Keeps Cement Manufacturing at the Forefront with 52% Market Share
Cement manufacturing holds approximately 52% of the global refuse derived fuel (RDF) market, making it the largest application segment due to the industry's high and continuous thermal energy requirements. Cement kilns operate at temperatures exceeding 1,450°C, enabling the complete combustion of RDF while incorporating its mineral ash into clinker production, thereby eliminating additional waste disposal requirements.
Rising fossil fuel prices, stringent carbon emission regulations, and increasing landfill diversion policies have encouraged cement producers to replace coal and petcoke with RDF to reduce operating costs and achieve sustainability targets. The growing emphasis on circular economy practices has further strengthened RDF adoption across cement plants worldwide.
Recent investments further highlight this trend. In 2024, Holcim US invested USD 11 million to expand alternative thermal energy capacity at its Hagerstown cement plant, increasing engineered fuel usage to 58,000 tonnes annually and raising alternative fuel utilization [ss1] to 45%. In 2025, Holcim Colombia and Geocycle invested USD 2 million to modernize their Nobsa co-processing facility, enabling the processing of over 100,000 tonnes of waste annually and targeting an increase in TSR from 40% to over 70% by [ss2] 2030. Similarly, Heidelberg Materials expanded RDF supply systems at its Mason City (USA) and Pukrang (Thailand) cement plants during 2025 to increase alternative fuel consumption and reduce fossil fuel dependency. [ss3]
These investments are reducing operating costs, diverting significant volumes of municipal and industrial waste from landfills, and helping cement manufacturers achieve their decarbonization goals. Consequently, cement manufacturing is expected to remain the dominant application for RDF throughout the forecast period as global investments in alternative fuel infrastructure continue to accelerate. By application segment, the market is further subdivided into the following sub-categories:
- Cement Manufacturing
- Power Generation
- Industrial Boilers
- District Heating
- Steel & Metals
- Chemical Industry
- Others
Refuse- Derived Fuel Market Geographical Analysis
Europe accounts for approximately 52% of the global refuse-derived fuel (RDF) market, supported by a combination of structural advantages that distinguish it from other regions. These include stringent landfill diversion regulations, a well-established cross-border RDF trade network, and the world's highest concentration of cement kilns and district heating facilities capable of utilizing waste-derived fuels through co-processing and waste-to-energy systems. Together, these factors have created a mature and highly integrated RDF ecosystem that continues to drive regional market leadership.

Germany, the United Kingdom, Sweden, and the Netherlands remain the primary contributors to this dominance through strong waste management infrastructure and extensive utilization of RDF across industrial and energy applications. According to England's Environment Agency, England exported 1.71 million tonnes of refuse-derived fuel (RDF) and solid recovered fuel (SRF) to mainland Europe in 2024, representing an 8% year-on-year increase. Sweden alone imported approximately 906,000 tonnes, the highest volume received by any single country, highlighting the strength and maturity of Europe's cross-border RDF supply chain. The sustained growth in these trade flows demonstrates that regional RDF markets are supported by long-term infrastructure and policy frameworks rather than short-term market fluctuations.
Europe is also witnessing continued investment in waste-to-energy infrastructure that further strengthens RDF demand. In March 2026, Veolia announced Phase II of its Karviná district heating transformation project in the Czech Republic, replacing four coal-fired boilers with a multi-fuel boiler capable of operating on locally sourced RDF and biomass. The project aims to eliminate coal use by 2029 while supplying heat to approximately 50,000 households, illustrating the expanding role of RDF in decarbonizing district heating systems across Central and Eastern Europe.
Looking ahead, the anticipated implementation of the EU Circular Economy Act is expected to further increase the diversion of non-recyclable waste from landfills into RDF processing facilities. As regulatory requirements continue to promote resource recovery and reduce landfill dependency, the availability of RDF feedstock and its adoption across industrial and energy applications are expected to strengthen, reinforcing Europe's leadership in the global refuse-derived fuel market throughout the forecast period.
Refuse-Derived Fuel Market Competitive Landscape
The global refuse-derived fuel market is highly fragmented, with the presence of numerous regional waste management companies, recycling firms, RDF producers, waste-to-energy operators, and cement industry fuel suppliers. The top five companies Veolia Environnement S.A., SUEZ S.A., Remondis SE & Co. KG, Biffa plc, and FCC Environment (UK) Limited- collectively account for approximately 20% of the global RDF market share.
Major Players in the Refuse-Derived Fuel Industry Globally
- Veolia Environnement S.A.
- SUEZ S.A.
- STADLER Anlagenbau GmbH
- Remondis SE & Co. KG
- Biffa plc
- FCC Environment (UK) Limited
- Indaver NV
- ALBA Group plc & Co. KG
- Geminor AS
- Andusia Recovered Fuels Limited
- N&P Alternative Fuels B.V.
- Renewi plc
- Geocycle (Holcim Group)
- PreZero International GmbH
- Viridor Limited
Refuse-Derived Fuel Market News and Recent Developments
2024: Heidelberg Materials North America Commissions Alternative Fuel Infrastructure at Edmonton Cement Plant with Government Co-Investment
Heidelberg Materials North America announced in November 2024 the commissioning of new equipment and infrastructure at its Edmonton cement plant in Alberta, Canada, enabling the replacement of up to 50% of fossil fuels with low-carbon alternative fuels (ALCF) sourced from municipal, construction, and demolition waste. The project received a $2.4 million investment from the Government of Alberta's Technology Innovation and Emissions Reduction fund through Emissions Reduction Alberta (ERA), with the alternative fuels sourced from local waste managers, including the City of Edmonton's Refuse Derived Fuel plant, which processes only non-hazardous wastes into high-quality alternative fuels used as consistent feedstock for the Heidelberg Materials kiln system. The plant now diverts approximately 100 kilotons of non-hazardous waste annually from landfill as a direct result of this infrastructure upgrade.
Impact analysis: This public-private co-investment model combining cement plant capital expenditure with government emissions reduction funding directly increases the volume of processed waste fuel consumed in North American industrial kilns and validates the commercial viability of municipal RDF feedstock supply chains in markets where thermal substitution rates have historically remained below 20%. As similar funding frameworks proliferate across Canadian provinces and US states, demand for consistent alternative fuel from waste in the cement sector will structurally deepen through the forecast period.
2025: Raysut Cement Group, Be'ah & MVW Lechtenberg & Partner Sign Memorandum of Cooperation to Produce RDF in Oman
Oman Environmental Services Holding Company (Be'ah) signed a memorandum of cooperation with Raysut Cement Company and Germany's MVW Lechtenberg & Partner to explore the feasibility of producing refuse-derived fuel in Oman's Dhofar region. The planned facility in Salalah will process approximately 800 tonnes of household waste daily, sorting recyclable materials for recovery while converting non-recyclable fractions into substitute fuels for the Raysut cement plant and composting organic waste into high-quality substrate. The agreement was signed under the patronage of Dr Mansoor Talib Al Hinai, Chairman of the Authority for Public Services Regulation, with Raysut Cement CEO Hilal bin Saif Al Dhamri confirming the initiative's role in advancing Oman's carbon neutrality goals and the circular economy waste solutions agenda across the Gulf's cement sector.
Impact analysis: This three-party public-private collaboration combining a state waste entity, a cement producer, and an international alternative fuels consultancy establishes a replicable model for waste-to-energy fuel infrastructure development in Gulf Cooperation Council markets where landfill dependence remains high, and cement kilns represent the most accessible industrial off-takers for non-recyclable waste fuel output. As similar frameworks expand across Saudi Arabia and the UAE, demand for technical expertise in RDF processing system design will intensify across the Middle East through the forecast period.
2025: Cuttack Municipal Corporation Launches Plastic-Waste-to-RDF Initiative for Cement Manufacturing in Odisha
In April 2025, the Cuttack Municipal Corporation launched a programme to convert segregated municipal plastic waste, including multi-layered packaging and non-recyclable carry bags, collected through its door-to-door system into refuse derived fuel for supply to a partnering cement manufacturer as a direct coal substitute in kiln co-processing operations. The initiative operationalises India's Solid Waste Management Rules mandate requiring cement plants within 100 kilometres of municipal waste sources to incorporate non-recyclable waste fuel in their thermal energy mix, creating a compliance-driven offtake model for CMC's processed waste fuel output.
Impact Analysis: This initiative establishes a replicable municipal-to-industrial RDF fuel production model for Odisha's Tier 2 cities. As India's SWM Rules 2026 raise mandatory cement plant substitution targets to 15%, similar agreements will proliferate across eastern India, deepening structural demand for waste-derived energy fuel co-processing infrastructure through the forecast period.
- Market Segmentation
- Introduction
- Product Definition
- Research Process
- Assumptions
- Executive Summary
- Refuse-Derived Fuel Market Policies, Regulations, and Product Standards
- Refuse-Derived Fuel Market Trends & Developments
- Refuse-Derived Fuel Market Dynamics
- Growth Factors
- Challenges
- Refuse-Derived Fuel Market Hotspot & Opportunities
- Refuse-Derived Fuel Market Outlook, 2022-2032
- Market Size & Outlook
- By Revenues (USD Million)
- Market Share & Outlook
- By Fuel type- Market Size & Forecast 2022-2032, USD Million
- Pellet RDF
- Fluff / Shredded RDF
- Briquette RDF
- Powder RDF
- By Calorific Value (Grade)- Market Size & Forecast 2022-2032, USD Million
- High Calorific Value
- Medium Calorific Value
- Low Calorific Value
- By Feedstock Source- Market Size & Forecast 2022-2032, USD Million
- Municipal Solid Waste (MSW)
- Industrial Waste
- Commercial Waste
- By Application- Market Size & Forecast 2022-2032, USD Million
- Cement Manufacturing
- Power Generation
- Industrial Boilers
- District Heating
- Steel & Metals
- Chemical Industry
- Others
- By Region
- North America
- Europe
- Asia-Pacific
- Latin America
- Middle East & Africa
- By Company
- Competition Characteristics
- Market Share & Analysis
- By Fuel type- Market Size & Forecast 2022-2032, USD Million
- Market Size & Outlook
- North America Refuse-Derived Fuel Market Outlook, 2022-2032
- Market Size & Outlook
- By Revenues (USD Million)
- Market Segmentation & Outlook
- By Fuel - Market Size & Forecast 2022-2032, USD Million
- By Calorific Value (Grade)- Market Size & Forecast 2022-2032, USD Million
- By Feedstock Source- Market Size & Forecast 2022-2032, USD Million
- By Application- Market Size & Forecast 2022-2032, USD Million
- By Country
- The US
- Canada
- Mexico
- The US Refuse-Derived Fuel Market Outlook, 2022-2032
- Market Size & Outlook
- By Revenues (USD Million)
- Market Segmentation & Outlook
- By Fuel - Market Size & Forecast 2022-2032, USD Million
- By Calorific Value (Grade)- Market Size & Forecast 2022-2032, USD Million
- By Feedstock Source- Market Size & Forecast 2022-2032, USD Million
- By Application- Market Size & Forecast 2022-2032, USD Million
- Market Size & Outlook
- Canada Refuse-Derived Fuel Market Outlook, 2022-2032
- Market Size & Outlook
- By Revenues (USD Million)
- Market Segmentation & Outlook
- By Fuel - Market Size & Forecast 2022-2032, USD Million
- By Calorific Value (Grade)- Market Size & Forecast 2022-2032, USD Million
- By Feedstock Source- Market Size & Forecast 2022-2032, USD Million
- By Application- Market Size & Forecast 2022-2032, USD Million
- Market Size & Outlook
- Mexico Refuse-Derived Fuel Market Outlook, 2022-2032
- Market Size & Outlook
- By Revenues (USD Million)
- Market Segmentation & Outlook
- By Fuel - Market Size & Forecast 2022-2032, USD Million
- By Calorific Value (Grade)- Market Size & Forecast 2022-2032, USD Million
- By Feedstock Source- Market Size & Forecast 2022-2032, USD Million
- By Application- Market Size & Forecast 2022-2032, USD Million
- Market Size & Outlook
- Market Size & Outlook
- South America Refuse-Derived Fuel Market Outlook, 2022-2032
- Market Size & Outlook
- By Revenues (USD Million)
- Market Segmentation & Outlook
- By Fuel - Market Size & Forecast 2022-2032, USD Million
- By Calorific Value (Grade)- Market Size & Forecast 2022-2032, USD Million
- By Feedstock Source- Market Size & Forecast 2022-2032, USD Million
- By Application- Market Size & Forecast 2022-2032, USD Million
- By Country
- Brazil
- Argentina
- Chile
- Colombia
- Ecuador
- Rest of South America
- Brazil Refuse-Derived Fuel Market Outlook, 2022-2032
- Market Size & Outlook
- By Revenues (USD Million)
- Market Segmentation & Outlook
- By Fuel - Market Size & Forecast 2022-2032, USD Million
- By Calorific Value (Grade)- Market Size & Forecast 2022-2032, USD Million
- By Feedstock Source- Market Size & Forecast 2022-2032, USD Million
- By Application- Market Size & Forecast 2022-2032, USD Million
- Market Size & Outlook
- Argentina Refuse-Derived Fuel Market Outlook, 2022-2032
- Market Size & Outlook
- By Revenues (USD Million)
- Market Segmentation & Outlook
- By Fuel - Market Size & Forecast 2022-2032, USD Million
- By Calorific Value (Grade)- Market Size & Forecast 2022-2032, USD Million
- By Feedstock Source- Market Size & Forecast 2022-2032, USD Million
- By Application- Market Size & Forecast 2022-2032, USD Million
- Market Size & Outlook
- Chile Refuse-Derived Fuel Market Outlook, 2022-2032
- Market Size & Outlook
- By Revenues (USD Million)
- Market Segmentation & Outlook
- By Fuel - Market Size & Forecast 2022-2032, USD Million
- By Calorific Value (Grade)- Market Size & Forecast 2022-2032, USD Million
- By Feedstock Source- Market Size & Forecast 2022-2032, USD Million
- By Application- Market Size & Forecast 2022-2032, USD Million
- Market Size & Outlook
- Colombia Refuse-Derived Fuel Market Outlook, 2022-2032
- Market Size & Outlook
- By Revenues (USD Million)
- Market Segmentation & Outlook
- By Fuel - Market Size & Forecast 2022-2032, USD Million
- By Calorific Value (Grade)- Market Size & Forecast 2022-2032, USD Million
- By Feedstock Source- Market Size & Forecast 2022-2032, USD Million
- By Application- Market Size & Forecast 2022-2032, USD Million
- Market Size & Outlook
- Ecuador Refuse-Derived Fuel Market Outlook, 2022-2032
- Market Size & Outlook
- By Revenues (USD Million)
- Market Segmentation & Outlook
- By Fuel - Market Size & Forecast 2022-2032, USD Million
- By Calorific Value (Grade)- Market Size & Forecast 2022-2032, USD Million
- By Feedstock Source- Market Size & Forecast 2022-2032, USD Million
- By Application- Market Size & Forecast 2022-2032, USD Million
- Market Size & Outlook
- Market Size & Outlook
- Europe Refuse-Derived Fuel Market Outlook, 2022-2032
- Market Size & Outlook
- By Revenues (USD Million)
- Market Segmentation & Outlook
- By Fuel - Market Size & Forecast 2022-2032, USD Million
- By Calorific Value (Grade)- Market Size & Forecast 2022-2032, USD Million
- By Feedstock Source- Market Size & Forecast 2022-2032, USD Million
- By Application- Market Size & Forecast 2022-2032, USD Million
- By Country
- The UK
- Russia
- Germany
- France
- Italy
- Spain
- Sweden
- Rest of Europe
- The UK Refuse-Derived Fuel Market Outlook, 2022-2032
- Market Size & Outlook
- By Revenues (USD Million)
- Market Segmentation & Outlook
- By Fuel - Market Size & Forecast 2022-2032, USD Million
- By Calorific Value (Grade)- Market Size & Forecast 2022-2032, USD Million
- By Feedstock Source- Market Size & Forecast 2022-2032, USD Million
- By Application- Market Size & Forecast 2022-2032, USD Million
- Market Size & Outlook
- Germany Refuse-Derived Fuel Market Outlook, 2022-2032
- Market Size & Outlook
- By Revenues (USD Million)
- Market Segmentation & Outlook
- By Fuel - Market Size & Forecast 2022-2032, USD Million
- By Calorific Value (Grade)- Market Size & Forecast 2022-2032, USD Million
- By Feedstock Source- Market Size & Forecast 2022-2032, USD Million
- By Application- Market Size & Forecast 2022-2032, USD Million
- Market Size & Outlook
- France Refuse-Derived Fuel Market Outlook, 2022-2032
- Market Size & Outlook
- By Revenues (USD Million)
- Market Segmentation & Outlook
- By Fuel - Market Size & Forecast 2022-2032, USD Million
- By Calorific Value (Grade)- Market Size & Forecast 2022-2032, USD Million
- By Feedstock Source- Market Size & Forecast 2022-2032, USD Million
- By Application- Market Size & Forecast 2022-2032, USD Million
- Market Size & Outlook
- Italy Refuse-Derived Fuel Market Outlook, 2022-2032
- Market Size & Outlook
- By Revenues (USD Million)
- Market Segmentation & Outlook
- By Fuel - Market Size & Forecast 2022-2032, USD Million
- By Calorific Value (Grade)- Market Size & Forecast 2022-2032, USD Million
- By Feedstock Source- Market Size & Forecast 2022-2032, USD Million
- By Application- Market Size & Forecast 2022-2032, USD Million
- Market Size & Outlook
- Spain Refuse-Derived Fuel Market Outlook, 2022-2032
- Market Size & Outlook
- By Revenues (USD Million)
- Market Segmentation & Outlook
- By Fuel - Market Size & Forecast 2022-2032, USD Million
- By Calorific Value (Grade)- Market Size & Forecast 2022-2032, USD Million
- By Feedstock Source- Market Size & Forecast 2022-2032, USD Million
- By Application- Market Size & Forecast 2022-2032, USD Million
- Market Size & Outlook
- Sweden Refuse-Derived Fuel Market Outlook, 2022-2032
- Market Size & Outlook
- By Revenues (USD Million)
- Market Segmentation & Outlook
- By Fuel - Market Size & Forecast 2022-2032, USD Million
- By Calorific Value (Grade)- Market Size & Forecast 2022-2032, USD Million
- By Feedstock Source- Market Size & Forecast 2022-2032, USD Million
- By Application- Market Size & Forecast 2022-2032, USD Million
- Market Size & Outlook
- Market Size & Outlook
- Middle East and Africa Refuse-Derived Fuel Market Outlook, 2022-2032
- Market Size & Outlook
- By Revenues (USD Million)
- Market Segmentation & Outlook
- By Fuel - Market Size & Forecast 2022-2032, USD Million
- By Calorific Value (Grade)- Market Size & Forecast 2022-2032, USD Million
- By Feedstock Source- Market Size & Forecast 2022-2032, USD Million
- By Application- Market Size & Forecast 2022-2032, USD Million
- By Country
- Saudi Arabia
- The UAE
- Egypt
- Qatar
- Kuwait
- Oman
- South Africa
- Nigeria
- Saudi Arabia Refuse-Derived Fuel Market Outlook, 2022-2032
- Market Size & Outlook
- By Revenues (USD Million)
- Market Segmentation & Outlook
- By Fuel - Market Size & Forecast 2022-2032, USD Million
- By Calorific Value (Grade)- Market Size & Forecast 2022-2032, USD Million
- By Feedstock Source- Market Size & Forecast 2022-2032, USD Million
- By Application- Market Size & Forecast 2022-2032, USD Million
- Market Size & Outlook
- The UAE Refuse-Derived Fuel Market Outlook, 2022-2032
- Market Size & Outlook
- By Revenues (USD Million)
- Market Segmentation & Outlook
- By Fuel - Market Size & Forecast 2022-2032, USD Million
- By Calorific Value (Grade)- Market Size & Forecast 2022-2032, USD Million
- By Feedstock Source- Market Size & Forecast 2022-2032, USD Million
- By Application- Market Size & Forecast 2022-2032, USD Million
- Market Size & Outlook
- Egypt Refuse-Derived Fuel Market Outlook, 2022-2032
- Market Size & Outlook
- By Revenues (USD Million)
- Market Segmentation & Outlook
- By Fuel - Market Size & Forecast 2022-2032, USD Million
- By Calorific Value (Grade)- Market Size & Forecast 2022-2032, USD Million
- By Feedstock Source- Market Size & Forecast 2022-2032, USD Million
- By Application- Market Size & Forecast 2022-2032, USD Million
- Market Size & Outlook
- Qatar Refuse-Derived Fuel Market Outlook, 2022-2032
- Market Size & Outlook
- By Revenues (USD Million)
- Market Segmentation & Outlook
- By Fuel - Market Size & Forecast 2022-2032, USD Million
- By Calorific Value (Grade)- Market Size & Forecast 2022-2032, USD Million
- By Feedstock Source- Market Size & Forecast 2022-2032, USD Million
- By Application- Market Size & Forecast 2022-2032, USD Million
- Market Size & Outlook
- Kuwait Refuse-Derived Fuel Market Outlook, 2022-2032
- Market Size & Outlook
- By Revenues (USD Million)
- Market Segmentation & Outlook
- By Fuel - Market Size & Forecast 2022-2032, USD Million
- By Calorific Value (Grade)- Market Size & Forecast 2022-2032, USD Million
- By Feedstock Source- Market Size & Forecast 2022-2032, USD Million
- By Application- Market Size & Forecast 2022-2032, USD Million
- Market Size & Outlook
- Oman Refuse-Derived Fuel Market Outlook, 2022-2032
- Market Size & Outlook
- By Revenues (USD Million)
- Market Segmentation & Outlook
- By Fuel - Market Size & Forecast 2022-2032, USD Million
- By Calorific Value (Grade)- Market Size & Forecast 2022-2032, USD Million
- By Feedstock Source- Market Size & Forecast 2022-2032, USD Million
- By Application- Market Size & Forecast 2022-2032, USD Million
- Market Size & Outlook
- South Africa Refuse-Derived Fuel Market Outlook, 2022-2032
- Market Size & Outlook
- By Revenues (USD Million)
- Market Segmentation & Outlook
- By Fuel - Market Size & Forecast 2022-2032, USD Million
- By Calorific Value (Grade)- Market Size & Forecast 2022-2032, USD Million
- By Feedstock Source- Market Size & Forecast 2022-2032, USD Million
- By Application- Market Size & Forecast 2022-2032, USD Million
- Market Size & Outlook
- Nigeria Refuse-Derived Fuel Market Outlook, 2022-2032
- Market Size & Outlook
- By Revenues (USD Million)
- Market Segmentation & Outlook
- By Fuel - Market Size & Forecast 2022-2032, USD Million
- By Calorific Value (Grade)- Market Size & Forecast 2022-2032, USD Million
- By Feedstock Source- Market Size & Forecast 2022-2032, USD Million
- By Application- Market Size & Forecast 2022-2032, USD Million
- Market Size & Outlook
- Market Size & Outlook
- Asia Pacific Refuse-Derived Fuel Market Outlook, 2022-2032
- Market Size & Outlook
- By Revenues (USD Million)
- Market Segmentation & Outlook
- By Fuel - Market Size & Forecast 2022-2032, USD Million
- By Calorific Value (Grade)- Market Size & Forecast 2022-2032, USD Million
- By Feedstock Source- Market Size & Forecast 2022-2032, USD Million
- By Application- Market Size & Forecast 2022-2032, USD Million
- By Country
- China
- Japan
- India
- South Korea
- Australia
- Indonesia
- Thailand
- Vietnam
- New Zealand
- Rest of Asia-Pacific
- China Refuse-Derived Fuel Market Outlook, 2022-2032
- Market Size & Outlook
- By Revenues (USD Million)
- Market Segmentation & Outlook
- By Fuel - Market Size & Forecast 2022-2032, USD Million
- By Calorific Value (Grade)- Market Size & Forecast 2022-2032, USD Million
- By Feedstock Source- Market Size & Forecast 2022-2032, USD Million
- By Application- Market Size & Forecast 2022-2032, USD Million
- Market Size & Outlook
- Japan Refuse-Derived Fuel Market Outlook, 2022-2032
- Market Size & Outlook
- By Revenues (USD Million)
- Market Segmentation & Outlook
- By Fuel - Market Size & Forecast 2022-2032, USD Million
- By Calorific Value (Grade)- Market Size & Forecast 2022-2032, USD Million
- By Feedstock Source- Market Size & Forecast 2022-2032, USD Million
- By Application- Market Size & Forecast 2022-2032, USD Million
- Market Size & Outlook
- India Refuse-Derived Fuel Market Outlook, 2022-2032
- Market Size & Outlook
- By Revenues (USD Million)
- Market Segmentation & Outlook
- By Fuel - Market Size & Forecast 2022-2032, USD Million
- By Calorific Value (Grade)- Market Size & Forecast 2022-2032, USD Million
- By Feedstock Source- Market Size & Forecast 2022-2032, USD Million
- By Application- Market Size & Forecast 2022-2032, USD Million
- Market Size & Outlook
- South Korea Refuse-Derived Fuel Market Outlook, 2022-2032
- Market Size & Outlook
- By Revenues (USD Million)
- Market Segmentation & Outlook
- By Fuel - Market Size & Forecast 2022-2032, USD Million
- By Calorific Value (Grade)- Market Size & Forecast 2022-2032, USD Million
- By Feedstock Source- Market Size & Forecast 2022-2032, USD Million
- By Application- Market Size & Forecast 2022-2032, USD Million
- Market Size & Outlook
- Australia Refuse-Derived Fuel Market Outlook, 2022-2032
- Market Size & Outlook
- By Revenues (USD Million)
- Market Segmentation & Outlook
- By Fuel - Market Size & Forecast 2022-2032, USD Million
- By Calorific Value (Grade)- Market Size & Forecast 2022-2032, USD Million
- By Feedstock Source- Market Size & Forecast 2022-2032, USD Million
- By Application- Market Size & Forecast 2022-2032, USD Million
- Market Size & Outlook
- Indonesia Refuse-Derived Fuel Market Outlook, 2022-2032
- Market Size & Outlook
- By Revenues (USD Million)
- Market Segmentation & Outlook
- By Fuel - Market Size & Forecast 2022-2032, USD Million
- By Calorific Value (Grade)- Market Size & Forecast 2022-2032, USD Million
- By Feedstock Source- Market Size & Forecast 2022-2032, USD Million
- By Application- Market Size & Forecast 2022-2032, USD Million
- Market Size & Outlook
- Thailand Refuse-Derived Fuel Market Outlook, 2022-2032
- Market Size & Outlook
- By Revenues (USD Million)
- Market Segmentation & Outlook
- By Fuel - Market Size & Forecast 2022-2032, USD Million
- By Calorific Value (Grade)- Market Size & Forecast 2022-2032, USD Million
- By Feedstock Source- Market Size & Forecast 2022-2032, USD Million
- By Application- Market Size & Forecast 2022-2032, USD Million
- Market Size & Outlook
- New Zealand Refuse-Derived Fuel Market Outlook, 2022-2032
- Market Size & Outlook
- By Revenues (USD Million)
- Market Segmentation & Outlook
- By Fuel - Market Size & Forecast 2022-2032, USD Million
- By Calorific Value (Grade)- Market Size & Forecast 2022-2032, USD Million
- By Feedstock Source- Market Size & Forecast 2022-2032, USD Million
- By Application- Market Size & Forecast 2022-2032, USD Million
- Market Size & Outlook
- Vietnam Refuse-Derived Fuel Market Outlook, 2022-2032
- Market Size & Outlook
- By Revenues (USD Million)
- Market Segmentation & Outlook
- By Fuel - Market Size & Forecast 2022-2032, USD Million
- By Calorific Value (Grade)- Market Size & Forecast 2022-2032, USD Million
- By Feedstock Source- Market Size & Forecast 2022-2032, USD Million
- By Application- Market Size & Forecast 2022-2032, USD Million
- Market Size & Outlook
- Market Size & Outlook
- Refuse-Derived Fuel Market Key Strategic Imperatives for Success & Growth
- Competitive Outlook
- Company Profiles
- Veolia Environnement S.A.
- Business Description
- Product Portfolio
- Collaborations & Alliances
- Recent Developments
- Financial Details
- Others
- SUEZ S.A.
- Business Description
- Product Portfolio
- Collaborations & Alliances
- Recent Developments
- Financial Details
- Others
- STADLER Anlagenbau GmbH
- Business Description
- Product Portfolio
- Collaborations & Alliances
- Recent Developments
- Financial Details
- Others
- Remondis SE & Co. KG
- Business Description
- Product Portfolio
- Collaborations & Alliances
- Recent Developments
- Financial Details
- Others
- Biffa plc
- Business Description
- Product Portfolio
- Collaborations & Alliances
- Recent Developments
- Financial Details
- Others
- FCC Environment (UK) Limited
- Business Description
- Product Portfolio
- Collaborations & Alliances
- Recent Developments
- Financial Details
- Others
- Indaver NV
- Business Description
- Product Portfolio
- Collaborations & Alliances
- Recent Developments
- Financial Details
- Others
- ALBA Group plc & Co. KG
- Business Description
- Product Portfolio
- Collaborations & Alliances
- Recent Developments
- Financial Details
- Others
- Geminor AS
- Business Description
- Product Portfolio
- Collaborations & Alliances
- Recent Developments
- Financial Details
- Others
- Andusia Recovered Fuels Limited
- Business Description
- Product Portfolio
- Collaborations & Alliances
- Recent Developments
- Financial Details
- Others
- N&P Alternative Fuels B.V.
- Business Description
- Product Portfolio
- Collaborations & Alliances
- Recent Developments
- Financial Details
- Others
- Renewi plc
- Business Description
- Product Portfolio
- Collaborations & Alliances
- Recent Developments
- Financial Details
- Others
- Geocycle (Holcim Group)
- Business Description
- Product Portfolio
- Collaborations & Alliances
- Recent Developments
- Financial Details
- Others
- PreZero International GmbH
- Business Description
- Product Portfolio
- Collaborations & Alliances
- Recent Developments
- Financial Details
- Others
- Viridor Limited
- Business Description
- Product Portfolio
- Collaborations & Alliances
- Recent Developments
- Financial Details
- Others
- Covanta Holding Corporation
- Business Description
- Product Portfolio
- Collaborations & Alliances
- Recent Developments
- Financial Details
- Others
- Veolia Environnement S.A.
- Company Profiles
- Disclaimer

MarkNtel Advisors follows a robust and iterative research methodology designed to ensure maximum accuracy and minimize deviation in market estimates and forecasts. Our approach combines both bottom-up and top-down techniques to effectively segment and quantify various aspects of the market. A consistent feature across all our research reports is data triangulation, which examines the market from three distinct perspectives to validate findings. Key components of our research process include:
1. Scope & Research Design At the outset, MarkNtel Advisors define the research objectives and formulate pertinent questions. This phase involves determining the type of research—qualitative or quantitative—and designing a methodology that outlines data collection methods, target demographics, and analytical tools. They also establish timelines and budgets to ensure the research aligns with client goals.
2. Sample Selection and Data Collection In this stage, the firm identifies the target audience and determines the appropriate sample size to ensure representativeness. They employ various sampling methods, such as random or stratified sampling, based on the research objectives. Data collection is carried out using tools like surveys, interviews, and observations, ensuring the gathered data is reliable and relevant.
3. Data Analysis and Validation Once data is collected, MarkNtel Advisors undertake a rigorous analysis process. This includes cleaning the data to remove inconsistencies, employing statistical software for quantitative analysis, and thematic analysis for qualitative data. Validation steps are taken to ensure the accuracy and reliability of the findings, minimizing biases and errors.

4. Data Forecast and FinalizationThe final phase involves forecasting future market trends based on the analyzed data. MarkNtel Advisors utilize predictive modeling and time series analysis to anticipate market behaviors. The insights are then compiled into comprehensive reports, featuring visual aids like charts and graphs, and include strategic recommendations to inform client decision-making
FILL THE FORM TO INQUIRE BEFORE BUYING THIS REPORT
We offer flexible licensing options to cater to varying organizational needs. Choose the pricing pack that best suits your requirements:
Buy Now Talk to our Consultant
 Request Customization