
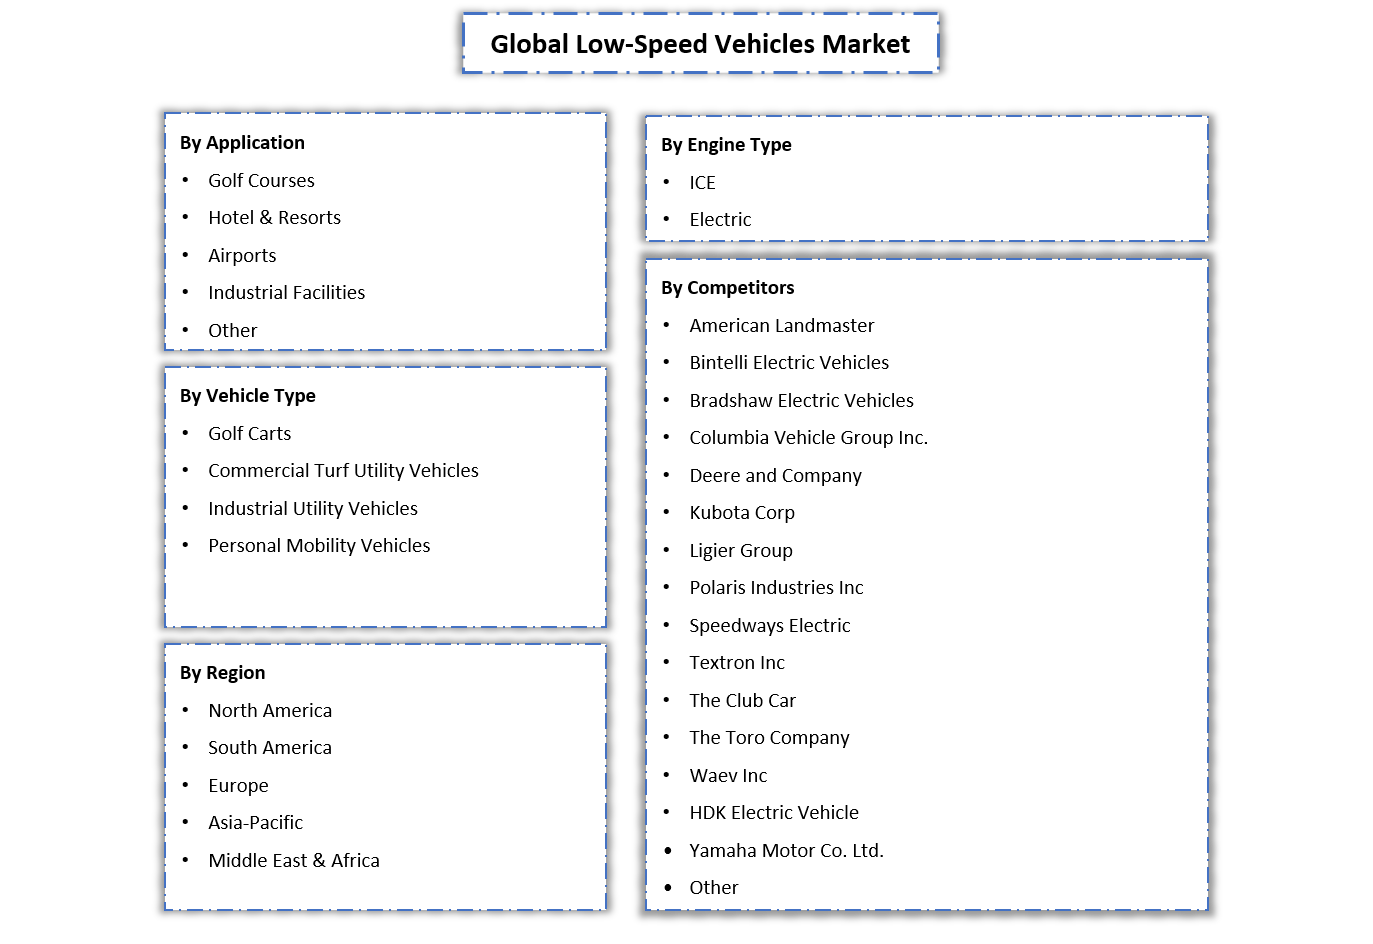
By Application (Golf Courses, Hotel & Resorts, Airports, Industrial Facilities, Other), By Vehicle Type (Golf Carts, Commercial Turf Utility Vehicles, Industrial Utility Vehicles,......Personal Mobility Vehicles), By Engine Type (ICE, Electric), By Region (North America, South America, Europe, Asia-Pacific, Middle East & Africa), By Company (American Landmaster, Bintelli Electric Vehicles, Bradshaw Electric Vehicles , Columbia Vehicle Group Inc., Deere and Company , Kubota Corp, Ligier Group, Polaris Industries Inc, Speedways Electric, Textron Inc, The Club Car, The Toro Company, Waev Inc, HDK Electric Vehicle, Yamaha Motor Co. Ltd., Other) Read more
- Automotive
- Jul 2023
- 194
- PDF, Excel, PPT
Market Definition
Low Speed Vehicles (LSVs), characterized by their four-wheeled structure and a maximum speed ranging from 20 to 25 mph (32 to 40 km/h), are typically classified as motor vehicles with a gross vehicle weight rating below 3,000 pounds.
Market Insights & Analysis: Global Low Speed Vehicles Market (2023-28)
The Global Low Speed Vehicles Market size was reached at USD 8.5 billion in 2022 and is projected to grow at a CAGR of around 6.5% during the forecast period, i.e., 2023-28. Most of the market expansion ascribes to the increasing usage of LSVs in towns & cities for short-distance journeys. Eco-friendly vehicles have gained recognition in recent years, especially for short commutes as they not only reduce carbon emissions but also offer efficient transportation. As a result, the growing adoption of low speed vehicles in numerous applications, such as airports, resorts, hospitals, and residential areas is anticipated to drive the market.
Another factor encouraging Low Speed Vehicles (LSVs) market growth is the implementation of strict emission laws & regulations by governments. The rising pollution levels and the need to conserve fossil fuel stocks are driving the automotive industry toward eco-friendly mobility alternatives, including LSVs. Furthermore, advancements in ride-hailing and embedded mobility options, along with the demand for vehicles among the aging population, are expected to support the expansion of the Low-Speed Vehicles industry.
| Report Coverage | Details |
|---|---|
| Study Period | Historical Data: 2018-21 |
| Base Year: 2022 | |
| Forecast Period: 2023-28 | |
| CAGR (2023-2028) | 6.5% |
| Regions Covered | North America: US, Canada, Mexico |
| Europe: Germany, The UK, France, Spain, Italy, Rest of Europe | |
| Asia-Pacific: China, India, Japan, South Korea, Australia, Rest of Asia-Pacific | |
| South America: Brazil, Argentina, Rest of South America | |
| Middle East & Africa: UAE, Saudi Arabia, South Africa, Rest of MEA | |
| Key Companies Profiled | American Landmaster, Bintelli Electric Vehicles, Bradshaw Electric Vehicles , Columbia Vehicle Group Inc., Deere and Company , Kubota Corp, Ligier Group, Polaris Industries Inc, Speedways Electric, Textron Inc, The Club Car, The Toro Company, Waev Inc, HDK Electric Vehicle, Yamaha Motor Co. Ltd., Other |
| Market Value | USD 8.5 Billion |
Key players in North America, such as Textron and Polaris, have adopted strategies like supply contracts, new product developments, and expansions to enhance their businesses. They are actively focused on developing cost-effective and easy-to-drive vehicles, further boosting market growth. Moreover, several countries worldwide have established performance & safety standards for LSVs, i.e., leading to manufacturers showing increased interest in this industry.
Additionally, some countries are offering special incentives to companies, demonstrating a strong commitment to LSVs. Hence, these aspects, coupled with the high demand for LSVs in various applications, including hunting, meter maids, grounds maintenance, yard work, & campus security, are set to spur growth in the global Low Speed Vehicles market through 2028.
Global Low Speed Vehicles Market Growth Opportunity:
The Revival of Golf and Its Massive Popularity Worldwide: Over the past few years, golf has witnessed immense popularity backed by modernization, the pandemic, and its appeal to diverse demographics. With over 119 million people engaged in golf-related activities, the sport has experienced a revitalization, Says National Golf Foundation. The United States alone saw a 12% increase in participation, with 3.4 million junior players, the highest level since 2006. Women comprise 25% of on-course golfers and demonstrate higher representation in beginner and junior categories.
Global Low Speed Vehicles Market Research Report (2023-2028) - Table of Contents
- Market Segmentation
- Introduction
- Product Definition
- Research Process
- Assumptions
- Executive Summary
- Global Low Speed Vehicles Market Regulations and Policy
- Global Low Speed Vehicles Market Trends & Developments
- Global Low Speed Vehicles Market Supply Chain Analysis
- Global Low Speed Vehicles Market Dynamics
- Drivers
- Challenges
- Global Low Speed Vehicles Market Hotspot & Opportunities
- Global Low Speed Vehicles Market Outlook, 2018-2028F
- Market Size & Analysis
- By Revenues (USD Million)
- Market Share & Analysis
- By Vehicle Type
- Golf Carts- Market Size & Forecast 2018-2028, (USD Million)
- Commercial Turf Utility Vehicle- Market Size & Forecast 2018-2028, (USD Million)
- Industrial Utility Vehicle- Market Size & Forecast 2018-2028, (USD Million)
- Personal Mobility Vehicle- Market Size & Forecast 2018-2028, (USD Million)
- By Engine Type
- ICE- Market Size & Forecast 2018-2028, (USD Million)
- Electric- Market Size & Forecast 2018-2028, (USD Million)
- By Application
- Golf Courses- Market Size & Forecast 2018-2028, (USD Million)
- Hotel & Resorts- Market Size & Forecast 2018-2028, (USD Million)
- Airports- Market Size & Forecast 2018-2028, (USD Million)
- Industrial Facilities- Market Size & Forecast 2018-2028, (USD Million)
- Others- Market Size & Forecast 2018-2028, (USD Million)
- By Region
- North America
- South America
- Europe
- Asia-Pacific
- The Middle East and Africa
- By Company
- Market Share
- Competition Characteristics
- By Vehicle Type
- Market Size & Analysis
- North America Low Speed Vehicles Market Outlook, 2018-2028F
- Market Size & Analysis
- By Revenues (USD Million)
- Market Share & Analysis
- By Vehicle Type- Market Size & Forecast 2018-2028, (USD Million)
- By Engine Type- Market Size & Forecast 2018-2028, (USD Million)
- By Application- Market Size & Forecast 2018-2028, (USD Million)
- By Country
- The US
- Canada
- Mexico
- The US Low Speed Vehicles Market Outlook, 2018-2028F
- Market Size & Analysis
- By Revenues (USD Million)
- Market Share & Analysis
- By Vehicle Type- Market Size & Forecast 2018-2028, (USD Million)
- By Engine Type- Market Size & Forecast 2018-2028, (USD Million)
- By Application- Market Size & Forecast 2018-2028, (USD Million)
- Market Size & Analysis
- Canada Low Speed Vehicles Market Outlook, 2018-2028F
- Market Size & Analysis
- By Revenues (USD Million)
- Market Share & Analysis
- By Vehicle Type- Market Size & Forecast 2018-2028, (USD Million)
- By Engine Type- Market Size & Forecast 2018-2028, (USD Million)
- By Application- Market Size & Forecast 2018-2028, (USD Million)
- Market Size & Analysis
- Mexico Low Speed Vehicles Market Outlook, 2018-2028F
- Market Size & Analysis
- By Revenues (USD Million)
- Market Share & Analysis
- By Vehicle Type- Market Size & Forecast 2018-2028, (USD Million)
- By Engine Type- Market Size & Forecast 2018-2028, (USD Million)
- By Application- Market Size & Forecast 2018-2028, (USD Million)
- Market Size & Analysis
- Market Size & Analysis
- South America Low Speed Vehicles Market Outlook, 2018-2028F
- Market Size & Analysis
- By Revenues (USD Million)
- Market Share & Analysis
- By Vehicle Type- Market Size & Forecast 2018-2028, (USD Million)
- By Engine Type- Market Size & Forecast 2018-2028, (USD Million)
- By Application- Market Size & Forecast 2018-2028, (USD Million)
- By Country
- Brazil
- Argentina
- Rest of South America
- Brazil Low Speed Vehicles Market Outlook, 2018-2028F
- Market Size & Analysis
- By Revenues (USD Million)
- Market Share & Analysis
- By Vehicle Type- Market Size & Forecast 2018-2028, (USD Million)
- By Engine Type- Market Size & Forecast 2018-2028, (USD Million)
- By Application- Market Size & Forecast 2018-2028, (USD Million)
- Market Size & Analysis
- Argentina Low Speed Vehicles Market Outlook, 2018-2028F
- Market Size & Analysis
- By Revenues (USD Million)
- Market Share & Analysis
- By Vehicle Type- Market Size & Forecast 2018-2028, (USD Million)
- By Engine Type- Market Size & Forecast 2018-2028, (USD Million)
- By Application- Market Size & Forecast 2018-2028, (USD Million)
- Market Size & Analysis
- Market Size & Analysis
- Europe Low Speed Vehicles Market Outlook, 2018-2028F
- Market Size & Analysis
- By Revenues (USD Million)
- Market Share & Analysis
- By Vehicle Type- Market Size & Forecast 2018-2028, (USD Million)
- By Engine Type- Market Size & Forecast 2018-2028, (USD Million)
- By Application- Market Size & Forecast 2018-2028, (USD Million)
- By Country
- Germany
- The UK
- France
- Italy
- Spain
- Rest of Europe
- Germany Low Speed Vehicles Market Outlook, 2018-2028F
- Market Size & Analysis
- By Revenues (USD Million)
- Market Share & Analysis
- By Vehicle Type- Market Size & Forecast 2018-2028, (USD Million)
- By Engine Type- Market Size & Forecast 2018-2028, (USD Million)
- By Application- Market Size & Forecast 2018-2028, (USD Million)
- Market Size & Analysis
- The UK Low Speed Vehicles Market Outlook, 2018-2028F
- Market Size & Analysis
- By Revenues (USD Million)
- Market Share & Analysis
- By Vehicle Type- Market Size & Forecast 2018-2028, (USD Million)
- By Engine Type- Market Size & Forecast 2018-2028, (USD Million)
- By Application- Market Size & Forecast 2018-2028, (USD Million)
- Market Size & Analysis
- France Low Speed Vehicles Market Outlook, 2018-2028F
- Market Size & Analysis
- By Revenues (USD Million)
- Market Share & Analysis
- By Vehicle Type- Market Size & Forecast 2018-2028, (USD Million)
- By Engine Type- Market Size & Forecast 2018-2028, (USD Million)
- By Application- Market Size & Forecast 2018-2028, (USD Million)
- Market Size & Analysis
- Italy Low Speed Vehicles Market Outlook, 2018-2028F
- Market Size & Analysis
- By Revenues (USD Million)
- Market Share & Analysis
- By Vehicle Type- Market Size & Forecast 2018-2028, (USD Million)
- By Engine Type- Market Size & Forecast 2018-2028, (USD Million)
- By Application- Market Size & Forecast 2018-2028, (USD Million)
- Market Size & Analysis
- Spain Low Speed Vehicles Market Outlook, 2018-2028F
- Market Size & Analysis
- By Revenues (USD Million)
- Market Share & Analysis
- By Vehicle Type- Market Size & Forecast 2018-2028, (USD Million)
- By Engine Type- Market Size & Forecast 2018-2028, (USD Million)
- By Application- Market Size & Forecast 2018-2028, (USD Million)
- Market Size & Analysis
- Market Size & Analysis
- Asia-Pacific Low Speed Vehicles Market Outlook, 2018-2028F
- Market Size & Analysis
- By Revenues (USD Million)
- Market Share & Analysis
- By Vehicle Type- Market Size & Forecast 2018-2028, (USD Million)
- By Engine Type- Market Size & Forecast 2018-2028, (USD Million)
- By Application- Market Size & Forecast 2018-2028, (USD Million)
- By Country
- China
- Japan
- Australia
- India
- South Korea
- Rest of Asia Pacific
- China Low Speed Vehicles Market Outlook, 2018-2028F
- Market Size & Analysis
- By Revenues (USD Million)
- Market Share & Analysis
- By Vehicle Type- Market Size & Forecast 2018-2028, (USD Million)
- By Engine Type- Market Size & Forecast 2018-2028, (USD Million)
- By Application- Market Size & Forecast 2018-2028, (USD Million)
- Market Size & Analysis
- Japan Low Speed Vehicles Market Outlook, 2018-2028F
- Market Size & Analysis
- By Revenues (USD Million)
- Market Share & Analysis
- By Vehicle Type- Market Size & Forecast 2018-2028, (USD Million)
- By Engine Type- Market Size & Forecast 2018-2028, (USD Million)
- By Application- Market Size & Forecast 2018-2028, (USD Million)
- Market Size & Analysis
- Australia Low Speed Vehicles Market Outlook, 2018-2028F
- Market Size & Analysis
- By Revenues (USD Million)
- Market Share & Analysis
- By Vehicle Type- Market Size & Forecast 2018-2028, (USD Million)
- By Engine Type- Market Size & Forecast 2018-2028, (USD Million)
- By Application- Market Size & Forecast 2018-2028, (USD Million)
- Market Size & Analysis
- India Low Speed Vehicles Market Outlook, 2018-2028F
- Market Size & Analysis
- By Revenues (USD Million)
- Market Share & Analysis
- By Vehicle Type- Market Size & Forecast 2018-2028, (USD Million)
- By Engine Type- Market Size & Forecast 2018-2028, (USD Million)
- By Application- Market Size & Forecast 2018-2028, (USD Million)
- Market Size & Analysis
- South Korea Low Speed Vehicles Market Outlook, 2018-2028F
- Market Size & Analysis
- By Revenues (USD Million)
- Market Share & Analysis
- By Vehicle Type- Market Size & Forecast 2018-2028, (USD Million)
- By Engine Type- Market Size & Forecast 2018-2028, (USD Million)
- By Application- Market Size & Forecast 2018-2028, (USD Million)
- Market Size & Analysis
- Market Size & Analysis
- The Middle East and Africa Low Speed Vehicles Market Outlook, 2018-2028F
- Market Size & Analysis
- By Revenues (USD Million)
- Market Share & Analysis
- By Vehicle Type- Market Size & Forecast 2018-2028, (USD Million)
- By Engine Type- Market Size & Forecast 2018-2028, (USD Million)
- By Application- Market Size & Forecast 2018-2028, (USD Million)
- By Country
- South Africa
- The UAE
- Saudi Arabia
- Rest of Middle East and Africa
- South Africa Low Speed Vehicles Market Outlook, 2018-2028F
- Market Size & Analysis
- By Revenues (USD Million)
- Market Share & Analysis
- By Vehicle Type- Market Size & Forecast 2018-2028, (USD Million)
- By Engine Type- Market Size & Forecast 2018-2028, (USD Million)
- By Application- Market Size & Forecast 2018-2028, (USD Million)
- Market Size & Analysis
- The UAE Low Speed Vehicles Market Outlook, 2018-2028F
- Market Size & Analysis
- By Revenues (USD Million)
- Market Share & Analysis
- By Vehicle Type- Market Size & Forecast 2018-2028, (USD Million)
- By Engine Type- Market Size & Forecast 2018-2028, (USD Million)
- By Application- Market Size & Forecast 2018-2028, (USD Million)
- Market Size & Analysis
- Saudi Arabia Low Speed Vehicles Market Outlook, 2018-2028F
- Market Size & Analysis
- By Revenues (USD Million)
- Market Share & Analysis
- By Vehicle Type- Market Size & Forecast 2018-2028, (USD Million)
- By Engine Type- Market Size & Forecast 2018-2028, (USD Million)
- By Application- Market Size & Forecast 2018-2028, (USD Million)
- Market Size & Analysis
- Market Size & Analysis
- Competitive Outlook
- Company Profiles
- Textron Inc
- Business Description
- Product Portfolio
- Strategic Alliances or Partnerships
- Recent Developments
- Financial Details
- Others
- Deere and Company
- Business Description
- Product Portfolio
- Strategic Alliances or Partnerships
- Recent Developments
- Financial Details
- Others
- Yamaha Motor Co. Ltd
- Business Description
- Product Portfolio
- Strategic Alliances or Partnerships
- Recent Developments
- Financial Details
- Others
- The Toro Company
- Business Description
- Product Portfolio
- Strategic Alliances or Partnerships
- Recent Developments
- Financial Details
- Others
- The Club Car
- Business Description
- Product Portfolio
- Strategic Alliances or Partnerships
- Recent Developments
- Financial Details
- Others
- American Land Master
- Business Description
- Product Portfolio
- Strategic Alliances or Partnerships
- Recent Developments
- Financial Details
- Others
- Columbia Vehicle Group Inc
- Business Description
- Product Portfolio
- Strategic Alliances or Partnerships
- Recent Developments
- Financial Details
- Others
- Waev Inc.
- Business Description
- Product Portfolio
- Strategic Alliances or Partnerships
- Recent Developments
- Financial Details
- Others
- Polaris Industries Inc.
- Business Description
- Product Portfolio
- Strategic Alliances or Partnerships
- Recent Developments
- Financial Details
- Others
- Bradshaw Electric Vehicles
- Business Description
- Product Portfolio
- Strategic Alliances or Partnerships
- Recent Developments
- Financial Details
- Others
- Kubota Corp
- Business Description
- Product Portfolio
- Strategic Alliances or Partnerships
- Recent Developments
- Financial Details
- Others
- Ligier Group
- Business Description
- Product Portfolio
- Strategic Alliances or Partnerships
- Recent Developments
- Financial Details
- Others
- Speedways Electric
- Business Description
- Product Portfolio
- Strategic Alliances or Partnerships
- Recent Developments
- Financial Details
- Others
- Xiamen Dalle Electric Car Co., Ltd (HDK electric vehicle)
- Business Description
- Product Portfolio
- Strategic Alliances or Partnerships
- Recent Developments
- Financial Details
- Others
- Bintelli Electric Vehicles
- Business Description
- Product Portfolio
- Strategic Alliances or Partnerships
- Recent Developments
- Financial Details
- Others
- Others
- Business Description
- Product Portfolio
- Strategic Alliances or Partnerships
- Recent Developments
- Financial Details
- Others
- Textron Inc
- Company Profiles
- Disclaimer
MarkNtel Advisors follows a robust and iterative research methodology designed to ensure maximum accuracy and minimize deviation in market estimates and forecasts. Our approach combines both bottom-up and top-down techniques to effectively segment and quantify various aspects of the market. A consistent feature across all our research reports is data triangulation, which examines the market from three distinct perspectives to validate findings. Key components of our research process include:
1. Scope & Research Design At the outset, MarkNtel Advisors define the research objectives and formulate pertinent questions. This phase involves determining the type of research—qualitative or quantitative—and designing a methodology that outlines data collection methods, target demographics, and analytical tools. They also establish timelines and budgets to ensure the research aligns with client goals.
2. Sample Selection and Data Collection In this stage, the firm identifies the target audience and determines the appropriate sample size to ensure representativeness. They employ various sampling methods, such as random or stratified sampling, based on the research objectives. Data collection is carried out using tools like surveys, interviews, and observations, ensuring the gathered data is reliable and relevant.
3. Data Analysis and Validation Once data is collected, MarkNtel Advisors undertake a rigorous analysis process. This includes cleaning the data to remove inconsistencies, employing statistical software for quantitative analysis, and thematic analysis for qualitative data. Validation steps are taken to ensure the accuracy and reliability of the findings, minimizing biases and errors.

4. Data Forecast and FinalizationThe final phase involves forecasting future market trends based on the analyzed data. MarkNtel Advisors utilize predictive modeling and time series analysis to anticipate market behaviors. The insights are then compiled into comprehensive reports, featuring visual aids like charts and graphs, and include strategic recommendations to inform client decision-making
FILL THE FORM TO INQUIRE BEFORE BUYING THIS REPORT
We offer flexible licensing options to cater to varying organizational needs. Choose the pricing pack that best suits your requirements:
Buy Now