
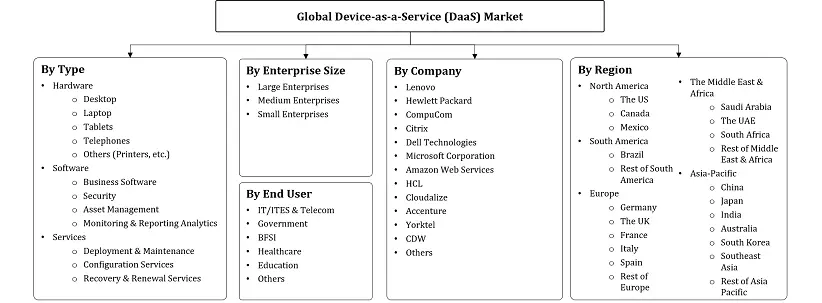
Device-as-a-Service (DaaS) Market - By Type (Hardware, Software, Services), By Enterprise Size (Large Enterprises, Medium Enterprises, Small Enterprises), By End User (IT/ITES & Te......lecom, Government, BFSI, Healthcare, Education, Others) Read more
- ICT & Electronics
- Apr 2024
- 260
- PDF, Excel, PPT
Market Definition
Device-as-a-Service (DaaS) is a subscription-based model in which businesses or enterprises opt for rented hardware devices like computers, laptops, tablets, smartphones, IoT devices, and software platforms from a service provider instead of buying and owning them directly.
Market Insights & Analysis: Global Device-as-a-Service (DaaS) Market (2024-30):
The Global Device-as-a-Service (DaaS) Market size is estimated to grow at a CAGR of around 25.75% during the forecast period, i.e., 2024-30. The factors attributing to the growth of the Device-as-a-Service are the increasing usage of DaaS solutions in end-user industries like BFSI, IT & Telecom, etc., and the rising government initiatives for digitalization. In recent years, the internet penetration of countries like India, China, the UAE, etc., has significantly increased.
| Report Coverage | Details |
|---|---|
| Study Period | Historical Data: 2019-22 |
| Base Year: 2023 | |
| Forecast Period: 2024-30 | |
| CAGR (2024-2030) | 25.75% |
| Regions Covered | North America: US, Canada, Mexico |
| Europe: Germany, The UK, France, Spain, Italy, Rest of Europe | |
| Asia-Pacific: China, India, Japan, Australia, South Korea, Southeast Asia, Rest of Asia-Pacific | |
| South America: Brazil, Argentina, Rest of South America | |
| Middle East & Africa: UAE, Saudi Arabia, South Africa, Egypt, Rest of MEA | |
| Key Companies Profiled | Lenovo, Hewlett Packard, CompuCom, Citrix, Dell Technologies, Microsoft Corporation, Amazon Web Services, HCL, Cloudalize, Accenture, Yorktel, CDW, Others |
| Unit Denominations | USD Million/Billion |
According to the China Internet Network Information Center (CNNIC), in 2023, the internet penetration in China reached 77.5%, an increase of about 3% compared to 2022. The surge in internet penetration rates & accessibility of smartphones has created a conducive environment for businesses. As a result, several organizations are transitioning towards digitalization and providing digital services to consumers. The increasing inclination of large & medium scale enterprises towards digitalization is enhancing the adoption of DaaS solutions since these solutions help organizations manage and analyze digital data cost-effectively.
In addition, digital services streamline the administrative process & reduce manual efforts, and offer transparency. Along with it, digitalization helps end-users, like the government, BFSI, IT & Telecom, etc., make informed decisions based on the collected data, which improves the quality of services delivered to consumers. As a result, the governments of countries like the UAE, India, Indonesia, etc., are laying initiatives such as Digital India, the UAE Digital Government Strategy 2025, etc., to facilitate the adoption of digitalization across different industry verticals. The increasing implementation of these government initiatives is enhancing the adoption of cost-effective digital solutions within organizations, necessitating the requirement for DaaS solutions to provide access to advanced analytics at minimal costs, driving market growth & expansion.
Further, the governments of countries like the US, India, etc., are rolling out 5G in their countries to provide excellent technology infrastructure to tech companies & users. The governments of these countries & private telecom companies are investing heavily to stimulate the adoption of 5G in their countries. According to the company website, Jio, an Indian telecommunications corporation, announced an investment of around USD 14 billion to roll out the 5G network in India. These rising investments to augment the 5G network would facilitate the need for digital solutions for data utilization & analysis. Hence, end-users would seek to use DaaS solutions to enable faster data processing and localized analytics, boosting the size & volume of the Global Device-as-a-Service (DaaS) Market during the forecast period.
- Introduction
- Research Process
- Assumption
- Market Segmentation
- Market Definition
- Executive Summary
- Global Device-as-a-Service (DaaS) Market Policy & Regulations
- Global Device-as-a-Service (DaaS) Market Trends & Developments
- Global Device-as-a-Service (DaaS) Market Dynamics
- Impact Analysis
- Drivers
- Challenges
- Global Device-as-a-Service (DaaS) Market Demand Side- Supply Side Analysis
- Voice of Customer, By Region
- Reason to adopt DaaS
- Key Factors Taken into Consideration while Selecting Vendor
- Key Technical Configuration Required in Organization
- Key Decision Maker for Availing Services
- Customer Expectations from The Vendor
- Current Usage Vs Future Plan to Avail the Services
- Pricing Range for Availing the Services
- Annual Budget Allocation to Invest on Services
- Voice of Customer, By Region
- Global Device-as-a-Service (DaaS) Market Analysis, 2019-2030F
- Market Size & Analysis
- By Revenues (USD Million)
- Market Share & Analysis
- By Type
- Hardware- (Market Size & Forecast 2019-2030, (USD Million)
- Desktop- (Market Size & Forecast 2019-2030, (USD Million)
- Laptop- (Market Size & Forecast 2019-2030, (USD Million)
- Tablets- (Market Size & Forecast 2019-2030, (USD Million)
- Telephones- (Market Size & Forecast 2019-2030, (USD Million)
- Others (Printers, etc.) - (Market Size & Forecast 2019-2030, (USD Million)
- Software- (Market Size & Forecast 2019-2030, (USD Million)
- Business Software- (Market Size & Forecast 2019-2030, (USD Million)
- Security- (Market Size & Forecast 2019-2030, (USD Million)
- Asset Management- (Market Size & Forecast 2019-2030, (USD Million)
- Monitoring & Reporting Analytics- (Market Size & Forecast 2019-2030, (USD Million)
- Services
- Deployment & Maintenance- (Market Size & Forecast 2019-2030, (USD Million)
- Configuration Services- (Market Size & Forecast 2019-2030, (USD Million)
- Recovery & Renewal Services- (Market Size & Forecast 2019-2030, (USD Million)
- Hardware- (Market Size & Forecast 2019-2030, (USD Million)
- By Enterprise Size
- Large Enterprises- (Market Size & Forecast 2019-2030, (USD Million)
- Medium Enterprises- (Market Size & Forecast 2019-2030, (USD Million)
- Small Enterprises- (Market Size & Forecast 2019-2030, (USD Million)
- By End User
- IT/ITES & Telecom- (Market Size & Forecast 2019-2030, (USD Million)
- Government- (Market Size & Forecast 2019-2030, (USD Million)
- BFSI- (Market Size & Forecast 2019-2030, (USD Million)
- Healthcare- (Market Size & Forecast 2019-2030, (USD Million)
- Education- (Market Size & Forecast 2019-2030, (USD Million)
- Others- (Market Size & Forecast 2019-2030, (USD Million)
- By Region
- North America
- South America
- Europe
- The Middle East & Africa
- Asia-Pacific
- By Company
- Competition Characteristics
- Revenue Shares
- By Type
- Market Size & Analysis
- North America Device-as-a-Service (DaaS) Market Analysis, 2019-2030
- Market Size & Analysis
- By Revenues (USD Million)
- Market Share & Analysis
- By Type- (Market Size & Forecast 2019-2030, (USD Million)
- By Enterprise Size- (Market Size & Forecast 2019-2030, (USD Million)
- By End User- (Market Size & Forecast 2019-2030, (USD Million)
- By Country- (Market Size & Forecast 2019-2030, (USD Million)
- The US
- Canada
- Mexico
- The United States Device-as-a-Service (DaaS) Market Analysis, 2019-2030
- Market Size & Analysis
- Market Revenues
- Market Share & Analysis
- By Type- (Market Size & Forecast 2019-2030, (USD Million)
- By End User- (Market Size & Forecast 2019-2030, (USD Million)
- Market Size & Analysis
- Canada Device-as-a-Service (DaaS) Market Analysis, 2019-2030
- Market Size & Analysis
- Market Revenues
- Market Share & Analysis
- By Type- (Market Size & Forecast 2019-2030, (USD Million)
- By End User- (Market Size & Forecast 2019-2030, (USD Million)
- Market Size & Analysis
- Mexico Device-as-a-Service (DaaS) Market Analysis, 2019-2030
- Market Size & Analysis
- Market Revenues
- Market Share & Analysis
- By Type- (Market Size & Forecast 2019-2030, (USD Million)
- By End User- (Market Size & Forecast 2019-2030, (USD Million)
- Market Size & Analysis
- Market Size & Analysis
- South America Device-as-a-Service (DaaS) Market Analysis, 2019-2030
- Market Size & Analysis
- By Revenues (USD Million)
- Market Share & Analysis
- By Type- (Market Size & Forecast 2019-2030, (USD Million)
- By Enterprise Size- (Market Size & Forecast 2019-2030, (USD Million)
- By End User- (Market Size & Forecast 2019-2030, (USD Million)
- By Country
- Brazil
- Argentina
- Rest of South America
- Brazil Device-as-a-Service (DaaS) Market Analysis, 2019-2030
- Market Size & Analysis
- By Revenues (USD Million)
- Market Share & Analysis
- By Type- (Market Size & Forecast 2019-2030, (USD Million)
- By End User- (Market Size & Forecast 2019-2030, (USD Million)
- Market Size & Analysis
- Argentina Device-as-a-Service (DaaS) Market Analysis, 2019-2030
- Market Size & Analysis
- By Revenues (USD Million)
- Market Share & Analysis
- By Type- (Market Size & Forecast 2019-2030, (USD Million)
- By End User- (Market Size & Forecast 2019-2030, (USD Million)
- Market Size & Analysis
- Market Size & Analysis
- Europe Device-as-a-Service (DaaS) Market Analysis, 2019-2030
- Market Size & Analysis
- By Revenues (USD Million)
- Market Share & Analysis
- By Type- (Market Size & Forecast 2019-2030, (USD Million)
- By Enterprise Size- (Market Size & Forecast 2019-2030, (USD Million)
- By End User- (Market Size & Forecast 2019-2030, (USD Million)
- By Country
- The UK
- Germany
- France
- Italy
- Spain
- Rest of Europe
- The UK Device-as-a-Service (DaaS) Market Analysis, 2019-2030
- Market Size & Analysis
- By Revenues (USD Million)
- Market Share & Analysis
- By Type- (Market Size & Forecast 2019-2030, (USD Million)
- By End User- (Market Size & Forecast 2019-2030, (USD Million)
- Market Size & Analysis
- Germany Device-as-a-Service (DaaS) Market Analysis, 2019-2030
- Market Size & Analysis
- By Revenues (USD Million)
- Market Share & Analysis
- By Type- (Market Size & Forecast 2019-2030, (USD Million)
- By End User- (Market Size & Forecast 2019-2030, (USD Million)
- Market Size & Analysis
- France Device-as-a-Service (DaaS) Market Analysis, 2019-2030
- Market Size & Analysis
- By Revenues (USD Million)
- Market Share & Analysis
- By Type- (Market Size & Forecast 2019-2030, (USD Million)
- By End User- (Market Size & Forecast 2019-2030, (USD Million)
- Market Size & Analysis
- Italy Device-as-a-Service (DaaS) Market Analysis, 2019-2030
- Market Size & Analysis
- By Revenues (USD Million)
- Market Share & Analysis
- By Type- (Market Size & Forecast 2019-2030, (USD Million)
- By End User- (Market Size & Forecast 2019-2030, (USD Million)
- Market Size & Analysis
- Spain Device-as-a-Service (DaaS) Market Analysis, 2019-2030
- Market Size & Analysis
- By Revenues (USD Million)
- Market Share & Analysis
- By Type- (Market Size & Forecast 2019-2030, (USD Million)
- By End User- (Market Size & Forecast 2019-2030, (USD Million)
- Market Size & Analysis
- Market Size & Analysis
- The Middle East & Africa Device-as-a-Service (DaaS) Market Analysis, 2019-2030
- Market Size & Analysis
- By Revenues (USD Million)
- Market Share & Analysis
- By Type- (Market Size & Forecast 2019-2030, (USD Million)
- By Enterprise Size- (Market Size & Forecast 2019-2030, (USD Million)
- By End User- (Market Size & Forecast 2019-2030, (USD Million)
- By Country
- The UAE
- Saudi Arabia
- South Africa
- Rest of the Middle East & Africa
- The UAE Device-as-a-Service (DaaS) Market Analysis, 2019-2030
- Market Size & Analysis
- By Revenues (USD Million)
- Market Share & Analysis
- By Type- (Market Size & Forecast 2019-2030, (USD Million)
- By End User- (Market Size & Forecast 2019-2030, (USD Million)
- Market Size & Analysis
- Saudi Arabia Device-as-a-Service (DaaS) Market Analysis, 2019-2030
- Market Size & Analysis
- By Revenues (USD Million)
- Market Share & Analysis
- By Type- (Market Size & Forecast 2019-2030, (USD Million)
- By End User- (Market Size & Forecast 2019-2030, (USD Million)
- Market Size & Analysis
- South Africa Device-as-a-Service (DaaS) Market Analysis, 2019-2030
- Market Size & Analysis
- By Revenues (USD Million)
- Market Share & Analysis
- By Type- (Market Size & Forecast 2019-2030, (USD Million)
- By End User- (Market Size & Forecast 2019-2030, (USD Million)
- Market Size & Analysis
- Market Size & Analysis
- Asia Pacific Device-as-a-Service (DaaS) Market Analysis, 2019-2030
- Market Size & Analysis
- By Revenues (USD Million)
- Market Share & Analysis
- By Type- (Market Size & Forecast 2019-2030, (USD Million)
- By Enterprise Size- (Market Size & Forecast 2019-2030, (USD Million)
- By End User- (Market Size & Forecast 2019-2030, (USD Million)
- By Country
- China
- India
- Japan
- Australia
- South Korea
- Southeast Asia
- Rest of Asia-Pacific
- China Device-as-a-Service (DaaS) Market Analysis, 2019-2030
- Market Size & Analysis
- By Revenues (USD Million)
- Market Share & Analysis
- By Type- (Market Size & Forecast 2019-2030, (USD Million)
- By End User- (Market Size & Forecast 2019-2030, (USD Million)
- Market Size & Analysis
- India Device-as-a-Service (DaaS) Market Analysis, 2019-2030
- Market Size & Analysis
- By Revenues (USD Million)
- Market Share & Analysis
- By Type- (Market Size & Forecast 2019-2030, (USD Million)
- By End User- (Market Size & Forecast 2019-2030, (USD Million)
- Market Size & Analysis
- Japan Device-as-a-Service (DaaS) Market Analysis, 2019-2030
- Market Size & Analysis
- By Revenues (USD Million)
- Market Share & Analysis
- By Type- (Market Size & Forecast 2019-2030, (USD Million)
- By End User- (Market Size & Forecast 2019-2030, (USD Million)
- Market Size & Analysis
- Australia Device-as-a-Service (DaaS) Market Analysis, 2019-2030
- Market Size & Analysis
- By Revenues (USD Million)
- Market Share & Analysis
- By Type- (Market Size & Forecast 2019-2030, (USD Million)
- By End User- (Market Size & Forecast 2019-2030, (USD Million)
- Market Size & Analysis
- South Korea Device-as-a-Service (DaaS) Market Analysis, 2019-2030
- Market Size & Analysis
- By Revenues (USD Million)
- Market Share & Analysis
- By Type- (Market Size & Forecast 2019-2030, (USD Million)
- By End User- (Market Size & Forecast 2019-2030, (USD Million)
- Market Size & Analysis
- Southeast Asia Device-as-a-Service (DaaS) Market Analysis, 2019-2030
- Market Size & Analysis
- By Revenues (USD Million)
- Market Share & Analysis
- By Type- (Market Size & Forecast 2019-2030, (USD Million)
- By End User- (Market Size & Forecast 2019-2030, (USD Million)
- Market Size & Analysis
- Market Size & Analysis
- Global Device-as-a-Service (DaaS) Market Key Strategic Imperatives for Success & Growth
- Global Device-as-a-Service (DaaS) Market Competition Outlook
- Company Profiles
- Lenovo
- Business Description
- Product Portfolio
- Strategic Alliances or Partnerships
- Recent Developments
- Financial Details
- Others
- Hewlett Packard
- Business Description
- Product Portfolio
- Strategic Alliances or Partnerships
- Recent Developments
- Financial Details
- Others
- CompuCom
- Business Description
- Product Portfolio
- Strategic Alliances or Partnerships
- Recent Developments
- Financial Details
- Others
- Citrix
- Business Description
- Product Portfolio
- Strategic Alliances or Partnerships
- Recent Developments
- Financial Details
- Others
- Dell Technologies
- Business Description
- Product Portfolio
- Strategic Alliances or Partnerships
- Recent Developments
- Financial Details
- Others
- Microsoft Corporation
- Business Description
- Product Portfolio
- Strategic Alliances or Partnerships
- Recent Developments
- Financial Details
- Others
- Amazon Web Services
- Business Description
- Product Portfolio
- Strategic Alliances or Partnerships
- Recent Developments
- Financial Details
- Others
- HCL
- Business Description
- Product Portfolio
- Strategic Alliances or Partnerships
- Recent Developments
- Financial Details
- Others
- Cloudalize
- Business Description
- Product Portfolio
- Strategic Alliances or Partnerships
- Recent Developments
- Financial Details
- Others
- Accenture
- Business Description
- Product Portfolio
- Strategic Alliances or Partnerships
- Recent Developments
- Financial Details
- Others
- Yorktel
- Business Description
- Product Portfolio
- Strategic Alliances or Partnerships
- Recent Developments
- Financial Details
- Others
- CDW
- Business Description
- Product Portfolio
- Strategic Alliances or Partnerships
- Recent Developments
- Financial Details
- Others
- Others
- Lenovo
- Company Profiles
- Disclaimer
MarkNtel Advisors follows a robust and iterative research methodology designed to ensure maximum accuracy and minimize deviation in market estimates and forecasts. Our approach combines both bottom-up and top-down techniques to effectively segment and quantify various aspects of the market. A consistent feature across all our research reports is data triangulation, which examines the market from three distinct perspectives to validate findings. Key components of our research process include:
1. Scope & Research Design At the outset, MarkNtel Advisors define the research objectives and formulate pertinent questions. This phase involves determining the type of research—qualitative or quantitative—and designing a methodology that outlines data collection methods, target demographics, and analytical tools. They also establish timelines and budgets to ensure the research aligns with client goals.
2. Sample Selection and Data Collection In this stage, the firm identifies the target audience and determines the appropriate sample size to ensure representativeness. They employ various sampling methods, such as random or stratified sampling, based on the research objectives. Data collection is carried out using tools like surveys, interviews, and observations, ensuring the gathered data is reliable and relevant.
3. Data Analysis and Validation Once data is collected, MarkNtel Advisors undertake a rigorous analysis process. This includes cleaning the data to remove inconsistencies, employing statistical software for quantitative analysis, and thematic analysis for qualitative data. Validation steps are taken to ensure the accuracy and reliability of the findings, minimizing biases and errors.

4. Data Forecast and FinalizationThe final phase involves forecasting future market trends based on the analyzed data. MarkNtel Advisors utilize predictive modeling and time series analysis to anticipate market behaviors. The insights are then compiled into comprehensive reports, featuring visual aids like charts and graphs, and include strategic recommendations to inform client decision-making
FILL THE FORM TO INQUIRE BEFORE BUYING THIS REPORT
We offer flexible licensing options to cater to varying organizational needs. Choose the pricing pack that best suits your requirements:
Buy Now