
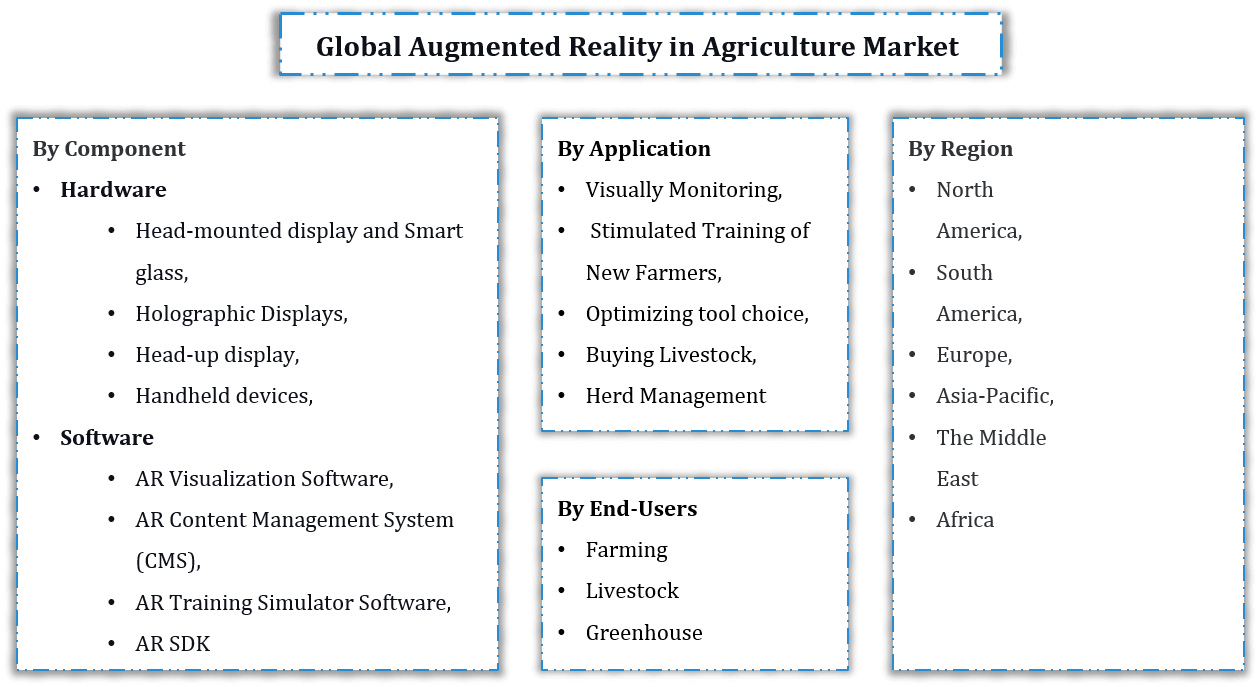
Global Augmented Reality in Agriculture Market Report - By Component (Hardware [Head-mounted display and Smart glass, Holographic Displays, Head-up display, Handheld devices], Soft......ware [AR Visualization Software, AR Content Management System {CMS}, AR Training Simulator Software, AR SDK]), By End-User (Farming, Livestock, Greenhouse), By Application (Visually Monitoring, Stimulated Training of New Farmers, Optimizing tool choice, Buying Livestock, Herd Management), and Others Read more
- Environment
- Sep 2024
- 243
- PDF, Excel, PPT
Market Definition
Augmented reality (AR) in agriculture refers to the usage of computer-generated sensory information, such as visuals, sounds, or other data, to enhance the real-world agricultural environment. It blends digital information with the physical world to provide farmers, agronomists, and other stakeholders with valuable insights, guidance, and decision support in various agricultural tasks & processes.
Market Insights & Analysis: Global Augmented Reality in Agriculture Market (2024-30):
The Global Augmented Reality in Agriculture Market is estimated to grow at a CAGR of around 50.2% during the forecast period, i.e., 2024-30. Augmented reality (AR) is increasingly being adopted as a transformative technology in the agricultural sector. It provides farmers with real-time, data-driven insights & visual overlays, hence revolutionizing precision farming practices.
The technology offers valuable information on soil conditions, moisture levels, crop health, and more, enabling farmers to make precise decisions regarding planting, irrigation, and harvesting. As a result, it enhances operational efficiency and contributes to increased crop yields & resource optimization. Moreover, as AR in the agriculture sector is gaining momentum, various leading companies are creating awareness among consumers & farmers to adopt this technology in their routine farming technology. For instance:
- In 2023, Balenciaga launched an augmented reality experience to raise awareness about ecological farming & biodiversity.
| Report Coverage | Details |
|---|---|
| Historical Years | 2019-22 |
|
Base Years
|
2023
|
|
Forecast Years
|
2024-30
|
| CAGR (2024-30) | 50.2% |
| Leading Region | North America |
| Top Key Players | Nedap CowControl, Vaderstad, Yeppar, Amazonen-Werke, Kuhn, Fendt, Claas-Group, Massey Ferguson |
| Key Report Highlights |
|
*Boost strategic growth with in-depth market analysis - Get a free sample preview today!
Hence, these awareness programs by the companies & the government to expand the usage of AR technology in agriculture to improve the production & quality of crops would raise the demand for these solutions across the globe. Also, the integration of augmented reality tools with routine farming would aid in creating an opportunistic arena for the technology providers, thus enhancing the Augmented Reality in Agriculture Market size in the future years.
Global Augmented Reality in Agriculture Market Driver:
Rising Global Population to Spur the Adoption of Technological Advancements in Agriculture – The burgeoning population worldwide is increasing the pressure on the global food supply & investments for agricultural advancements to bring the most out of the farming industry. For instance, according to the United Nations, the global population reached approximately 8 billion in 2022, up from 7.8 billion in 2021. This rapid population growth has amplified the demand for agricultural production. Therefore, to suffice this emerging need, farmers are increasingly turning to technology to enhance farming practices, boost yields, and reduce food wastage.
These efforts are crucial for meeting consumer demands & achieving production targets, leading to the usage of this technology in the agriculture industry, further driving the Augmented Reality in Agriculture Market in the ensuing years as well.
Global Augmented Reality in Agriculture Market Research Report (2024-2030) - Table of Contents
- Introduction
- Product Definition
- Research Process
- Assumptions
- Market Segmentation
- Preface
- Executive Summary
- Impact of COVID-19 on Global Augmented Reality in Agriculture Market
- Global Augmented Reality in Agriculture Market Trends & Insights
- Global Augmented Reality in Agriculture Market Dynamics
- Growth Drivers
- Challenges
- Impact Analysis
- Global Augmented Reality in Agriculture Market Hotspot & Opportunities
- Global Augmented Reality in Agriculture Market Regulations and Policies
- Global Augmented Reality in Agriculture Market Consumer Behavior Analysis
- Consumer Trends and Preferences
- Factors Affecting Buying Decision
- Brand Preference
- Global Augmented Reality in Agriculture Market Outlook, 2019-2030F
- Market Size & Analysis
- Market Revenue (USD Million)
- Market Share & Analysis
- By Component
- Hardware
- Head mounted display and Smart glass
- Holographic Displays
- Head up display
- Hand held devices (Smart phones etc.)
- Software
- AR Visualization Software
- AR Content Management System (CMS)
- AR Training Simulator Software
- AR SDK
- Hardware
- By End User
- Farming
- Livestock
- Greenhouse
- By Application
- Visually Monitoring
- Stimulated Training of New Farmers
- Optimizing tool choice
- Buying Livestock
- Herd Management
- By Region
- North America
- South America
- Europe
- Asia Pacific
- Middle East and Africa
- By Competitors
- Competition Characteristics
- Market Share & Analysis
- Competitive Metrix
- By Component
- Market Size & Analysis
- North America Augmented Reality in Agriculture Market Outlook, 2019-2030F
- Market Size & Analysis
- Market Revenue (USD Million)
- Market Share & Analysis
- By Component
- By End User
- By Application
- By Country
- The US
- Canada
- The US Augmented Reality in Agriculture Market Outlook, 2019-2030F
- Market Size & Analysis
- Market Revenue (USD Million)
- Market Share & Analysis
- By Component
- Market Size & Analysis
- Canada Augmented Reality in Agriculture Market Outlook, 2019-2030F
- Market Size & Analysis
- Market Revenue (USD Million)
- Market Share & Analysis
- By Component
- Market Size & Analysis
- Market Size & Analysis
- South America Augmented Reality in Agriculture Market Outlook, 2019-2030F
- Market Size & Analysis
- Market Revenue (USD Million)
- Market Share & Analysis
- By Component
- By End User
- By Application
- By Country
- Brazil
- Others
- Brazil Augmented Reality in Agriculture Market Outlook, 2019-2030F
- Market Size & Analysis
- Market Revenue (USD Million)
- Market Share & Analysis
- By Component
- Market Size & Analysis
- Market Size & Analysis
- Europe Augmented Reality in Agriculture Market Outlook, 2019-2030F
- Market Size & Analysis
- Market Revenue (USD Million)
- Market Share & Analysis
- By Component
- By End User
- By Application
- By Country
- Germany
- The UK
- France
- Others
- Germany Augmented Reality in Agriculture Market Outlook, 2019-2030F
- Market Size & Analysis
- Market Revenue (USD Million)
- Market Share & Analysis
- By Component
- Market Size & Analysis
- The UK Augmented Reality in Agriculture Market Outlook, 2019-2030F
- Market Size & Analysis
- Market Revenue (USD Million)
- Market Share & Analysis
- By Component
- Market Size & Analysis
- France Augmented Reality in Agriculture Market Outlook, 2019-2030F
- Market Size & Analysis
- Market Revenue (USD Million)
- Market Share & Analysis
- By Component
- Market Size & Analysis
- Market Size & Analysis
- Asia Pacific Augmented Reality in Agriculture Market Outlook, 2019-2030F
- Market Size & Analysis
- Market Revenue (USD Million)
- Market Share & Analysis
- By Component
- By Component
- By End User
- By Application
- By Country
- China
- India
- Japan
- South Korea
- Others
- China Augmented Reality in Agriculture Market Outlook, 2019-2030F
- Market Size & Analysis
- Market Revenue (USD Million)
- Market Share & Analysis
- By Component
- Market Size & Analysis
- India Augmented Reality in Agriculture Market Outlook, 2019-2030F
- Market Size & Analysis
- Market Revenue (USD Million)
- Market Share & Analysis
- By Component
- Market Size & Analysis
- Japan Augmented Reality in Agriculture Market Outlook, 2019-2030F
- Market Size & Analysis
- Market Revenue (USD Million)
- Market Share & Analysis
- By Component
- Market Size & Analysis
- South Korea Augmented Reality in Agriculture Market Outlook, 2019-2030F
- Market Size & Analysis
- Market Revenue (USD Million)
- Market Share & Analysis
- By Component
- Market Size & Analysis
- Market Size & Analysis
- Middle East & Africa Augmented Reality in Agriculture Market Outlook, 2019-2030F
- Market Size & Analysis
- Market Revenue (USD Million)
- Market Share & Analysis
- By Component
- By End User
- By Application
- By Country
- GCC
- South Africa
- Others
- GCC Augmented Reality in Agriculture Market Outlook, 2019-2030F
- Market Size & Analysis
- Market Revenue (USD Million)
- Market Share & Analysis
- By Component
- Market Size & Analysis
- South Africa Augmented Reality in Agriculture Market Outlook, 2019-2030F
- Market Size & Analysis
- Market Revenue (USD Million)
- Market Share & Analysis
- By Component
- Market Size & Analysis
- Market Size & Analysis
- Key Strategic Imperatives for Success and Growth
- Competition Outlook (Whichever Applicable)
- Competition Matrix
- Target Markets
- Research & Development
- Collaborations & Strategic Alliances
- Key Business Expansion Initiatives
- Business Restructuring – Mergers, Acquisitions, JVs
- Strategic Initiatives
- Company Profiles (Business Description, Product Categories, Market Focused Product Category, Business Segments, Market Focused Business Segment, Financials, Strategic Alliances/ Partnerships, Future Plans)
- Nedap CowControl
- Vaderstad
- Yeppar
- Amazonen-Werke
- Kuhn
- Fendt
- Claas-Group
- Massey Ferguson
- Competition Matrix
- Disclaimer
MarkNtel Advisors follows a robust and iterative research methodology designed to ensure maximum accuracy and minimize deviation in market estimates and forecasts. Our approach combines both bottom-up and top-down techniques to effectively segment and quantify various aspects of the market. A consistent feature across all our research reports is data triangulation, which examines the market from three distinct perspectives to validate findings. Key components of our research process include:
1. Scope & Research Design At the outset, MarkNtel Advisors define the research objectives and formulate pertinent questions. This phase involves determining the type of research—qualitative or quantitative—and designing a methodology that outlines data collection methods, target demographics, and analytical tools. They also establish timelines and budgets to ensure the research aligns with client goals.
2. Sample Selection and Data Collection In this stage, the firm identifies the target audience and determines the appropriate sample size to ensure representativeness. They employ various sampling methods, such as random or stratified sampling, based on the research objectives. Data collection is carried out using tools like surveys, interviews, and observations, ensuring the gathered data is reliable and relevant.
3. Data Analysis and Validation Once data is collected, MarkNtel Advisors undertake a rigorous analysis process. This includes cleaning the data to remove inconsistencies, employing statistical software for quantitative analysis, and thematic analysis for qualitative data. Validation steps are taken to ensure the accuracy and reliability of the findings, minimizing biases and errors.

4. Data Forecast and FinalizationThe final phase involves forecasting future market trends based on the analyzed data. MarkNtel Advisors utilize predictive modeling and time series analysis to anticipate market behaviors. The insights are then compiled into comprehensive reports, featuring visual aids like charts and graphs, and include strategic recommendations to inform client decision-making
FILL THE FORM TO INQUIRE BEFORE BUYING THIS REPORT
We offer flexible licensing options to cater to varying organizational needs. Choose the pricing pack that best suits your requirements:
Buy Now