
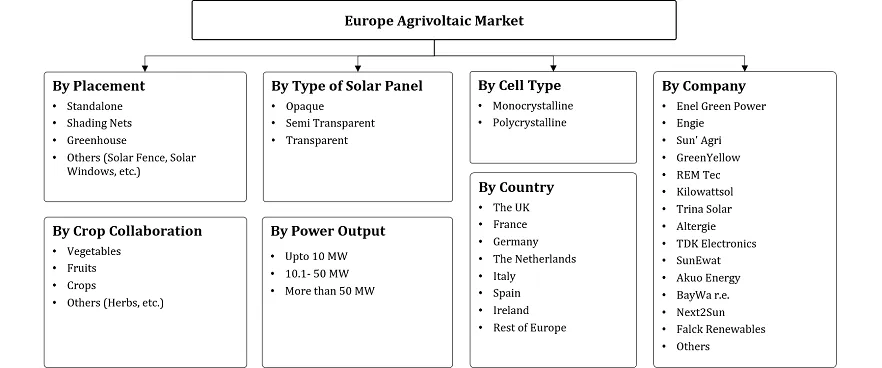
Europe Agrivoltaic Market - By Placement (Standalone, Shading Nets, Greenhouse, Others) , By Cell Type (Monocrystalline, Polycrystalline), By Crop Collaboration (Vegetables, Fruit,...... Crop, Others) , By Type of Solar Panel (Opaque, Semi-Transparent, Transparent), By Power Output (Upto 10 KWh, 10.1 to 50 KWh, More Than 50 KWh) and others Read more
- Environment
- Dec 2024
- 141
- PDF, Excel, PPT
Market Definition
Agrivoltaic is a land-use practice that involves the cultivation of crops or vegetation along with the installation of solar panels on the same piece of land. This system combines agriculture and photovoltaic systems for the production of crops as well as energy through solar panels. This system creates a synergistic relationship between crops and solar panels in which the solar system provides shade for the vegetation to reduce the water loss within the plants. By the utilization of the same land for both practices, farmers could lower their energy costs and be financially sustainable.
Market Insights & Analysis: Europe Agrivoltaic Market (2025-30):
The Europe Agrivoltaic Market size was valued at around USD 278.29 million in 2024 and is projected to reach USD 2,493.00 million by 2030. Along with this, the market is estimated to grow at a CAGR of around 45% during the forecast period 2025-30. The demand for renewable energy has seen a rapid surge in Europe in recent years due to changing climatic conditions, high temperatures, etc. As a result, European countries like Germany, France, Belgium, Italy, and others have been investing heavily in agrivoltaic systems to sustain the demand for both agricultural land and clean energy.
| Report Coverage | Details |
|---|---|
| Study Period | Historical Data: 2020-23 |
| Base Year: 2024 | |
| Forecast Period: 2025-30 | |
| CAGR (2025-2030) | 45% |
| Country Covered | The UK, France, Germany, The Netherlands, Italy, Spain, Ireland, Rest of the Europe |
| Key Companies Profiled | Enel Green Power, Engie, Sun' Agri, GreenYellow, REM Tec, Kilowattsol , Trina Solar, Altergie , TDK Electronics, SunEwat, Akuo Energy, BayWa r.e., Next2Sun, Falck Renewables, Others |
| Market Value (2024) | USD 278.29 Million |
| Market Value (2030) | USD 2,493.00 Million |
The Agrivoltaic projects are now expanding and many biggest companies in the world are investing in these projects across the region. Along with it, the European nationals collaboratively have announced its target to reach net zero emissions by 2050 and also modified its energy transition framework by 2030 by significantly reducing its fossil fuel consumption and increasing the deployment of solar and wind energy generation plants, which is further anticipated to enhance the market size in the forthcoming years. Along with it governments in Germany, France, Italy, and others are encouraging the development of large-scale Agrivoltaic projects through auctions and massive investments. For instance, in January 2021, the Energy Regulatory Commission (CRE) awarded 40 MW of Agrivoltaic projects under its innovative PV tender.
Along with it the participation of private parties is also encouraged by these countries to achieve the targets for sustainable agriculture and climate change. For instance, in 2022, the government in Italy released a new set of agrivoltaic norms, which are primarily focused on faster approval of the project and incentives the private companies. Thereby encouraging private companies to establish agrivoltaic systems for farmers, this subsequently resulted in the growth of the agrivoltaic market in the Europe.
- Market Segmentation
- Introduction
- Product Definition
- Research Process
- Assumptions
- Executive Summary
- Europe Solar Industry Outlook, By Country, 2020-2025
- Installed Capacity vs Power Generation (GW)
- Share of Solar in Europe Renewable Energy Mix
- Technological Advancements in the Solar Industry
- Government Initiatives for Future Industry Development
- Others
- Europe Agrivoltaic Market Policies, Regulations, Material Type Standards, By Country
- Financing, Grants & Funding
- Standards
- Rules and Regulations
- Europe Agrivoltaic Market Trends & Insights
- Europe Agrivoltaic Market Dynamics
- Drivers
- Challenges
- Europe Agrivoltaic Market Hotspots & Opportunities
- Europe Ongoing Agrivoltaic Projects, By Country
- Italy
- The Netherlands
- France
- Germany
- Spain
- Others
- Europe Agrivoltaic Market Outlook, 2020-2030F
- Market Size & Outlook
- Revenues (USD Million)
- By Installed Capacity (Mega Watt)
- Market Share & Outlook
- By Placement
- Standalone- Market Size & Forecast 2020-2030F, Installed Capacity (MW)
- Shading Nets- Market Size & Forecast 2020-2030F, Installed Capacity (MW)
- Greenhouse- Market Size & Forecast 2020-2030F, Installed Capacity (MW)
- Others (Solar Fence, Solar Window, etc.) - Market Size & Forecast 2020-2030F, Installed Capacity (MW)
- By Cell Type
- Monocrystalline- Market Size & Forecast 2020-2030F, Installed Capacity (MW)
- Polycrystalline- Market Size & Forecast 2020-2030F, Installed Capacity (MW)
- By Crop Collaboration
- Vegetables- Market Size & Forecast 2020-2030F, Installed Capacity (MW)
- Fruit- Market Size & Forecast 2020-2030F, Installed Capacity (MW)
- Crop- Market Size & Forecast 2020-2030F, Installed Capacity (MW)
- Others (Herbs, etc.) - Market Size & Forecast 2020-2030F, Installed Capacity (MW)
- By Type of Solar Panel
- Opaque- Market Size & Forecast 2020-2030F, Installed Capacity (MW)
- Semi-Transparent- Market Size & Forecast 2020-2030F, Installed Capacity (MW)
- Transparent
- By Power Output
- Upto 10 KWh- Market Size & Forecast 2020-2030F, Installed Capacity (MW)
- 10.1 to 50 KWh- Market Size & Forecast 2020-2030F, Installed Capacity (MW)
- More Than 50 KWh- Market Size & Forecast 2020-2030F, Installed Capacity (MW)
- By Country
- The UK
- France
- Germany
- The Netherlands
- Italy
- Spain
- Ireland
- Rest of the Europe
- By Company
- Competition Characteristics
- Market Share & Analysis
- By Placement
- Market Size & Outlook
- The UK Agrivoltaic Market Outlook, 2020-2030F
- Market Size & Outlook
- Revenues (USD Million)
- By Installed Capacity (Mega Watt)
- Market Share & Outlook
- By Placement- Market Size & Forecast 2020-2030F, Installed Capacity (MW)
- By Crop Collaboration- Market Size & Forecast 2020-2030F, Installed Capacity (MW)
- Market Size & Outlook
- France Agrivoltaic Market Outlook, 2020-2030F
- Market Size & Outlook
- Revenues (USD Million)
- By Installed Capacity (Mega Watt)
- Market Share & Outlook
- By Placement- Market Size & Forecast 2020-2030F, Installed Capacity (MW)
- By Crop Collaboration- Market Size & Forecast 2020-2030F, Installed Capacity (MW)
- Market Size & Outlook
- Germany Agrivoltaic Market Outlook, 2020-2030F
- Market Size & Outlook
- Revenues (USD Million)
- By Installed Capacity (Mega Watt)
- Market Share & Outlook
- By Placement- Market Size & Forecast 2020-2030F, Installed Capacity (MW)
- By Crop Collaboration- Market Size & Forecast 2020-2030F, Installed Capacity (MW)
- Market Size & Outlook
- The Netherlands Agrivoltaic Market Outlook, 2020-2030F
- Market Size & Outlook
- Revenues (USD Million)
- By Installed Capacity (Mega Watt)
- Market Share & Outlook
- By Placement- Market Size & Forecast 2020-2030F, Installed Capacity (MW)
- By Crop Collaboration- Market Size & Forecast 2020-2030F, Installed Capacity (MW)
- Market Size & Outlook
- Italy Agrivoltaic Market Outlook, 2020-2030F
- Market Size & Outlook
- Revenues (USD Million)
- By Installed Capacity (Mega Watt)
- Market Share & Outlook
- By Placement- Market Size & Forecast 2020-2030F, Installed Capacity (MW)
- By Crop Collaboration- Market Size & Forecast 2020-2030F, Installed Capacity (MW)
- Market Size & Outlook
- Spain Agrivoltaic Market Outlook, 2020-2030F
- Market Size & Outlook
- Revenues (USD Million)
- By Installed Capacity (Mega Watt)
- Market Share & Outlook
- By Placement- Market Size & Forecast 2020-2030F, Installed Capacity (MW)
- By Crop Collaboration- Market Size & Forecast 2020-2030F, Installed Capacity (MW)
- Market Size & Outlook
- Ireland Agrivoltaic Market Outlook, 2020-2030F
- Market Size & Outlook
- Revenues (USD Million)
- By Installed Capacity (Mega Watt)
- Market Share & Outlook
- By Placement- Market Size & Forecast 2020-2030F, Installed Capacity (MW)
- By Crop Collaboration- Market Size & Forecast 2020-2030F, Installed Capacity (MW)
- Market Size & Outlook
- Europe Agrivoltaic Market Key Strategic Imperatives for Growth & Success
- Competitive Benchmarking
- Company Profiles
- Enel Green Power
- Business Description
- Product Portfolio
- Strategic Alliances or Partnerships
- Recent Developments
- Financial Details
- Others
- Engie
- Business Description
- Product Portfolio
- Strategic Alliances or Partnerships
- Recent Developments
- Financial Details
- Others
- Sun Agri
- Business Description
- Product Portfolio
- Strategic Alliances or Partnerships
- Recent Developments
- Financial Details
- Others
- GreenYellow
- Business Description
- Product Portfolio
- Strategic Alliances or Partnerships
- Recent Developments
- Financial Details
- Others
- REM Tec
- Business Description
- Product Portfolio
- Strategic Alliances or Partnerships
- Recent Developments
- Financial Details
- Others
- Kilowattsol
- Business Description
- Product Portfolio
- Strategic Alliances or Partnerships
- Recent Developments
- Financial Details
- Others
- Trina Solar
- Business Description
- Product Portfolio
- Strategic Alliances or Partnerships
- Recent Developments
- Financial Details
- Others
- Altergie
- Business Description
- Product Portfolio
- Strategic Alliances or Partnerships
- Recent Developments
- Financial Details
- Others
- TDK Electronics
- Business Description
- Product Portfolio
- Strategic Alliances or Partnerships
- Recent Developments
- Financial Details
- Others
- SunEwat Business Description
- Product Portfolio
- Strategic Alliances or Partnerships
- Recent Developments
- Financial Details
- Others
- Akuo Energ Business Description
- Product Portfolio
- Strategic Alliances or Partnerships
- Recent Developments
- Financial Details
- Others
- Others (Next2Sun, Falick Renewables, etc.)
- Enel Green Power
- Company Profiles
- Disclaimer
MarkNtel Advisors follows a robust and iterative research methodology designed to ensure maximum accuracy and minimize deviation in market estimates and forecasts. Our approach combines both bottom-up and top-down techniques to effectively segment and quantify various aspects of the market. A consistent feature across all our research reports is data triangulation, which examines the market from three distinct perspectives to validate findings. Key components of our research process include:
1. Scope & Research Design At the outset, MarkNtel Advisors define the research objectives and formulate pertinent questions. This phase involves determining the type of research—qualitative or quantitative—and designing a methodology that outlines data collection methods, target demographics, and analytical tools. They also establish timelines and budgets to ensure the research aligns with client goals.
2. Sample Selection and Data Collection In this stage, the firm identifies the target audience and determines the appropriate sample size to ensure representativeness. They employ various sampling methods, such as random or stratified sampling, based on the research objectives. Data collection is carried out using tools like surveys, interviews, and observations, ensuring the gathered data is reliable and relevant.
3. Data Analysis and Validation Once data is collected, MarkNtel Advisors undertake a rigorous analysis process. This includes cleaning the data to remove inconsistencies, employing statistical software for quantitative analysis, and thematic analysis for qualitative data. Validation steps are taken to ensure the accuracy and reliability of the findings, minimizing biases and errors.

4. Data Forecast and FinalizationThe final phase involves forecasting future market trends based on the analyzed data. MarkNtel Advisors utilize predictive modeling and time series analysis to anticipate market behaviors. The insights are then compiled into comprehensive reports, featuring visual aids like charts and graphs, and include strategic recommendations to inform client decision-making
FILL THE FORM TO INQUIRE BEFORE BUYING THIS REPORT
We offer flexible licensing options to cater to varying organizational needs. Choose the pricing pack that best suits your requirements:
Buy Now