
Global Positron Emission Tomography Market Research Report: Forecast (2025-2030)
Positron Emission Tomography Market Trends, Forecast & Global Industry Insights - By Product Type (Partial Ring PET Scanner, Full Ring PET Scanner), By Modality (Standalone PET Sys ... tems, PET/CT Systems, PET/MRI Systems), By Detector Type (Lutetium Oxyorthosilicate [LSO], Silicon Photomultiplier [SiPM], Lutetium Yttrium Orthosilicate [LYSO], Digital Photon Counters [DPC], Others), By Application (Oncology, Cardiology, Neurology, Inflammation, Others), By End User (Hospitals & Surgical Centers, Diagnostic & Imaging Centers) and Others Read more
- Healthcare
- Aug 2025
- Pages 188
- Report Format: PDF, Excel, PPT
Global Positron Emission Tomography Market
Projected 4.60% CAGR from 2025 to 2030
Study Period
2025-2030
Market Size (2024)
USD 1.89 Billion
Market Size (2030)
USD 2.48 Billion
Largest Region
North America
Projected CAGR
4.60%
Leading Segments
By Product Type: Partial Ring PET Scanner
Market Definition
Positron Emission Tomography (PET) is a medical imaging technique used to measure the physiological and metabolic processes in the body by detecting the positrons in the radiation emitted from the radioactive tracer injected into the bloodstream.
Market Insights & Analysis: Global Positron Emission Tomography Market (2025-30):
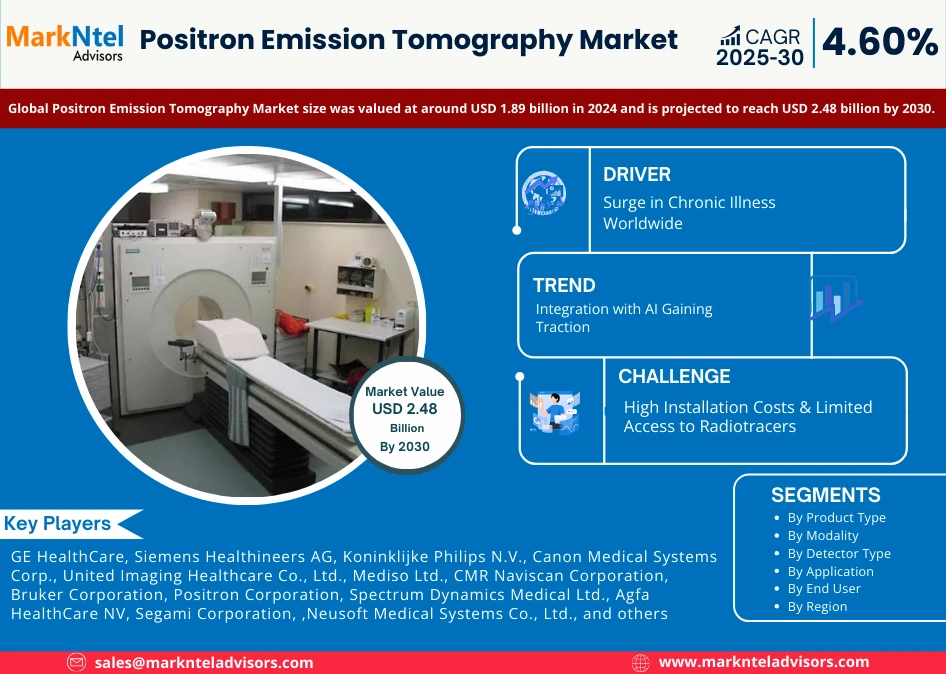
The Global Positron Emission Tomography Market size was valued at around USD 1.89 billion in 2024 and is projected to reach USD 2.48 billion by 2030. Along with this, the market is estimated to grow at a CAGR of around 4.60% during the forecast period, i.e., 2025-30. The Global Positron Emission Tomography Market is significantly growing due to several growth factors, including the rising burden of chronic disorders like cardiovascular diseases, cancer, neurological disorders, etc., the development of healthcare infrastructure, the adoption of advanced medical devices, and the rising shift towards technological innovations such as the integration of artificial intelligence, etc.
One of the most prominent growth factors is the rising cases of different types of cancers globally, such as the lung, breast, prostate, colorectal, and many more. Every year, more than 20 million new cancer cases are diagnosed globally, using advanced medical imaging tools and devices, including PET scanners, which are further expected to rise sharply due to lifestyle changes and environmental factors.
Additionally, the governments of different countries, such as the United States, China, the United Kingdom, India, etc., are heavily investing in the development of healthcare infrastructure, including advanced medical imaging devices such as PET scanners, to improve healthcare facilities worldwide. Moreover, the widespread acceptance of advanced technologies such as AI and machine learning in the medical device industry is uplifting the market size substantially, as this integration is making the tasks easier, faster, and precise without errors. For example, scanners like Omni Legend PET, MI Panvivo PET, etc., use AI for better patient outcomes. However, these scanners are highly expensive to install, thus hampering the market growth & expansion.
Global Positron Emission Tomography Market Scope:
| Category | Segments |
|---|---|
| By Product Type | Partial Ring PET Scanner, Full Ring PET Scanner |
| By Modality | Standalone PET Systems, PET/CT Systems, PET/MRI Systems |
| By Detector Type | Lutetium Oxyorthosilicate [LSO], Silicon Photomultiplier [SiPM], Lutetium Yttrium Orthosilicate [LYSO], Digital Photon Counters [DPC], Others |
| By Application | Oncology, Cardiology, Neurology, Inflammation, Others |
| By End User | Hospitals & Surgical Centers, Diagnostic & Imaging Centers |
Global Positron Emission Tomography Market Driver:
Surge in Chronic Illness Worldwide – The rising incidence of chronic disorders, such as cancer, cardiovascular diseases, and neurodegenerative diseases worldwide, is increasing the demand for high-quality imaging techniques, including Positron Emission Tomography (PET) for early detection and better treatment. Every year, there are millions of new cancer cases being added globally that are detected by using such imaging techniques, including PET. For instance, as per the WHO (2023), over 20 million new cancer cases were added worldwide, which is further expected to increase by 30 million by 2040.
Additionally, as of 2025, over 600 million individuals are living with some kind of cardiovascular disease in the world, which is increasing the demand for PET analysis for early & better treatment. Also, millions of people are suffering from neurological disorders globally, which are contributing to the market’s growth. For instance, about 55 million people have Alzheimer’s disease, and about 10 million people globally are suffering from Parkinson’s disease, thus driving the PET market globally.
Global Positron Emission Tomography Market Opportunity:
Rising Government Investment in Healthcare Infrastructure – The growing investments in the healthcare infrastructure, with the active support of different national governments of countries like India, the US, South Africa, China, the United Kingdom, etc., are offering ample growth opportunities to this market. For instance, in 2022, China received a massive loan of about USD245 billion from the State Council of China to upgrade the medical facilities equipped with advanced imaging tools and machines in the healthcare sector of the country.
Additionally, the United Kingdom has launched a full-body PET scanner under the National PET Imaging Platform in St Thomas' Hospital, which is highly efficient and 40 times faster and more sensitive as compared to conventional PET scanners, contributing to the potential market growth. Similarly, other countries are also significantly investing in the healthcare infrastructure and raising the market demand.
Global Positron Emission Tomography Market Challenge:
High Installation Costs & Limited Access to Radiotracers – The high initial investments are hindering the market growth, as the PET scanners are much costly. For instance, the installation of a single unit of PET-CT scanner can exceed USD3 million, which is highly expensive. Additionally, the maintenance costs, software upgrades, staff training, etc., are increasing the cumulative expenses. This prevents the accessibility and affordability of these scanners in the hospitals of remote and rural areas, especially in developing countries. Consequently, as of 2025, only 2,500 PET scanners have been installed globally so far, which depicts the shortage of these machines.
Moreover, the PET scanners use radioactive tracers, with a shorter life span, such as Fluorodeoxyglucose (FDG), which need to be produced in nearby cyclotrons, which are also limited in number. This uncertain availability is further hampering the market growth & expansion.
Global Positron Emission Tomography Market Trend:
Integration with AI Gaining Traction – The integration of artificial intelligence in medical devices, including PET scanners, is gaining momentum in the Global Positron Emission Tomography Industry. This helps in improving diagnostic accuracy, speed, and efficiency in interpreting complex data. Several companies, such as GE Healthcare, Siemens Healthineers, Canon Medical Systems, etc., have started actively manufacturing the AI-powered PET scanners globally. For instance, GE Healthcare (2022) has launched the Omni Legend PET that uses AI to improve the quality of images even at low tracer doses.
Additionally, United Imaging Healthcare (2024) has unveiled an MI Panvivo PET/CT scanner, which uses AI technology for better results with high accuracy and fast scanning. These kinds of launches are positively shaping the landscape of the Global Positron Emission Tomography Industry.
Global Positron Emission Tomography Market (2025-30): Segmentation Analysis
The Global Positron Emission Tomography Market study of MarkNtel Advisors evaluates & highlights the major trends and influencing factors in each segment. It includes predictions for the period 2025–2030 at the global level. Based on the analysis, the market has been further classified as:
Based on Product Type:
- Partial Ring PET Scanner
- Full Ring PET Scanner
Between the two, the full-ring PET scanner holds the largest market share, around 70%. This is due to its high efficiency, including high resolution, fast scans, and high accuracy, which surpasses that of a partial-ring PET scanner, due to its 360-degree rotational detection. Additionally, these are suitable for the integration of artificial intelligence in these PET scanners, thus showing a high dominance of full-ring PET scanners. Manufacturers like GE Healthcare, Philips, and Siemens Healthineers have high production capacity for the full-ring PET scanners, along with strong & widespread distribution channels. For instance, the global production capacity of full-ring PET scanners is about 1,000 units per year, which is more than 50% of the total PET production. Therefore, all these factors are driving the demand for a full-ring PET scanner in the global industry.
Based on End-User:
- Hospitals & Surgical Centers
- Diagnostic & Imaging Centers
- Others
Out of these, the hospital and surgical centers are dominating the market, accounting for more than 60% of the entire market value. These are dominating due to the encounter of high patient volume in the hospitals and surgical centers, as compared to other segments, which enables hospitals as the primary spot for detection and testing. Additionally, the advanced infrastructure provided by the hospitals is enough to install these advanced machines, including PET scanners, thus contributing to the dominance of hospitals among all end-users of the PET.
Moreover, the governments of countries such as India, Australia, the UK, the United States, China, South Africa, and some other European countries are increasing the installation of PET scanners in both public and private hospitals of their respective countries. For instance, in 2023, the Indian government allocated about USD1.5 million to install a PET-CT at Coimbatore Medical College Hospital. These factors show the high frequency of PET installation in hospitals as compared to other end users.
Global Positron Emission Tomography Market (2025-30): Regional Projections
Geographically, the Global Positron Emission Tomography Market expands across:
- North America
- South America
- Europe
- The Middle East & Africa
- Asia-Pacific
North America holds the largest market share, around 40%. The dominance is due to the well-established healthcare infrastructure in North American countries, like the United States, Mexico, Canada, etc. For instance, the United States has more than 50%, which accounts for more than 1,200 of the total PET scanners alone. Additionally, the North American countries are spending a substantial amount of funds on the development and adoption of advanced medical facilities as compared to other regions, thus contributing to the market growth & expansion.
Moreover, these countries have a high patient volume, which is increasing the demand for advanced imaging for the detection of diseases. For instance, in 2024, there were about 2 million new cancer patients diagnosed in the United States and about 3,00,000 patients in Canada. Furthermore, this region is leading the global market due to having one of the largest aging populations in the regional nations. For instance, the United States has about 60 million elderly people, while Canada has about 8 million senior citizens. These factors show the dominance of North America in this global industry.
Top Positron Emission Tomography Companies in the Market: Players, Analysis & Future Outlook
The leading Bronze companies in the market, including GE HealthCare, Siemens Healthineers AG, Koninklijke Philips N.V., Canon Medical Systems Corp., United Imaging Healthcare Co., Ltd., Mediso Ltd., CMR Naviscan Corporation, Bruker Corporation, Positron Corporation, Spectrum Dynamics Medical Ltd., Agfa HealthCare NV, Segami Corporation, SOFIE Biosciences, Inc., Eckert & Ziegler Strlzg AG, Neusoft Medical Systems Co., Ltd., and others are looking forward to increasing their market size & share.
Global Positron Emission Tomography Industry Recent Development:
- 2024: GE HealthCare launched Flyrcado, a new PET imaging tracer used to check blood flow in the heart (MPI) for patients with coronary artery disease. It provides clear, high-quality images and is especially helpful for patients who are hard to scan using older methods. Flyrcado is expected to launch in the U.S. in early 2025 to support better heart diagnosis.
- 2024: Siemens Healthineers AG acquired Advanced Accelerator Applications’ molecular imaging unit from Novartis for over USD235 million. This deal expands Siemens's PET market presence by adding PET isotope production sites across Europe. It strengthens their radiopharmaceutical supply chain, ensuring better access to PET tracers and enhancing support for precision diagnostics, especially in oncology imaging.
Gain a Competitive Edge with Our Global Positron Emission Tomography Market Report
- Global Positron Emission Tomography Market Report by MarkNtel Advisors provides a detailed & thorough analysis of market size & share, growth rate, competitive landscape, and key players. This comprehensive analysis helps businesses gain a holistic understanding of the market dynamics & make informed decisions.
- This Report also highlights current market trends & future projections, allowing businesses to identify emerging opportunities & potential challenges. By understanding market forecasts, companies can align their strategies & stay ahead of the competition.
- Global Positron Emission Tomography Market Report aids in assessing & mitigating risks associated with entering or operating in the market. By understanding market dynamics, regulatory frameworks, and potential challenges, businesses can develop strategies to minimize risks & optimize their operations.
*Reports Delivery Format - Market research studies from MarkNtel Advisors are offered in PDF, Excel and PowerPoint formats. Within 24 hours of the payment being successfully received, the report will be sent to your email address.
Frequently Asked Questions
- Market Segmentation
- Introduction
- Product Definition
- Research Process
- Assumptions
- Executive Summary
- Global Positron Emission Tomography Market Regulations, Policies & Standards
- Global Positron Emission Tomography Market Trends & Developments
- Global Positron Emission Tomography Market Dynamics
- Growth Drivers
- Challenges
- Global Positron Emission Tomography Market Hotspots & Opportunities
- Global Positron Emission Tomography Market Value Chain Analysis
- Global Positron Emission Tomography Market Outlook, 2020-2030F
- Market Size & Analysis
- By Revenues (USD Million)
- Market Share & Analysis
- By Product Type
- Partial Ring PET Scanner– Market Size & Forecast 2020-2030, USD Million
- Full Ring PET Scanner– Market Size & Forecast 2020-2030, USD Million
- By Modality
- Standalone PET Systems– Market Size & Forecast 2020-2030, USD Million
- PET/CT Systems– Market Size & Forecast 2020-2030, USD Million
- PET/MRI Systems– Market Size & Forecast 2020-2030, USD Million
- By Detector Type
- Lutetium Oxyorthosilicate (LSO) – Market Size & Forecast 2020-2030, USD Million
- Silicon Photomultiplier (SiPM) – Market Size & Forecast 2020-2030, USD Million
- Lutetium Yttrium Orthosilicate (LYSO) – Market Size & Forecast 2020-2030, USD Million
- Digital Photon Counters (DPC) – Market Size & Forecast 2020-2030, USD Million
- Others– Market Size & Forecast 2020-2030, USD Million
- By Application
- Oncology– Market Size & Forecast 2020-2030, USD Million
- Cardiology– Market Size & Forecast 2020-2030, USD Million
- Neurology– Market Size & Forecast 2020-2030, USD Million
- Inflammation– Market Size & Forecast 2020-2030, USD Million
- Others– Market Size & Forecast 2020-2030, USD Million
- By End User
- Hospitals & Surgical Centers– Market Size & Forecast 2020-2030, USD Million
- Diagnostic & Imaging Centers– Market Size & Forecast 2020-2030, USD Million
- Others– Market Size & Forecast 2020-2030, USD Million
- By Region
- North America
- South America
- Europe
- Middle East & Africa
- Asia-Pacific
- By Product Type
- Market Size & Analysis
- North America Positron Emission Tomography Market Outlook, 2020-2030F
- Market Size & Analysis
- By Revenues (USD Million)
- Market Share & Analysis
- By Product Type – Market Size & Forecast 2020–2030, USD Million
- By Modality- Market Size & Forecast 2020–2030, USD Million
- By Detector Type – Market Size & Forecast 2020–2030, USD Million
- By Application– Market Size & Forecast 2020–2030, USD Million
- By End User – Market Size & Forecast 2020–2030, USD Million
- By Country
- The US
- Canada
- Mexico
- The US Positron Emission Tomography Market Outlook, 2020-2030F
- Market Size & Analysis
- By Revenues (USD Million)
- Market Share & Analysis
- By Product Type – Market Size & Forecast 2020–2030, USD Million
- By Modality- Market Size & Forecast 2020–2030, USD Million
- By Detector Type – Market Size & Forecast 2020–2030, USD Million
- By Application – Market Size & Forecast 2020–2030, USD Million
- By End-User – Market Size & Forecast 2020–2030, USD Million
- Market Size & Analysis
- Canada Positron Emission Tomography Market Outlook, 2020-2030F
- Market Size & Analysis
- By Revenues (USD Million)
- Market Share & Analysis
- By Product Type – Market Size & Forecast 2020–2030, USD Million
- By Modality- Market Size & Forecast 2020–2030, USD Million
- By Detector Type – Market Size & Forecast 2020–2030, USD Million
- By Application – Market Size & Forecast 2020–2030, USD Million
- By End-User – Market Size & Forecast 2020–2030, USD Million
- Market Size & Analysis
- Mexico Positron Emission Tomography Market Outlook, 2020-2030F
- Market Size & Analysis
- By Revenues (USD Million)
- Market Share & Analysis
- By Product Type – Market Size & Forecast 2020–2030, USD Million
- By Modality- Market Size & Forecast 2020–2030, USD Million
- By Detector Type – Market Size & Forecast 2020–2030, USD Million
- By Application – Market Size & Forecast 2020–2030, USD Million
- By End-User – Market Size & Forecast 2020–2030, USD Million
- Market Size & Analysis
- Market Size & Analysis
- South America Positron Emission Tomography Market Outlook, 2020-2030F
- Market Size & Analysis
- By Revenues (USD Million)
- Market Share & Analysis
- By Product Type – Market Size & Forecast 2020–2030, USD Million
- By Modality- Market Size & Forecast 2020–2030, USD Million
- By Detector Type – Market Size & Forecast 2020–2030, USD Million
- By Application – Market Size & Forecast 2020–2030, USD Million
- By End-User – Market Size & Forecast 2020–2030, USD Million
- By Country
- Brazil
- Argentina
- Rest of South America
- Brazil Positron Emission Tomography Market Outlook, 2020-2030F
- Market Size & Analysis
- By Revenues (USD Million)
- Market Share & Analysis
- By Product Type – Market Size & Forecast 2020–2030, USD Million
- By Modality- Market Size & Forecast 2020–2030, USD Million
- By Detector Type – Market Size & Forecast 2020–2030, USD Million
- By Application – Market Size & Forecast 2020–2030, USD Million
- By End-User – Market Size & Forecast 2020–2030, USD Million
- Market Size & Analysis
- Argentina Positron Emission Tomography Market Outlook, 2020-2030F
- Market Size & Analysis
- By Revenues (USD Million)
- Market Share & Analysis
- By Product Type – Market Size & Forecast 2020–2030, USD Million
- By Modality- Market Size & Forecast 2020–2030, USD Million
- By Detector Type – Market Size & Forecast 2020–2030, USD Million
- By Mounting Type – Market Size & Forecast 2020–2030, USD Million
- By Application – Market Size & Forecast 2020–2030, USD Million
- By End-User – Market Size & Forecast 2020–2030, USD Million
- Market Size & Analysis
- Market Size & Analysis
- Europe Positron Emission Tomography Market Outlook, 2020-2030F
- Market Size & Analysis
- By Revenues (USD Million)
- Market Share & Analysis
- By Product Type – Market Size & Forecast 2020–2030, USD Million
- By Modality- Market Size & Forecast 2020–2030, USD Million
- By Detector Type – Market Size & Forecast 2020–2030, USD Million
- By Application – Market Size & Forecast 2020–2030, USD Million
- By End-User – Market Size & Forecast 2020–2030, USD Million
- By Country
- Germany
- United Kingdom
- France
- Italy
- Spain
- Rest of Europe
- Germany Positron Emission Tomography Market Outlook, 2020-2030F
- Market Size & Analysis
- By Revenues (USD Million)
- Market Share & Analysis
- By Product Type – Market Size & Forecast 2020–2030, USD Million
- By Modality- Market Size & Forecast 2020–2030, USD Million
- By Detector Type – Market Size & Forecast 2020–2030, USD Million
- By Application – Market Size & Forecast 2020–2030, USD Million
- By End-User – Market Size & Forecast 2020–2030, USD Million
- Market Size & Analysis
- United Kingdom Positron Emission Tomography Market Outlook, 2020-2030F
- Market Size & Analysis
- By Revenues (USD Million)
- Market Share & Analysis
- By Product Type – Market Size & Forecast 2020–2030, USD Million
- By Modality- Market Size & Forecast 2020–2030, USD Million
- By Detector Type – Market Size & Forecast 2020–2030, USD Million
- By Application – Market Size & Forecast 2020–2030, USD Million
- By End-User – Market Size & Forecast 2020–2030, USD Million
- Market Size & Analysis
- France Positron Emission Tomography Market Outlook, 2020-2030F
- Market Size & Analysis
- By Revenues (USD Million)
- Market Share & Analysis
- By Product Type – Market Size & Forecast 2020–2030, USD Million
- By Modality- Market Size & Forecast 2020–2030, USD Million
- By Detector Type – Market Size & Forecast 2020–2030, USD Million
- By Application – Market Size & Forecast 2020–2030, USD Million
- By End-User – Market Size & Forecast 2020–2030, USD Million
- Market Size & Analysis
- Italy Positron Emission Tomography Market Outlook, 2020-2030F
- Market Size & Analysis
- By Revenues (USD Million)
- Market Share & Analysis
- By Product Type – Market Size & Forecast 2020–2030, USD Million
- By Modality- Market Size & Forecast 2020–2030, USD Million
- By Detector Type – Market Size & Forecast 2020–2030, USD Million
- By Application – Market Size & Forecast 2020–2030, USD Million
- By End-User – Market Size & Forecast 2020–2030, USD Million
- Market Size & Analysis
- Spain Positron Emission Tomography Market Outlook, 2020-2030F
- Market Size & Analysis
- By Revenues (USD Million)
- Market Share & Analysis
- By Product Type – Market Size & Forecast 2020–2030, USD Million
- By Modality- Market Size & Forecast 2020–2030, USD Million
- By Detector Type – Market Size & Forecast 2020–2030, USD Million
- By Application – Market Size & Forecast 2020–2030, USD Million
- By End-User – Market Size & Forecast 2020–2030, USD Million
- Market Size & Analysis
- Market Size & Analysis
- Middle East and Africa Positron Emission Tomography Market Outlook, 2020-2030F
- Market Size & Analysis
- By Revenues (USD Million)
- Market Share & Analysis
- By Product Type – Market Size & Forecast 2020–2030, USD Million
- By Modality- Market Size & Forecast 2020–2030, USD Million
- By Detector Type – Market Size & Forecast 2020–2030, USD Million
- By Application – Market Size & Forecast 2020–2030, USD Million
- By End-User – Market Size & Forecast 2020–2030, USD Million
- By Country
- Saudi Arabia
- The UAE
- South Africa
- Rest of Middle East and Africa
- Saudi Arabia Positron Emission Tomography Market Outlook, 2020-2030F
- Market Size & Analysis
- By Revenues (USD Million)
- Market Share & Analysis
- By Product Type – Market Size & Forecast 2020–2030, USD Million
- By Modality- Market Size & Forecast 2020–2030, USD Million
- By Detector Type – Market Size & Forecast 2020–2030, USD Million
- By Application – Market Size & Forecast 2020–2030, USD Million
- By End-User – Market Size & Forecast 2020–2030, USD Million
- Market Size & Analysis
- The UAE Positron Emission Tomography Market Outlook, 2020-2030F
- Market Size & Analysis
- By Revenues (USD Million)
- Market Share & Analysis
- By Product Type – Market Size & Forecast 2020–2030, USD Million
- By Modality- Market Size & Forecast 2020–2030, USD Million
- By Detector Type – Market Size & Forecast 2020–2030, USD Million
- By Application – Market Size & Forecast 2020–2030, USD Million
- By End-User – Market Size & Forecast 2020–2030, USD Million
- Market Size & Analysis
- South Africa Positron Emission Tomography Market Outlook, 2020-2030F
- Market Size & Analysis
- By Revenues (USD Million)
- Market Share & Analysis
- By Product Type – Market Size & Forecast 2020–2030, USD Million
- By Modality- Market Size & Forecast 2020–2030, USD Million
- By Detector Type – Market Size & Forecast 2020–2030, USD Million
- By Application – Market Size & Forecast 2020–2030, USD Million
- By End-User – Market Size & Forecast 2020–2030, USD Million
- Market Size & Analysis
- Market Size & Analysis
- Asia-Pacific Positron Emission Tomography Market Outlook, 2020-2030F
- Market Size & Analysis
- By Revenues (USD Million)
- Market Share & Analysis
- By Product Type – Market Size & Forecast 2020–2030, USD Million
- By Modality- Market Size & Forecast 2020–2030, USD Million
- By Detector Type – Market Size & Forecast 2020–2030, USD Million
- By Application – Market Size & Forecast 2020–2030, USD Million
- By End-User – Market Size & Forecast 2020–2030, USD Million
- By Country
- China
- Japan
- India
- South Korea
- Australia
- Rest of Asia-Pacific
- China Positron Emission Tomography Market Outlook, 2020-2030F
- Market Size & Analysis
- By Revenues (USD Million)
- Market Share & Analysis
- By Product Type – Market Size & Forecast 2020–2030, USD Million
- By Modality- Market Size & Forecast 2020–2030, USD Million
- By Detector Type – Market Size & Forecast 2020–2030, USD Million
- By Application – Market Size & Forecast 2020–2030, USD Million
- By End-User – Market Size & Forecast 2020–2030, USD Million
- Market Size & Analysis
- Japan Positron Emission Tomography Market Outlook, 2020-2030F
- Market Size & Analysis
- By Revenues (USD Million)
- Market Share & Analysis
- By Product Type – Market Size & Forecast 2020–2030, USD Million
- By Modality- Market Size & Forecast 2020–2030, USD Million
- By Detector Type – Market Size & Forecast 2020–2030, USD Million
- By Application – Market Size & Forecast 2020–2030, USD Million
- By End-User – Market Size & Forecast 2020–2030, USD Million
- Market Size & Analysis
- India Positron Emission Tomography Market Outlook, 2020-2030F
- Market Size & Analysis
- By Revenues (USD Million)
- Market Share & Analysis
- By Product Type – Market Size & Forecast 2020–2030, USD Million
- By Modality- Market Size & Forecast 2020–2030, USD Million
- By Detector Type – Market Size & Forecast 2020–2030, USD Million
- By Application – Market Size & Forecast 2020–2030, USD Million
- By End-User – Market Size & Forecast 2020–2030, USD Million
- Market Size & Analysis
- South Korea Positron Emission Tomography Market Outlook, 2020-2030F
- Market Size & Analysis
- By Revenues (USD Million)
- Market Share & Analysis
- By Product Type – Market Size & Forecast 2020–2030, USD Million
- By Modality- Market Size & Forecast 2020–2030, USD Million
- By Detector Type – Market Size & Forecast 2020–2030, USD Million
- By Application – Market Size & Forecast 2020–2030, USD Million
- By End-User – Market Size & Forecast 2020–2030, USD Million
- Market Size & Analysis
- Australia Positron Emission Tomography Market Outlook, 2020-2030F
- Market Size & Analysis
- By Revenues (USD Million)
- Market Share & Analysis
- By Product Type – Market Size & Forecast 2020–2030, USD Million
- By Modality- Market Size & Forecast 2020–2030, USD Million
- By Detector Type – Market Size & Forecast 2020–2030, USD Million
- By Application – Market Size & Forecast 2020–2030, USD Million
- By End-User – Market Size & Forecast 2020–2030, USD Million
- Market Size & Analysis
- Market Size & Analysis
- Global Positron Emission Tomography Market Strategic Imperatives for Growth & Success
- Competition Outlook
- Company Profiles
- GE HealthCare
- Business Description
- Product Portfolio
- Strategic Alliances or Partnerships
- Recent Developments
- Financial Details
- Others
- Siemens Healthineers AG
- Business Description
- Product Portfolio
- Strategic Alliances or Partnerships
- Recent Developments
- Financial Details
- Others
- Koninklijke Philips N.V.
- Business Description
- Product Portfolio
- Strategic Alliances or Partnerships
- Recent Developments
- Financial Details
- Others
- Canon Medical Systems Corp.
- Business Description
- Product Portfolio
- Strategic Alliances or Partnerships
- Recent Developments
- Financial Details
- Others
- United Imaging Healthcare Co. Ltd.
- Business Description
- Product Portfolio
- Strategic Alliances or Partnerships
- Recent Developments
- Financial Details
- Others
- Mediso Ltd.
- Business Description
- Product Portfolio
- Strategic Alliances or Partnerships
- Recent Developments
- Financial Details
- Others
- CMR Naviscan Corporation
- Business Description
- Product Portfolio
- Strategic Alliances or Partnerships
- Recent Developments
- Financial Details
- Others
- Bruker Corporation
- Business Description
- Product Portfolio
- Strategic Alliances or Partnerships
- Recent Developments
- Financial Details
- Others
- Positron Corporation
- Business Description
- Product Portfolio
- Strategic Alliances or Partnerships
- Recent Developments
- Financial Details
- Others
- Spectrum Dynamics Medical Ltd.
- Business Description
- Product Portfolio
- Strategic Alliances or Partnerships
- Recent Developments
- Financial Details
- Others
- Agfa HealthCare NV
- Business Description
- Product Portfolio
- Strategic Alliances or Partnerships
- Recent Developments
- Financial Details
- Others
- Segami Corporation
- Business Description
- Product Portfolio
- Strategic Alliances or Partnerships
- Recent Developments
- Financial Details
- Others
- SOFIE Biosciences, Inc.
- Business Description
- Product Portfolio
- Strategic Alliances or Partnerships
- Recent Developments
- Financial Details
- Others
- Eckert & Ziegler Strlzg AG
- Business Description
- Product Portfolio
- Strategic Alliances or Partnerships
- Recent Developments
- Financial Details
- Others
- Neusoft Medical Systems Co. Ltd.
- Business Description
- Product Portfolio
- Strategic Alliances or Partnerships
- Recent Developments
- Financial Details
- Others
- Others
- GE HealthCare
- Company Profiles
- Disclaimer
MarkNtel Advisors follows a robust and iterative research methodology designed to ensure maximum accuracy and minimize deviation in market estimates and forecasts. Our approach combines both bottom-up and top-down techniques to effectively segment and quantify various aspects of the market. A consistent feature across all our research reports is data triangulation, which examines the market from three distinct perspectives to validate findings. Key components of our research process include:
1. Scope & Research Design At the outset, MarkNtel Advisors define the research objectives and formulate pertinent questions. This phase involves determining the type of research—qualitative or quantitative—and designing a methodology that outlines data collection methods, target demographics, and analytical tools. They also establish timelines and budgets to ensure the research aligns with client goals.
2. Sample Selection and Data Collection In this stage, the firm identifies the target audience and determines the appropriate sample size to ensure representativeness. They employ various sampling methods, such as random or stratified sampling, based on the research objectives. Data collection is carried out using tools like surveys, interviews, and observations, ensuring the gathered data is reliable and relevant.
3. Data Analysis and Validation Once data is collected, MarkNtel Advisors undertake a rigorous analysis process. This includes cleaning the data to remove inconsistencies, employing statistical software for quantitative analysis, and thematic analysis for qualitative data. Validation steps are taken to ensure the accuracy and reliability of the findings, minimizing biases and errors.

4. Data Forecast and FinalizationThe final phase involves forecasting future market trends based on the analyzed data. MarkNtel Advisors utilize predictive modeling and time series analysis to anticipate market behaviors. The insights are then compiled into comprehensive reports, featuring visual aids like charts and graphs, and include strategic recommendations to inform client decision-making
We offer flexible licensing options to cater to varying organizational needs. Choose the pricing pack that best suits your requirements:
Buy Now

