
Global Low Density Ceramic Proppant Market Research Report: Growth Drivers & Forecast (2026-2032)
By Type (Intermediate Strength Ceramic Proppants (ISP), Lightweight / Ultra-Lightweight Ceramic Proppants(ULW/LWP)), By Application (Shale Gas, Tight Oil, Coal Bed Methane (CBM), O ... thers), By Well Type (Horizontal Wells, Vertical Wells), By Grain Size (20/40 Mesh, 30/50 Mesh, 40/70 Mesh), and others Read more
- Chemicals
- Mar 2026
- Pages 400
- Report Format: PDF, Excel, PPT
Global Low Density Ceramic Proppant Market
Projected 4.7% CAGR from 2026 to 2032
Study Period
2026-2032
Market Size (2026)
USD 3.56 Billion
Market Size (2032)
USD 4.69 Billion
Largest Region
North America
Projected CAGR
4.7%
Leading Segments
By Application: Shale Gas
Global Low Density Ceramic Proppant Market Report Key Takeaways:
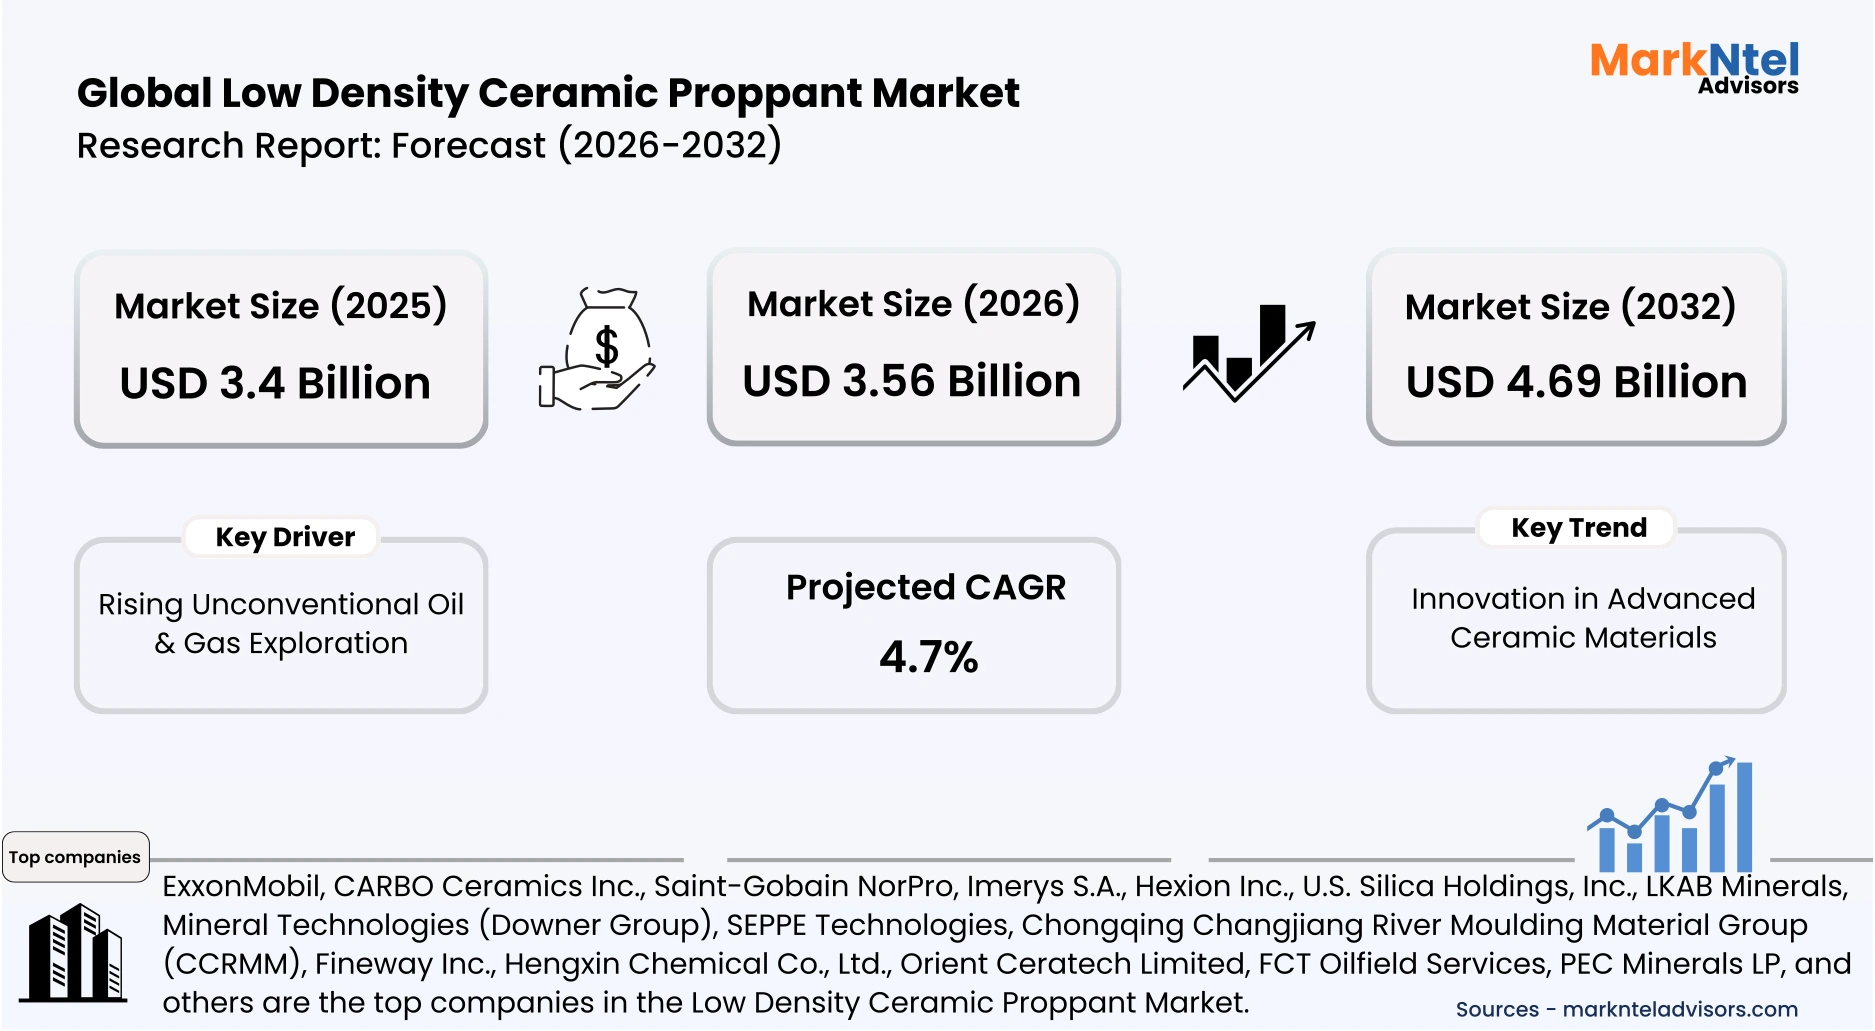
- The Global Low Density Ceramic Proppant Market size was valued at around USD 3.4 billion in 2025 and is projected grow from USD 3.56 billion in 2026 to USD 4.69 billion by 2032, exhibiting a CAGR of 4.7% during the forecast period.
- North America holds the largest market share of about 48.68% in the Global Low Density Ceramic Proppant Market in 2026.
- By Type, the Intermediate Strength Ceramic Proppants (ISP) segment represented a significant share of about 68% in the Global Low Density Ceramic Proppant Market in 2026.
- By Application, the Shale Gas segment seized a significant share of about 46% in the Global Low Density Ceramic Proppant Market in 2026.
- Leading Low Density Ceramic Proppant companies in the Global Market are ExxonMobil, CARBO Ceramics Inc., Saint-Gobain NorPro, Imerys S.A., Hexion Inc., U.S. Silica Holdings, Inc., LKAB Minerals, Mineral Technologies (Downer Group), SEPPE Technologies, Chongqing Changjiang River Moulding Material Group (CCRMM), Fineway Inc., Hengxin Chemical Co., Ltd., Xinmi Wanli Industry Development Co., Ltd., Orient Ceratech Limited, FCT Oilfield Services, PEC Minerals LP, and others.
Market Insights & Analysis: Global Low Density Ceramic Proppant Market (2026-32):
The Global Low Density Ceramic Proppant Market size was valued at around USD 3.4 billion in 2025 and is projected grow from USD 3.56 billion in 2026 to USD 4.69 billion by 2032, exhibiting a CAGR of 4.7% during the forecast period, i.e., 2026-32.
The global low density ceramic proppant market has demonstrated steady expansion, supported by the structural rise of unconventional oil and gas production over the past decade. According to the International Energy Agency, global upstream investment increased to approximately USD 535 billion in 2025 , reflecting renewed capital allocation toward shale and tight reservoirs. This growth has been underpinned by long-term energy security priorities and technological advancements in hydraulic fracturing. As a result, demand for high-performance proppants has evolved from niche usage to a critical input in modern well development.
Current market conditions are characterized by high drilling intensity and increasing proppant consumption per well, particularly across North America. The U.S. Energy Information Administration reported U.S. crude oil production reaching about 13.3 million barrels per day in 2025, largely driven by shale output . Industrial end users, particularly upstream oil and gas operators, are deploying longer horizontal wells requiring over 2,000 tons of proppant per well. This shift toward higher intensity completions is directly expanding material demand, reinforcing volume-driven market growth rather than price-led expansion.
Government policies and national development programs are further strengthening market expansion across emerging regions. In 2025, Argentina continued to support Vaca Muerta development through export incentives and infrastructure investments exceeding USD 50 billion, aimed at scaling unconventional production . Similarly, China has expanded shale gas subsidies and drilling targets under its national energy strategy, encouraging domestic output growth. These regulatory frameworks are fostering increased drilling activity, which in turn is accelerating the adoption of advanced ceramic proppants in technically demanding reservoirs.
Looking ahead, the market outlook remains positive as operators increasingly prioritize efficiency, recovery optimization, and sustainability. Leading companies such as ExxonMobil have introduced innovative lightweight proppants derived from refinery by-products, improving production efficiency while lowering costs. Simultaneously, advancements in digital reservoir modeling and completion design are optimizing proppant usage and placement. With continued global energy demand growth and expanding unconventional resource development, the market is expected to sustain strong volume expansion in the coming years.
Global Low Density Ceramic Proppant Market Recent Developments:
- 2025 : ExxonMobil accelerated the deployment of its proprietary petroleum coke–derived lightweight proppant across Permian Basin wells in 2025. The company reported improved fracture conductivity and production gains of up to 15%, with plans to use the material in over 200 wells annually, supporting large-scale commercialization of low-density proppant technologies.
Global Low Density Ceramic Proppant Market Scope:
| Category | Segments |
|---|---|
| By Type | (Intermediate Strength Ceramic Proppants (ISP), Lightweight / Ultra-Lightweight Ceramic Proppants(ULW/LWP)), |
| By Application | (Shale Gas, Tight Oil, Coal Bed Methane (CBM), Others), |
| By Well Type | (Horizontal Wells, Vertical Wells), |
| By Grain Size | (20/40 Mesh, 30/50 Mesh, 40/70 Mesh), and others |
Global Low Density Ceramic Proppant Market Driver:
Rising Unconventional Oil & Gas Exploration
The acceleration of unconventional oil and gas exploration has emerged as a structural driver due to sustained policy support and rising energy security concerns. The International Energy Agency reported that global oil demand reached approximately 103 million barrels per day in 2025, reinforcing the need for continued upstream expansion. Governments have responded by enabling increased leasing and faster approvals for shale development, particularly in North America. This has intensified drilling activity in tight formations, directly increasing the requirement for advanced hydraulic fracturing materials.
This driver is measurably expanding demand across industrial end users, particularly upstream oil and gas operators in the United States and China. The U.S. Energy Information Administration reported that the number of drilled but uncompleted wells (DUCs) declined significantly through 2025 as operators accelerated completions. In parallel, China's national energy strategies have accelerated the development of unconventional resources in basins such as Sichuan, increasing hydraulic fracturing operations. These developments are directly increasing proppant consumption across industrial upstream applications.
The impact of unconventional exploration is fundamentally volume-driven, as both well counts and proppant intensity per well are rising simultaneously. Modern shale wells require multi-stage fracturing with significantly larger proppant volumes, often exceeding historical norms by substantial margins. This structural shift ensures sustained material demand rather than temporary pricing effects, as each new well adds incremental consumption. Consequently, low density ceramic proppants are increasingly adopted in technically complex reservoirs where enhanced conductivity and durability are essential for maximizing hydrocarbon recovery.
Global Low Density Ceramic Proppant Market Trend:
Innovation in Advanced Ceramic Materials
Innovation in advanced ceramic materials has become the most significant structural trend in the low density ceramic proppant market as operators seek higher conductivity without the transport penalties of heavier proppants. This shift accelerated in 2025 as unconventional well designs grew more complex and completion strategies prioritized fracture coverage, durability, and recovery efficiency. ExxonMobil stated that its proprietary lightweight proppant, derived from refinery coke, improves production rates while lowering costs in Permian operations . That combination of materials engineering and field-scale deployment shows the market moving from conventional inputs toward performance-optimized proppants.
The trend is reshaping the value chain by pushing manufacturers and operators to integrate material science more directly into completion design and sourcing decisions. Instead of treating proppants as a standardized bulk input, producers are investing in formulations that improve transport deeper into fracture networks while maintaining crush resistance and conductivity under stress. Peer-reviewed research published in 2025 also reflects this direction, highlighting ongoing work on low-density, high-strength proppant design and fracture conductivity optimization for unconventional reservoirs . These changes are raising performance expectations across upstream industrial users, especially in shale and tight formations.
This trend is likely to persist because it is tied to long-term operating economics rather than a short-lived product cycle. As horizontal wells become longer and fracture systems more intensive, operators need proppants that support greater reservoir contact and more stable long-term output. ExxonMobil’s plan to use its lightweight proppant across roughly one-quarter of its 2025 wells, with wider deployment expected in 2026, indicates sustained adoption rather than isolated testing. As a result, innovation in advanced ceramic materials is materially influencing future product development, procurement strategies, and competitive positioning.
Global Low Density Ceramic Proppant Market Opportunity:
Increasing Demand for Enhanced Oil Recovery (EOR)
The growing emphasis on enhanced oil recovery (EOR) has emerged as a structural opportunity as operators seek to maximize output from aging and underperforming reservoirs. Industry data indicates that recovery rates in tight oil formations remain around 10%, significantly lower than the 30–70% achieved in conventional fields using EOR techniques . This gap has intensified focus on improving extraction efficiency through advanced recovery methods. As a result, both governments and operators are prioritizing technologies that can unlock additional reserves from existing assets.
This opportunity is translating into tangible demand through increased adoption of refracturing and advanced completion techniques. The U.S. government and major operators are actively pursuing strategies to improve recovery rates in unconventional reservoirs, with initiatives aimed at significantly enhancing output from existing wells. Similarly, Petroleum Development Oman is scaling hydraulic fracturing in low-pressure mature reservoirs to boost recovery performance. These developments directly increase the need for high-performance proppants capable of maintaining fracture conductivity under repeated stress conditions.
The opportunity is particularly favorable for new entrants, as EOR applications prioritize performance and innovation over scale-driven cost advantages. Unlike conventional fracturing markets dominated by large suppliers, EOR-focused projects require specialized materials tailored to complex reservoir conditions. This enables smaller players to differentiate through advanced ceramic formulations and customized solutions. Consequently, the expanding focus on recovery optimization is creating a scalable and less saturated market segment for emerging proppant manufacturers.
Global Low Density Ceramic Proppant Market Challenge:
Environmental Regulations on Hydraulic Fracturing
Stringent environmental regulations on hydraulic fracturing have emerged as a structural challenge, driven by concerns over water usage, emissions, and groundwater contamination. Regulatory bodies in regions such as the United States and the European Union have strengthened oversight on drilling activities, emissions reporting, and wastewater disposal. The U.S. Environmental Protection Agency expanded methane emission rules in 2025, requiring stricter monitoring and control across oil and gas operations. These regulatory developments have increased compliance complexity and operational scrutiny for hydraulic fracturing activities.
The impact is measurable across multiple regions, where regulatory restrictions have directly influenced drilling activity and project timelines. Several European countries, including France, continue to maintain bans or strict limitations on hydraulic fracturing, effectively restricting unconventional resource development. In the United States, operators are required to invest in emissions control technologies and water management systems, increasing operational costs. These compliance requirements slow project approvals and increase the overall cost of fracturing operations, indirectly reducing demand for proppants.
This challenge materially restricts market expansion by limiting the scale and pace of unconventional oil and gas development. As hydraulic fracturing faces increasing regulatory pressure, operators may delay or reduce drilling investments, directly affecting proppant consumption volumes. Additionally, new entrants face higher compliance costs and regulatory barriers, discouraging investment in both upstream operations and proppant manufacturing. Consequently, environmental regulations act as a systemic constraint on market growth, particularly in regions with stringent policy enforcement.
Global Low Density Ceramic Proppant Market (2026-32) Segmentation Analysis:
The Global Low Density Ceramic Proppant market study of MarkNtel Advisors evaluates & highlights the major trends and influencing factors in each segment. It includes predictions for the period 2026–32 at the global level. Based on the analysis, the market has been further classified as;
Based on Type:
- Intermediate Strength Ceramic Proppants (ISP)
- Lightweight / Ultra-Lightweight Ceramic Proppants (ULW/LWP)
Intermediate Strength Ceramic Proppants (ISP) dominate the Global Low Density Ceramic Proppant Market, accounting for approximately 68% of total demand, primarily because they offer an optimal balance between performance and cost efficiency. Unlike high-strength ceramics, ISPs provide sufficient crush resistance for most shale and tight oil reservoirs while remaining significantly more affordable. This makes them suitable for large-scale hydraulic fracturing operations where cost control is critical. Their ability to perform effectively under moderate stress conditions aligns with the majority of unconventional well requirements globally.
This dominance is further reinforced by the operational characteristics of key producing regions such as the United States, where shale formations like the Permian Basin operate under moderate closure pressures. According to the U.S. Energy Information Administration, continued growth in shale production has increased the number of horizontal wells requiring multi-stage fracturing. These wells typically prioritize cost-effective proppant solutions that can deliver reliable conductivity without the premium pricing of high-strength ceramics. ISPs meet this requirement, enabling operators to optimize both performance and well economics at scale.
Additionally, manufacturing scalability and supply chain efficiency contribute to ISP dominance. Compared to high-strength ceramic proppants, ISPs require relatively lower processing intensity, reducing production costs and enabling higher output volumes. This allows manufacturers to maintain a consistent supply across major oil and gas markets, supporting large-scale drilling programs. As operators increasingly focus on maximizing returns through cost-performance optimization, ISPs continue to hold a leading position due to their practical applicability across a wide range of reservoir conditions.
Based on Application:
- Shale Gas
- Tight Oil
- Coal Bed Methane (CBM)
- Others
Shale gas dominates the Global Low Density Ceramic Proppant Market by application, accounting for approximately 46% of total demand, primarily because shale reservoirs require intensive hydraulic fracturing with significantly higher proppant volumes per well. Unlike conventional formations, shale gas extraction depends on multi-stage horizontal drilling, where proppants are essential to maintain fracture conductivity and enable gas flow. Modern shale wells often require more than 2,000 tons of proppant per well, directly driving large-scale demand for advanced materials such as low density ceramic proppants.
This dominance is strongly supported by large-scale shale development in regions such as the United States. According to the U.S. Energy Information Administration, the addition of new shale formations in the Permian Basin increased recoverable resources by approximately 28.3 trillion cubic feet of natural gas . This expansion highlights the growing scale of shale resource availability, which directly translates into increased drilling and fracturing activity. As operators continue to develop these reserves, proppant consumption rises proportionally due to higher well counts and completion intensity.
Industrial infrastructure and operational standardization further reinforce this leadership position. The widespread availability of drilling rigs, completion technologies, and established supply chains enables continuous shale development at scale. Additionally, ongoing advancements such as longer lateral wells and optimized fracture designs are increasing proppant usage per operation. This combination of resource expansion, high material intensity, and scalable infrastructure ensures that shale gas remains the leading application segment in the global low density ceramic proppant market.
Global Low Density Ceramic Proppant Market (2026-32): Regional Projection
North America dominates the Global Low Density Ceramic Proppant Market, accounting for around 48.68% of total demand, primarily due to its unmatched scale of unconventional resource development and high-intensity hydraulic fracturing operations. According to the U.S. Energy Information Administration, U.S. natural gas production reached a record 118.5 billion cubic feet per day in 2025, largely driven by shale formations. This record output reflects sustained drilling and completion activity, directly increasing proppant consumption across major basins. The region’s reliance on multi-stage fracturing ensures consistently high material demand per well.
This dominance is further reinforced by strong investment momentum and export-driven expansion. In 2025, U.S. shale gas dealmaking reached approximately USD 28 billion, signaling significant capital inflows into upstream development and infrastructure . At the same time, U.S. LNG exports are projected to grow from 11.9 billion cubic feet per day in 2024 to 21.5 billion cubic feet per day by 2030, requiring continuous expansion of shale gas production . This export-led growth model directly drives higher drilling intensity and fracturing activity, thereby increasing demand for advanced proppants.
North America’s leadership is also supported by its advanced oilfield ecosystem and operational efficiency. The region benefits from established service providers, optimized logistics networks, and continuous technological advancements such as longer lateral wells and higher proppant loading per stage. These capabilities enable operators to scale production efficiently while maximizing recovery rates. As a result, the combination of record production levels, strong investment inflows, and export expansion firmly positions North America as the dominant regional market for low density ceramic proppants.
Gain a Competitive Edge with Our Global Low Density Ceramic Proppant Market Report:
- Global Low Density Ceramic Proppant Market Report by MarkNtel Advisors provides a detailed & thorough analysis of market size & share, growth rate, competitive landscape, and key players. This comprehensive analysis helps businesses gain a holistic understanding of the market dynamics & make informed decisions.
- This report also highlights current market trends & future projections, allowing businesses to identify emerging opportunities & potential challenges. By understanding market forecasts, companies can align their strategies & stay ahead of the competition.
- Global Low Density Ceramic Proppant Market Report aids in assessing & mitigating risks associated with entering or operating in the market. By understanding market dynamics, regulatory frameworks, and potential challenges, businesses can develop strategies to minimize risks & optimize their operations.
*Reports Delivery Format - Market research studies from MarkNtel Advisors are offered in PDF, Excel and PowerPoint formats. Within 24 hours of the payment being successfully received, the report will be sent to your email address.
Frequently Asked Questions
- Market Segmentation
- Introduction
- Product Definition
- Research Process
- Assumptions
- Executive Summary
- Global Low Density Ceramic Proppant Market Policies, Regulations, and Product Standards
- Global Low Density Ceramic Proppant Market Trends & Developments
- Global Low Density Ceramic Proppant Market Dynamics
- Growth Factors
- Challenges
- Global Low Density Ceramic Proppant Market Hotspot & Opportunities
- Global Low Density Ceramic Proppant Market Outlook, 2022-2032F
- Market Size & Outlook
- By Revenues (USD Million)
- By Volume (Million Tons)
- Market Share & Analysis
- By Type- Market Size & Forecast 2022-2032, USD Million & Million Tons
- Intermediate Strength Ceramic Proppants (ISP)
- Lightweight / Ultra-Lightweight Ceramic Proppants (ULW/LWP)
- By Application- Market Size & Forecast 2022-2032, USD Million & Million Tons
- Shale Gas
- Tight Oil
- Coal Bed Methane (CBM)
- Others
- By Well Type- Market Size & Forecast 2022-2032, USD Million & Million Tons
- Horizontal Wells
- Vertical Wells
- By Grain Size- Market Size & Forecast 2022-2032, USD Million & Million Tons
- 20/40 Mesh
- 30/50 Mesh
- 40/70 Mesh
- By Region
- North America
- South America
- Europe
- The Middle East & Africa
- Asia-Pacific
- By Company
- Competition Characteristics
- Market Share & Analysis
- By Type- Market Size & Forecast 2022-2032, USD Million & Million Tons
- Market Size & Outlook
- North America Low Density Ceramic Proppant Market Outlook, 2022-2032F
- Market Size & Outlook
- By Revenues (USD Million)
- By Volume (Million Tons)
- Market Share & Analysis
- By Type- Market Size & Forecast 2022-2032, USD Million & Million Tons
- By Application- Market Size & Forecast 2022-2032, USD Million & Million Tons
- By Well Type- Market Size & Forecast 2022-2032, USD Million & Million Tons
- By Grain Size- Market Size & Forecast 2022-2032, USD Million & Million Tons
- By Country
- The US
- Canada
- Mexico
- Rest of North America
- The US Low Density Ceramic Proppant Market Outlook, 2022-2032F
- Market Size & Outlook
- By Revenues (USD Million)
- By Volume (Million Tons)
- Market Share & Analysis
- By Type- Market Size & Forecast 2022-2032, USD Million & Million Tons
- By Application- Market Size & Forecast 2022-2032, USD Million & Million Tons
- By Well Type- Market Size & Forecast 2022-2032, USD Million & Million Tons
- By Grain Size- Market Size & Forecast 2022-2032, USD Million & Million Tons
- Market Size & Outlook
- Canada Low Density Ceramic Proppant Market Outlook, 2022-2032F
- Market Size & Outlook
- By Revenues (USD Million)
- By Volume (Million Tons)
- Market Share & Analysis
- By Type- Market Size & Forecast 2022-2032, USD Million & Million Tons
- By Application- Market Size & Forecast 2022-2032, USD Million & Million Tons
- By Well Type- Market Size & Forecast 2022-2032, USD Million & Million Tons
- By Grain Size- Market Size & Forecast 2022-2032, USD Million & Million Tons
- Market Size & Outlook
- Mexico Low Density Ceramic Proppant Market Outlook, 2022-2032F
- Market Size & Outlook
- By Revenues (USD Million)
- By Volume (Million Tons)
- Market Share & Analysis
- By Type- Market Size & Forecast 2022-2032, USD Million & Million Tons
- By Application- Market Size & Forecast 2022-2032, USD Million & Million Tons
- By Well Type- Market Size & Forecast 2022-2032, USD Million & Million Tons
- By Grain Size- Market Size & Forecast 2022-2032, USD Million & Million Tons
- Market Size & Outlook
- Market Size & Outlook
- South America Low Density Ceramic Proppant Market Outlook, 2022-2032F
- Market Size & Outlook
- By Revenues (USD Million)
- By Volume (Million Tons)
- Market Share & Analysis
- By Type- Market Size & Forecast 2022-2032, USD Million & Million Tons
- By Application- Market Size & Forecast 2022-2032, USD Million & Million Tons
- By Well Type- Market Size & Forecast 2022-2032, USD Million & Million Tons
- By Grain Size- Market Size & Forecast 2022-2032, USD Million & Million Tons
- By Country
- Brazil
- Argentina
- Rest of South America
- Brazil Low Density Ceramic Proppant Market Outlook, 2022-2032F
- Market Size & Outlook
- By Revenues (USD Million)
- By Volume (Million Tons)
- Market Share & Analysis
- By Type- Market Size & Forecast 2022-2032, USD Million & Million Tons
- By Application- Market Size & Forecast 2022-2032, USD Million & Million Tons
- By Well Type- Market Size & Forecast 2022-2032, USD Million & Million Tons
- By Grain Size- Market Size & Forecast 2022-2032, USD Million & Million Tons
- Market Size & Outlook
- Argentina Low Density Ceramic Proppant Market Outlook, 2022-2032F
- Market Size & Outlook
- By Revenues (USD Million)
- By Volume (Million Tons)
- Market Share & Analysis
- By Type- Market Size & Forecast 2022-2032, USD Million & Million Tons
- By Application- Market Size & Forecast 2022-2032, USD Million & Million Tons
- By Well Type- Market Size & Forecast 2022-2032, USD Million & Million Tons
- By Grain Size- Market Size & Forecast 2022-2032, USD Million & Million Tons
- Market Size & Outlook
- Market Size & Outlook
- Europe Low Density Ceramic Proppant Market Outlook, 2022-2032F
- Market Size & Outlook
- By Revenues (USD Million)
- By Volume (Million Tons)
- Market Share & Analysis
- By Type- Market Size & Forecast 2022-2032, USD Million & Million Tons
- By Application- Market Size & Forecast 2022-2032, USD Million & Million Tons
- By Well Type- Market Size & Forecast 2022-2032, USD Million & Million Tons
- By Grain Size- Market Size & Forecast 2022-2032, USD Million & Million Tons
- By Country
- The UK
- Germany
- France
- Italy
- Switzerland
- BENELUX
- Rest of Europe
- The UK Low Density Ceramic Proppant Market Outlook, 2022-2032F
- Market Size & Outlook
- By Revenues (USD Million)
- By Volume (Million Tons)
- Market Share & Analysis
- By Type- Market Size & Forecast 2022-2032, USD Million & Million Tons
- By Application- Market Size & Forecast 2022-2032, USD Million & Million Tons
- By Well Type- Market Size & Forecast 2022-2032, USD Million & Million Tons
- By Grain Size- Market Size & Forecast 2022-2032, USD Million & Million Tons
- Market Size & Outlook
- Germany Low Density Ceramic Proppant Market Outlook, 2022-2032F
- Market Size & Outlook
- By Revenues (USD Million)
- By Volume (Million Tons)
- Market Share & Analysis
- By Type- Market Size & Forecast 2022-2032, USD Million & Million Tons
- By Application- Market Size & Forecast 2022-2032, USD Million & Million Tons
- By Well Type- Market Size & Forecast 2022-2032, USD Million & Million Tons
- By Grain Size- Market Size & Forecast 2022-2032, USD Million & Million Tons
- Market Size & Outlook
- France Low Density Ceramic Proppant Market Outlook, 2022-2032F
- Market Size & Outlook
- By Revenues (USD Million)
- By Volume (Million Tons)
- Market Share & Analysis
- By Type- Market Size & Forecast 2022-2032, USD Million & Million Tons
- By Application- Market Size & Forecast 2022-2032, USD Million & Million Tons
- By Well Type- Market Size & Forecast 2022-2032, USD Million & Million Tons
- By Grain Size- Market Size & Forecast 2022-2032, USD Million & Million Tons
- Market Size & Outlook
- Italy Low Density Ceramic Proppant Market Outlook, 2022-2032F
- Market Size & Outlook
- By Revenues (USD Million)
- By Volume (Million Tons)
- Market Share & Analysis
- By Type- Market Size & Forecast 2022-2032, USD Million & Million Tons
- By Application- Market Size & Forecast 2022-2032, USD Million & Million Tons
- By Well Type- Market Size & Forecast 2022-2032, USD Million & Million Tons
- By Grain Size- Market Size & Forecast 2022-2032, USD Million & Million Tons
- Market Size & Outlook
- Switzerland Low Density Ceramic Proppant Market Outlook, 2022-2032F
- Market Size & Outlook
- By Revenues (USD Million)
- By Volume (Million Tons)
- Market Share & Analysis
- By Type- Market Size & Forecast 2022-2032, USD Million & Million Tons
- By Application- Market Size & Forecast 2022-2032, USD Million & Million Tons
- By Well Type- Market Size & Forecast 2022-2032, USD Million & Million Tons
- By Grain Size- Market Size & Forecast 2022-2032, USD Million & Million Tons
- Market Size & Outlook
- BENELUX Low Density Ceramic Proppant Market Outlook, 2022-2032F
- Market Size & Outlook
- By Revenues (USD Million)
- By Volume (Million Tons)
- Market Share & Analysis
- By Type- Market Size & Forecast 2022-2032, USD Million & Million Tons
- By Application- Market Size & Forecast 2022-2032, USD Million & Million Tons
- By Well Type- Market Size & Forecast 2022-2032, USD Million & Million Tons
- By Grain Size- Market Size & Forecast 2022-2032, USD Million & Million Tons
- Market Size & Outlook
- Market Size & Outlook
- The Middle East & Africa Low Density Ceramic Proppant Market Outlook, 2022-2032F
- Market Size & Outlook
- By Revenues (USD Million)
- By Volume (Million Tons)
- Market Share & Analysis
- By Type- Market Size & Forecast 2022-2032, USD Million & Million Tons
- By Application- Market Size & Forecast 2022-2032, USD Million & Million Tons
- By Well Type- Market Size & Forecast 2022-2032, USD Million & Million Tons
- By Grain Size- Market Size & Forecast 2022-2032, USD Million & Million Tons
- By Country
- Saudi Arabia
- UAE
- Qatar
- Turkey
- Israel
- South Africa
- Egypt
- Rest of the Middle East & Africa
- Saudi Arabia Low Density Ceramic Proppant Market Outlook, 2022-2032F
- Market Size & Outlook
- By Revenues (USD Million)
- By Volume (Million Tons)
- Market Share & Analysis
- By Type- Market Size & Forecast 2022-2032, USD Million & Million Tons
- By Application- Market Size & Forecast 2022-2032, USD Million & Million Tons
- By Well Type- Market Size & Forecast 2022-2032, USD Million & Million Tons
- By Grain Size- Market Size & Forecast 2022-2032, USD Million & Million Tons
- Market Size & Outlook
- UAE Low Density Ceramic Proppant Market Outlook, 2022-2032F
- Market Size & Outlook
- By Revenues (USD Million)
- By Volume (Million Tons)
- Market Share & Analysis
- By Type- Market Size & Forecast 2022-2032, USD Million & Million Tons
- By Application- Market Size & Forecast 2022-2032, USD Million & Million Tons
- By Well Type- Market Size & Forecast 2022-2032, USD Million & Million Tons
- By Grain Size- Market Size & Forecast 2022-2032, USD Million & Million Tons
- Market Size & Outlook
- Qatar Low Density Ceramic Proppant Market Outlook, 2022-2032F
- Market Size & Outlook
- By Revenues (USD Million)
- By Volume (Million Tons)
- Market Share & Analysis
- By Type- Market Size & Forecast 2022-2032, USD Million & Million Tons
- By Application- Market Size & Forecast 2022-2032, USD Million & Million Tons
- By Well Type- Market Size & Forecast 2022-2032, USD Million & Million Tons
- By Grain Size- Market Size & Forecast 2022-2032, USD Million & Million Tons
- Market Size & Outlook
- Turkey Low Density Ceramic Proppant Market Outlook, 2022-2032F
- Market Size & Outlook
- By Revenues (USD Million)
- By Volume (Million Tons)
- Market Share & Analysis
- By Type- Market Size & Forecast 2022-2032, USD Million & Million Tons
- By Application- Market Size & Forecast 2022-2032, USD Million & Million Tons
- By Well Type- Market Size & Forecast 2022-2032, USD Million & Million Tons
- By Grain Size- Market Size & Forecast 2022-2032, USD Million & Million Tons
- Market Size & Outlook
- Israel Low Density Ceramic Proppant Market Outlook, 2022-2032F
- Market Size & Outlook
- By Revenues (USD Million)
- By Volume (Million Tons)
- Market Share & Analysis
- By Type- Market Size & Forecast 2022-2032, USD Million & Million Tons
- By Application- Market Size & Forecast 2022-2032, USD Million & Million Tons
- By Well Type- Market Size & Forecast 2022-2032, USD Million & Million Tons
- By Grain Size- Market Size & Forecast 2022-2032, USD Million & Million Tons
- Market Size & Outlook
- South Africa Low Density Ceramic Proppant Market Outlook, 2022-2032F
- Market Size & Outlook
- By Revenues (USD Million)
- By Volume (Million Tons)
- Market Share & Analysis
- By Type- Market Size & Forecast 2022-2032, USD Million & Million Tons
- By Application- Market Size & Forecast 2022-2032, USD Million & Million Tons
- By Well Type- Market Size & Forecast 2022-2032, USD Million & Million Tons
- By Grain Size- Market Size & Forecast 2022-2032, USD Million & Million Tons
- Market Size & Outlook
- Egypt Low Density Ceramic Proppant Market Outlook, 2022-2032F
- Market Size & Outlook
- By Revenues (USD Million)
- By Volume (Million Tons)
- Market Share & Analysis
- By Type- Market Size & Forecast 2022-2032, USD Million & Million Tons
- By Application- Market Size & Forecast 2022-2032, USD Million & Million Tons
- By Well Type- Market Size & Forecast 2022-2032, USD Million & Million Tons
- By Grain Size- Market Size & Forecast 2022-2032, USD Million & Million Tons
- Market Size & Outlook
- Market Size & Outlook
- Asia-Pacific Low Density Ceramic Proppant Market Outlook, 2022-2032F
- Market Size & Outlook
- By Revenues (USD Million)
- By Volume (Million Tons)
- Market Share & Analysis
- By Type- Market Size & Forecast 2022-2032, USD Million & Million Tons
- By Application- Market Size & Forecast 2022-2032, USD Million & Million Tons
- By Well Type- Market Size & Forecast 2022-2032, USD Million & Million Tons
- By Grain Size- Market Size & Forecast 2022-2032, USD Million & Million Tons
- By Country
- China
- Japan
- India
- South Korea
- Indonesia
- Australia
- Singapore
- Vietnam
- Rest of Asia-Pacific
- China Low Density Ceramic Proppant Market Outlook, 2022-2032F
- Market Size & Outlook
- By Revenues (USD Million)
- By Volume (Million Tons)
- Market Share & Analysis
- By Type- Market Size & Forecast 2022-2032, USD Million & Million Tons
- By Application- Market Size & Forecast 2022-2032, USD Million & Million Tons
- By Well Type- Market Size & Forecast 2022-2032, USD Million & Million Tons
- By Grain Size- Market Size & Forecast 2022-2032, USD Million & Million Tons
- Market Size & Outlook
- Japan Low Density Ceramic Proppant Market Outlook, 2022-2032F
- Market Size & Outlook
- By Revenues (USD Million)
- By Volume (Million Tons)
- Market Share & Analysis
- By Type- Market Size & Forecast 2022-2032, USD Million & Million Tons
- By Application- Market Size & Forecast 2022-2032, USD Million & Million Tons
- By Well Type- Market Size & Forecast 2022-2032, USD Million & Million Tons
- By Grain Size- Market Size & Forecast 2022-2032, USD Million & Million Tons
- Market Size & Outlook
- India Low Density Ceramic Proppant Market Outlook, 2022-2032F
- Market Size & Outlook
- By Revenues (USD Million)
- By Volume (Million Tons)
- Market Share & Analysis
- By Type- Market Size & Forecast 2022-2032, USD Million & Million Tons
- By Application- Market Size & Forecast 2022-2032, USD Million & Million Tons
- By Well Type- Market Size & Forecast 2022-2032, USD Million & Million Tons
- By Grain Size- Market Size & Forecast 2022-2032, USD Million & Million Tons
- Market Size & Outlook
- South Korea Low Density Ceramic Proppant Market Outlook, 2022-2032F
- Market Size & Outlook
- By Revenues (USD Million)
- By Volume (Million Tons)
- Market Share & Analysis
- By Type- Market Size & Forecast 2022-2032, USD Million & Million Tons
- By Application- Market Size & Forecast 2022-2032, USD Million & Million Tons
- By Well Type- Market Size & Forecast 2022-2032, USD Million & Million Tons
- By Grain Size- Market Size & Forecast 2022-2032, USD Million & Million Tons
- Market Size & Outlook
- Indonesia Low Density Ceramic Proppant Market Outlook, 2022-2032F
- Market Size & Outlook
- By Revenues (USD Million)
- By Volume (Million Tons)
- Market Share & Analysis
- By Type- Market Size & Forecast 2022-2032, USD Million & Million Tons
- By Application- Market Size & Forecast 2022-2032, USD Million & Million Tons
- By Well Type- Market Size & Forecast 2022-2032, USD Million & Million Tons
- By Grain Size- Market Size & Forecast 2022-2032, USD Million & Million Tons
- Market Size & Outlook
- Australia Low Density Ceramic Proppant Market Outlook, 2022-2032F
- Market Size & Outlook
- By Revenues (USD Million)
- By Volume (Million Tons)
- Market Share & Analysis
- By Type- Market Size & Forecast 2022-2032, USD Million & Million Tons
- By Application- Market Size & Forecast 2022-2032, USD Million & Million Tons
- By Well Type- Market Size & Forecast 2022-2032, USD Million & Million Tons
- By Grain Size- Market Size & Forecast 2022-2032, USD Million & Million Tons
- Market Size & Outlook
- Singapore Low Density Ceramic Proppant Market Outlook, 2022-2032F
- Market Size & Outlook
- By Revenues (USD Million)
- By Volume (Million Tons)
- Market Share & Analysis
- By Type- Market Size & Forecast 2022-2032, USD Million & Million Tons
- By Application- Market Size & Forecast 2022-2032, USD Million & Million Tons
- By Well Type- Market Size & Forecast 2022-2032, USD Million & Million Tons
- By Grain Size- Market Size & Forecast 2022-2032, USD Million & Million Tons
- Market Size & Outlook
- Vietnam Low Density Ceramic Proppant Market Outlook, 2022-2032F
- Market Size & Outlook
- By Revenues (USD Million)
- By Volume (Million Tons)
- Market Share & Analysis
- By Type- Market Size & Forecast 2022-2032, USD Million & Million Tons
- By Application- Market Size & Forecast 2022-2032, USD Million & Million Tons
- By Well Type- Market Size & Forecast 2022-2032, USD Million & Million Tons
- By Grain Size- Market Size & Forecast 2022-2032, USD Million & Million Tons
- Market Size & Outlook
- Market Size & Outlook
- Global Low Density Ceramic Proppant Market Key Strategic Imperatives for Success & Growth
- Competitive Outlook
- Company Profiles
- ExxonMobil
- Business Description
- Product Portfolio
- Collaborations & Alliances
- Recent Developments
- Financial Details
- Others
- CARBO Ceramics Inc.
- Business Description
- Product Portfolio
- Collaborations & Alliances
- Recent Developments
- Financial Details
- Others
- Saint-Gobain NorPro
- Business Description
- Product Portfolio
- Collaborations & Alliances
- Recent Developments
- Financial Details
- Others
- Imerys S.A.
- Business Description
- Product Portfolio
- Collaborations & Alliances
- Recent Developments
- Financial Details
- Others
- Hexion Inc.
- Business Description
- Product Portfolio
- Collaborations & Alliances
- Recent Developments
- Financial Details
- Others
- U.S. Silica Holdings, Inc.
- Business Description
- Product Portfolio
- Collaborations & Alliances
- Recent Developments
- Financial Details
- Others
- LKAB Minerals
- Business Description
- Product Portfolio
- Collaborations & Alliances
- Recent Developments
- Financial Details
- Others
- Mineral Technologies (Downer Group)
- Business Description
- Product Portfolio
- Collaborations & Alliances
- Recent Developments
- Financial Details
- Others
- SEPPE Technologies
- Business Description
- Product Portfolio
- Collaborations & Alliances
- Recent Developments
- Financial Details
- Others
- Chongqing Changjiang River Moulding Material Group (CCRMM)
- Business Description
- Product Portfolio
- Collaborations & Alliances
- Recent Developments
- Financial Details
- Others
- Fineway Inc.
- Business Description
- Product Portfolio
- Collaborations & Alliances
- Recent Developments
- Financial Details
- Others
- Hengxin Chemical Co., Ltd.
- Business Description
- Product Portfolio
- Collaborations & Alliances
- Recent Developments
- Financial Details
- Others
- Xinmi Wanli Industry Development Co., Ltd.
- Business Description
- Product Portfolio
- Collaborations & Alliances
- Recent Developments
- Financial Details
- Others
- Orient Ceratech Limited
- Business Description
- Product Portfolio
- Collaborations & Alliances
- Recent Developments
- Financial Details
- Others
- FCT Oilfield Services
- Business Description
- Product Portfolio
- Collaborations & Alliances
- Recent Developments
- Financial Details
- Others
- PEC Minerals LP
- Business Description
- Product Portfolio
- Collaborations & Alliances
- Recent Developments
- Financial Details
- Others
- Others
- Business Description
- Product Portfolio
- Collaborations & Alliances
- Recent Developments
- Financial Details
- Others
- ExxonMobil
- Company Profiles
- Disclaimer
MarkNtel Advisors follows a robust and iterative research methodology designed to ensure maximum accuracy and minimize deviation in market estimates and forecasts. Our approach combines both bottom-up and top-down techniques to effectively segment and quantify various aspects of the market. A consistent feature across all our research reports is data triangulation, which examines the market from three distinct perspectives to validate findings. Key components of our research process include:
1. Scope & Research Design At the outset, MarkNtel Advisors define the research objectives and formulate pertinent questions. This phase involves determining the type of research—qualitative or quantitative—and designing a methodology that outlines data collection methods, target demographics, and analytical tools. They also establish timelines and budgets to ensure the research aligns with client goals.
2. Sample Selection and Data Collection In this stage, the firm identifies the target audience and determines the appropriate sample size to ensure representativeness. They employ various sampling methods, such as random or stratified sampling, based on the research objectives. Data collection is carried out using tools like surveys, interviews, and observations, ensuring the gathered data is reliable and relevant.
3. Data Analysis and Validation Once data is collected, MarkNtel Advisors undertake a rigorous analysis process. This includes cleaning the data to remove inconsistencies, employing statistical software for quantitative analysis, and thematic analysis for qualitative data. Validation steps are taken to ensure the accuracy and reliability of the findings, minimizing biases and errors.

4. Data Forecast and FinalizationThe final phase involves forecasting future market trends based on the analyzed data. MarkNtel Advisors utilize predictive modeling and time series analysis to anticipate market behaviors. The insights are then compiled into comprehensive reports, featuring visual aids like charts and graphs, and include strategic recommendations to inform client decision-making
We offer flexible licensing options to cater to varying organizational needs. Choose the pricing pack that best suits your requirements:
Buy Now

